Misc
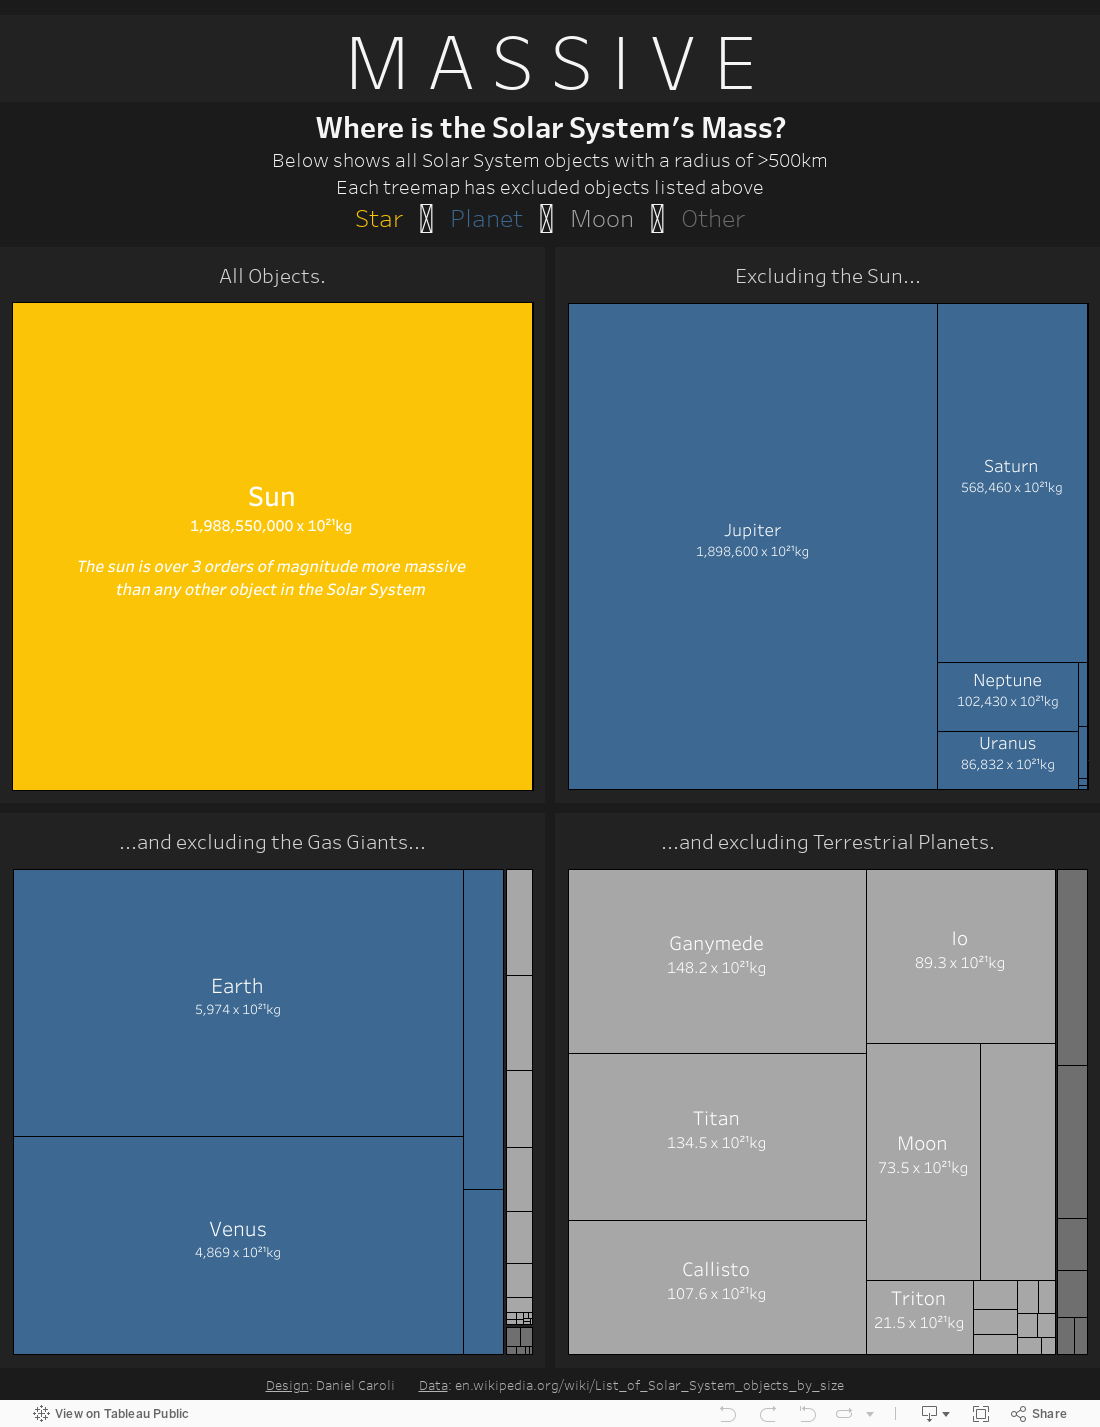
Visualized: The Mass of the Entire Solar System
var divElement = document.getElementById(‘viz1557945536256’); var vizElement = divElement.getElementsByTagName(‘object’)[0]; if ( divElement.offsetWidth > 800 ) { vizElement.style.width=’1200px’;vizElement.style.height=’1427px’;} else if ( divElement.offsetWidth > 500 ) { vizElement.style.width=’1200px’;vizElement.style.height=’1427px’;} else { vizElement.style.width=’100%’;vizElement.style.height=’1327px’;} var scriptElement = document.createElement(‘script’); scriptElement.src = ‘https://public.tableau.com/javascripts/api/viz_v1.js’; vizElement.parentNode.insertBefore(scriptElement, vizElement);
Visualized: The Mass of the Entire Solar System
In space, everything feels weightless due to the lack of gravity.
So how do you measure the weight of objects in space? You don’t. When it comes to the cosmos, all that matters is mass.
Today’s interactive data visualization comes from Reddit user Ranger-UK, and is designed by Daniel Caroli. It delves into the different masses which make up our solar system, and how they all compare in size.
A Star Is Born
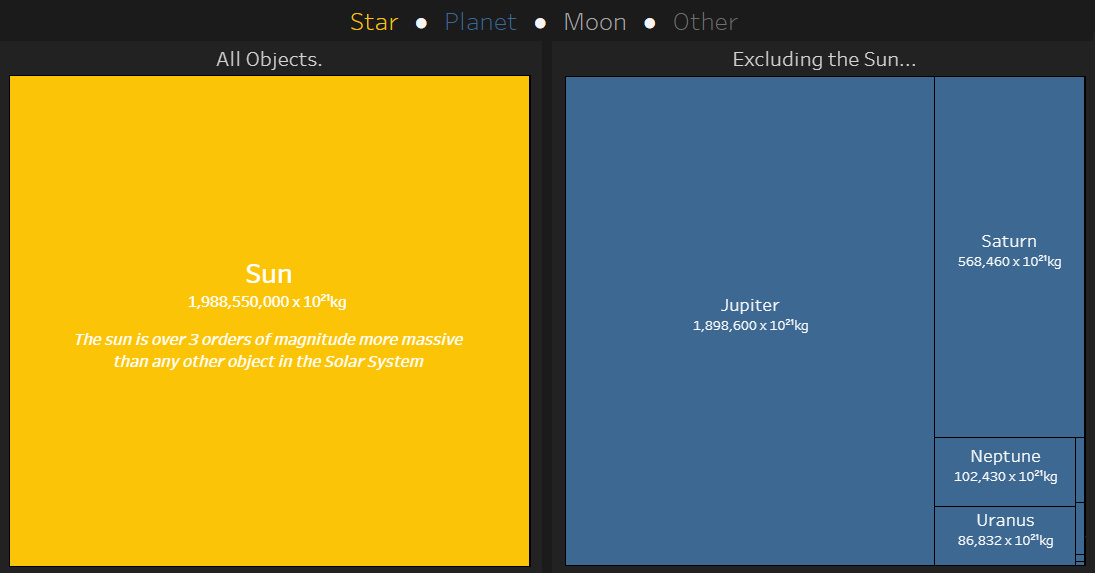
Perhaps not surprisingly, the Sun eclipses all other nearby objects by mass. At the heart of our solar system, this yellow dwarf’s gravity is what holds it all together.
The Sun actually makes up 99.8% of our entire solar system’s mass — and we’re lucky to be living in the other 0.2%. Responsible for all life on Earth, it’s no wonder that various cultures have worshiped the Sun throughout history, and even dedicated deities to it.
Currently in its middle years — the sun is over four billion years old, and it’s predicted to remain stable for another five billion years. After this, it will overtake the orbits of Mercury and Venus and then shrink back to the size of a white dwarf.
Out Of This World
The gas giants are all more than ten times as massive as Earth, even though they’re mainly made up of hydrogen and helium. They dominate the Solar System’s real estate — once the Sun is taken out of the equation, of course.
In order, here’s how the planets stack up:
| Planet | Category | Mass | Radius | Density |
|---|---|---|---|---|
| Jupiter | Gas giant | 1,898,600 x 10²¹ kg | 69,911 ±6 km | 1.326g/cm³ |
| Saturn | Gas giant | 568,460 x 10²¹ kg | 58,232 ±6 km (*without rings) | 0.687g/cm³ |
| Neptune | Gas giant | 102,430 x 10²¹ kg | 24,622 ±19 km | 1.638g/cm³ |
| Uranus | Gas giant | 86,832 x 10²¹ kg | 25,362 ±7 km | 1.27g/cm³ |
| Earth | Terrestrial planet | 5,974 x 10²¹ kg | 6.371 ±0.01 km | 5.514g/cm³ |
| Venus | Terrestrial planet | 4,869 x 10²¹ kg | 6,051.8 ±1 km (*without gas) | 5.243g/cm³ |
| Mars | Terrestrial planet | 642 x 10²¹ kg | 3,389.5 ±0.2 km | 3.9335g/cm³ |
| Mercury | Terrestrial planet | 330 x 10²¹ kg | 2,439.7 ±1 km | 5.427g/cm³ |
Satellites Out of Control
The further away from the Sun you go, the more moons can be found orbiting planets. Earth’s singular moon is the fifth largest of almost 200 natural satellites found in the solar system.
Mars has two moons that don’t make it into the visualization above due to their low masses:
- Phobos: 1.08×10^16 kg
- Deimos: 2.0×10^15 kg
Here’s a breakdown of some other moons out there:
- Jupiter
Total named: 53
Biggest moons: Ganymede, Callisto, Io, Europa
These four can be seen easily with some help from binoculars. - Saturn
Total named: 53
Biggest moons: Titan, Rhea, Iapetus, Dione, and Tethys - Uranus
Total named: 27
Biggest moons: Titania, Oberon, Ariel, Umbriel - Neptune
Total named: 14
Biggest moon: Triton, which is as big as the dwarf planet Pluto.
Pluto and some “leftovers” of the solar system lie in the distant region of the doughnut-shaped Kuiper belt, between 30 to 50 astronomical units (AU) away. Beginning at the orbit of Neptune, the belt encompasses some of those objects in the visualization categorized as “other”.
So far, we’ve only managed to set foot on our own moon. NASA’s Opportunity rover helped us explore the Red Planet virtually for over 14 years, while the Curiosity is still going strong.
Who knows what else lurks beyond the edges of our solar system?
It suddenly struck me that that tiny pea, pretty and blue, was the Earth… I didn’t feel like a giant. I felt very, very small.
— Neil Armstrong, looking back at the Earth from the Moon (July 1969)


VC+
VC+: Get Our Key Takeaways From the IMF’s World Economic Outlook
A sneak preview of the exclusive VC+ Special Dispatch—your shortcut to understanding IMF’s World Economic Outlook report.

Have you read IMF’s latest World Economic Outlook yet? At a daunting 202 pages, we don’t blame you if it’s still on your to-do list.
But don’t worry, you don’t need to read the whole April release, because we’ve already done the hard work for you.
To save you time and effort, the Visual Capitalist team has compiled a visual analysis of everything you need to know from the report—and our VC+ Special Dispatch is available exclusively to VC+ members. All you need to do is log into the VC+ Archive.
If you’re not already subscribed to VC+, make sure you sign up now to access the full analysis of the IMF report, and more (we release similar deep dives every week).
For now, here’s what VC+ members get to see.
Your Shortcut to Understanding IMF’s World Economic Outlook
With long and short-term growth prospects declining for many countries around the world, this Special Dispatch offers a visual analysis of the key figures and takeaways from the IMF’s report including:
- The global decline in economic growth forecasts
- Real GDP growth and inflation forecasts for major nations in 2024
- When interest rate cuts will happen and interest rate forecasts
- How debt-to-GDP ratios have changed since 2000
- And much more!

Get the Full Breakdown in the Next VC+ Special Dispatch
VC+ members can access the full Special Dispatch by logging into the VC+ Archive, where you can also check out previous releases.
Make sure you join VC+ now to see exclusive charts and the full analysis of key takeaways from IMF’s World Economic Outlook.
Don’t miss out. Become a VC+ member today.
What You Get When You Become a VC+ Member
VC+ is Visual Capitalist’s premium subscription. As a member, you’ll get the following:
- Special Dispatches: Deep dive visual briefings on crucial reports and global trends
- Markets This Month: A snappy summary of the state of the markets and what to look out for
- The Trendline: Weekly curation of the best visualizations from across the globe
- Global Forecast Series: Our flagship annual report that covers everything you need to know related to the economy, markets, geopolitics, and the latest tech trends
- VC+ Archive: Hundreds of previously released VC+ briefings and reports that you’ve been missing out on, all in one dedicated hub
You can get all of the above, and more, by joining VC+ today.

-

 Debt1 week ago
How Debt-to-GDP Ratios Have Changed Since 2000
-

 Markets2 weeks ago
Ranked: The World’s Top Flight Routes, by Revenue
-

 Countries2 weeks ago
Population Projections: The World’s 6 Largest Countries in 2075
-

 Markets2 weeks ago
The Top 10 States by Real GDP Growth in 2023
-

 Demographics2 weeks ago
The Smallest Gender Wage Gaps in OECD Countries
-

 United States2 weeks ago
Where U.S. Inflation Hit the Hardest in March 2024
-

 Green2 weeks ago
Top Countries By Forest Growth Since 2001
-

 United States2 weeks ago
Ranked: The Largest U.S. Corporations by Number of Employees