Mining
Visualizing the World’s Largest Iron Ore Producers
![]() Subscribe to the Elements free mailing list for more like this
Subscribe to the Elements free mailing list for more like this
Visualizing the World’s Largest Iron Ore Producers
This was originally posted on Elements. Sign up to the free mailing list to get beautiful visualizations on natural resource megatrends in your email every week.
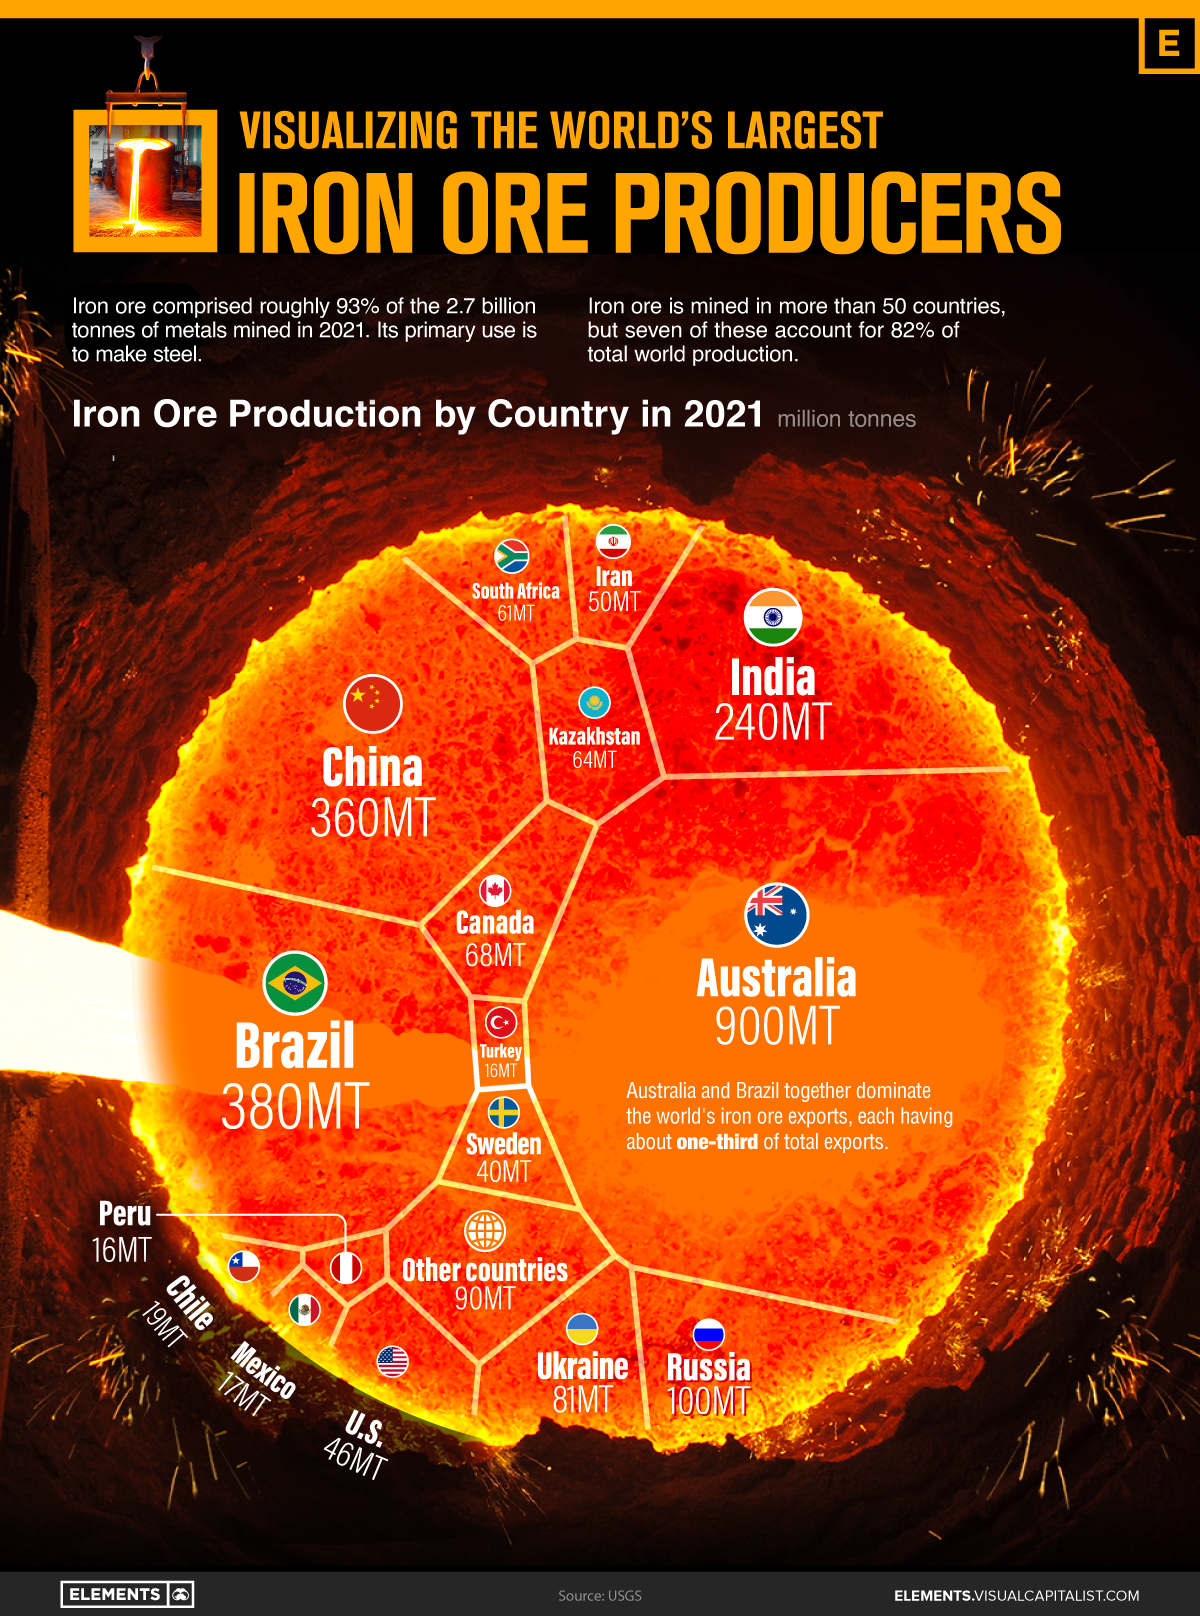
Iron ore comprised roughly 93% of the 2.7 billion tonnes of metals mined in 2021.
It is used primarily (98%) to make steel, with the remaining 2% becoming magnets, auto parts, and catalysts.
Using data from the U.S. Geological Survey, the above infographic lists the world’s largest iron ore producers in 2021.
Pilbara and Carajás Iron Ore
Iron is the fourth most abundant element on the planet after oxygen, silicon, and aluminum, constituting about 5% of the Earth’s crust.
Australia produced 35% of the iron ore mined last year. Almost 90% of identified iron ore resources in the country occur in Western Australia, especially in the Pilbara region.
The large and dry region is known for its Aboriginal peoples and also for its red earth as a result of a chemical reaction of iron exposed to air and water. The three major Pilbara iron ore producers are also among the top mining companies in the world: BHP Group, Rio Tinto Ltd, and Fortescue Metals.
| Country | 2021 Production (Tonnes) |
|---|---|
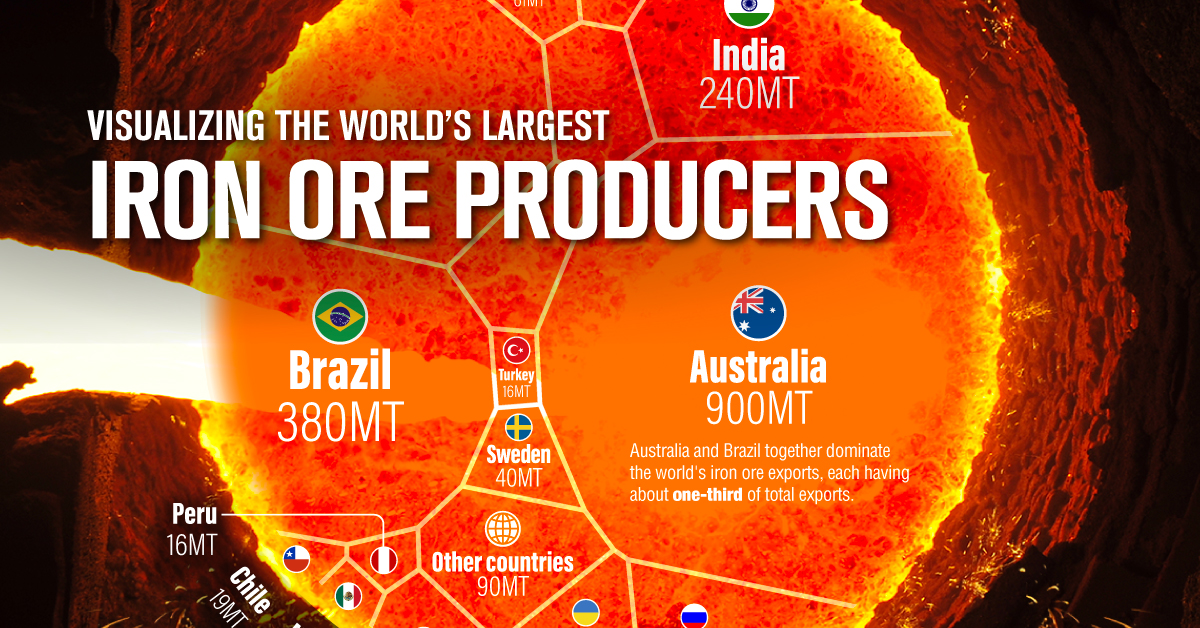
| 🇦🇺 Australia | 900,000,000 |
| 🇧🇷 Brazil | 380,000,000 |
| 🇨🇳 China | 360,000,000 |
| 🇮🇳 India | 240,000,000 |
| 🇷🇺 Russia | 100,000,000 |
| 🇺🇦 Ukraine | 81,000,000 |
| 🇨🇦 Canada | 68,000,000 |
| 🇿🇦 South Africa | 61,000,000 |
| 🇰🇿 Kazakhstan | 64,000,000 |
| 🇮🇷 Iran | 50,000,000 |
| 🇺🇸 United States | 46,000,000 |
| 🇸🇪 Sweden | 40,000,000 |
| 🇨🇱 Chile | 19,000,000 |
| 🇲🇽 Mexico | 17,000,000 |
| 🇵🇪 Peru | 16,000,000 |
| 🇹🇷 Turkey | 16,000,000 |
| 🌐 Other countries | 90,000,000 |
After Australia, Brazil is the second biggest producer, with iron ore accounting for 80% of the country’s mining exports.
Brazil’s biggest public company, Vale, is the world’s largest producer of iron ore and nickel. The company runs the Carajás mine, the largest iron ore mine in the world. Located in the state of Pará, in the north of the country, the mine is operated as an open-pit mine and is estimated to contain roughly 7.2 billion metric tons of iron ore.
Together, Australia and Brazil dominate the world’s iron ore exports, each having about one-third of total exports.
China is the largest consumer of iron ore, used to feed its steel industry.
Despite being the third largest producer, China still imports around 80% of the iron ore it uses each year. The country brought in 1.12 billion tonnes of the commodity last year.
Iron Ore’s Role in the Green Economy
Iron ore demand is expected to rise in the coming years as steel plays a crucial role in producing and distributing energy.
Steel is used extensively in agriculture, solar and wind power, and also in infrastructure for hydroelectric.
Furthermore, steel is used for the production of transformers, generators, and electric motors, along with ships, trucks, and trains.


Lithium
Ranked: The Top 10 EV Battery Manufacturers in 2023
Asia dominates this ranking of the world’s largest EV battery manufacturers in 2023.


The Top 10 EV Battery Manufacturers in 2023
This was originally posted on our Voronoi app. Download the app for free on iOS or Android and discover incredible data-driven charts from a variety of trusted sources.
Despite efforts from the U.S. and EU to secure local domestic supply, all major EV battery manufacturers remain based in Asia.
In this graphic we rank the top 10 EV battery manufacturers by total battery deployment (measured in megawatt-hours) in 2023. The data is from EV Volumes.
Chinese Dominance
Contemporary Amperex Technology Co. Limited (CATL) has swiftly risen in less than a decade to claim the title of the largest global battery group.
The Chinese company now has a 34% share of the market and supplies batteries to a range of made-in-China vehicles, including the Tesla Model Y, SAIC’s MG4/Mulan, and various Li Auto models.
| Company | Country | 2023 Production (megawatt-hour) | Share of Total Production |
|---|---|---|---|
| CATL | 🇨🇳 China | 242,700 | 34% |
| BYD | 🇨🇳 China | 115,917 | 16% |
| LG Energy Solution | 🇰🇷 Korea | 108,487 | 15% |
| Panasonic | 🇯🇵 Japan | 56,560 | 8% |
| SK On | 🇰🇷 Korea | 40,711 | 6% |
| Samsung SDI | 🇰🇷 Korea | 35,703 | 5% |
| CALB | 🇨🇳 China | 23,493 | 3% |
| Farasis Energy | 🇨🇳 China | 16,527 | 2% |
| Envision AESC | 🇨🇳 China | 8,342 | 1% |
| Sunwoda | 🇨🇳 China | 6,979 | 1% |
| Other | - | 56,040 | 8% |
In 2023, BYD surpassed LG Energy Solution to claim second place. This was driven by demand from its own models and growth in third-party deals, including providing batteries for the made-in-Germany Tesla Model Y, Toyota bZ3, Changan UNI-V, Venucia V-Online, as well as several Haval and FAW models.
The top three battery makers (CATL, BYD, LG) collectively account for two-thirds (66%) of total battery deployment.
Once a leader in the EV battery business, Panasonic now holds the fourth position with an 8% market share, down from 9% last year. With its main client, Tesla, now sourcing batteries from multiple suppliers, the Japanese battery maker seems to be losing its competitive edge in the industry.
Overall, the global EV battery market size is projected to grow from $49 billion in 2022 to $98 billion by 2029, according to Fortune Business Insights.

-

 Debt1 week ago
How Debt-to-GDP Ratios Have Changed Since 2000
-

 Markets2 weeks ago
Ranked: The World’s Top Flight Routes, by Revenue
-

 Countries2 weeks ago
Population Projections: The World’s 6 Largest Countries in 2075
-

 Markets2 weeks ago
The Top 10 States by Real GDP Growth in 2023
-

 Demographics2 weeks ago
The Smallest Gender Wage Gaps in OECD Countries
-

 United States2 weeks ago
Where U.S. Inflation Hit the Hardest in March 2024
-

 Green2 weeks ago
Top Countries By Forest Growth Since 2001
-

 United States2 weeks ago
Ranked: The Largest U.S. Corporations by Number of Employees