Economy
The Top 10 Biggest Companies in Brazil
The Top 10 Biggest Companies in Brazil
In 2009, the at-the-time emerging economies of Brazil, Russia, India, and China held their first formal summits as members of BRIC (with South Africa joining in 2010).
Together, BRICS represents 26.7% of the world’s land surface and 41.5% of its population. By GDP ranking, they’re also some of the most powerful economies in the world.
But what drives their economies? We’re highlighting the top 10 biggest companies in each country, starting with Brazil.
What Are the Biggest Public Companies in Brazil?
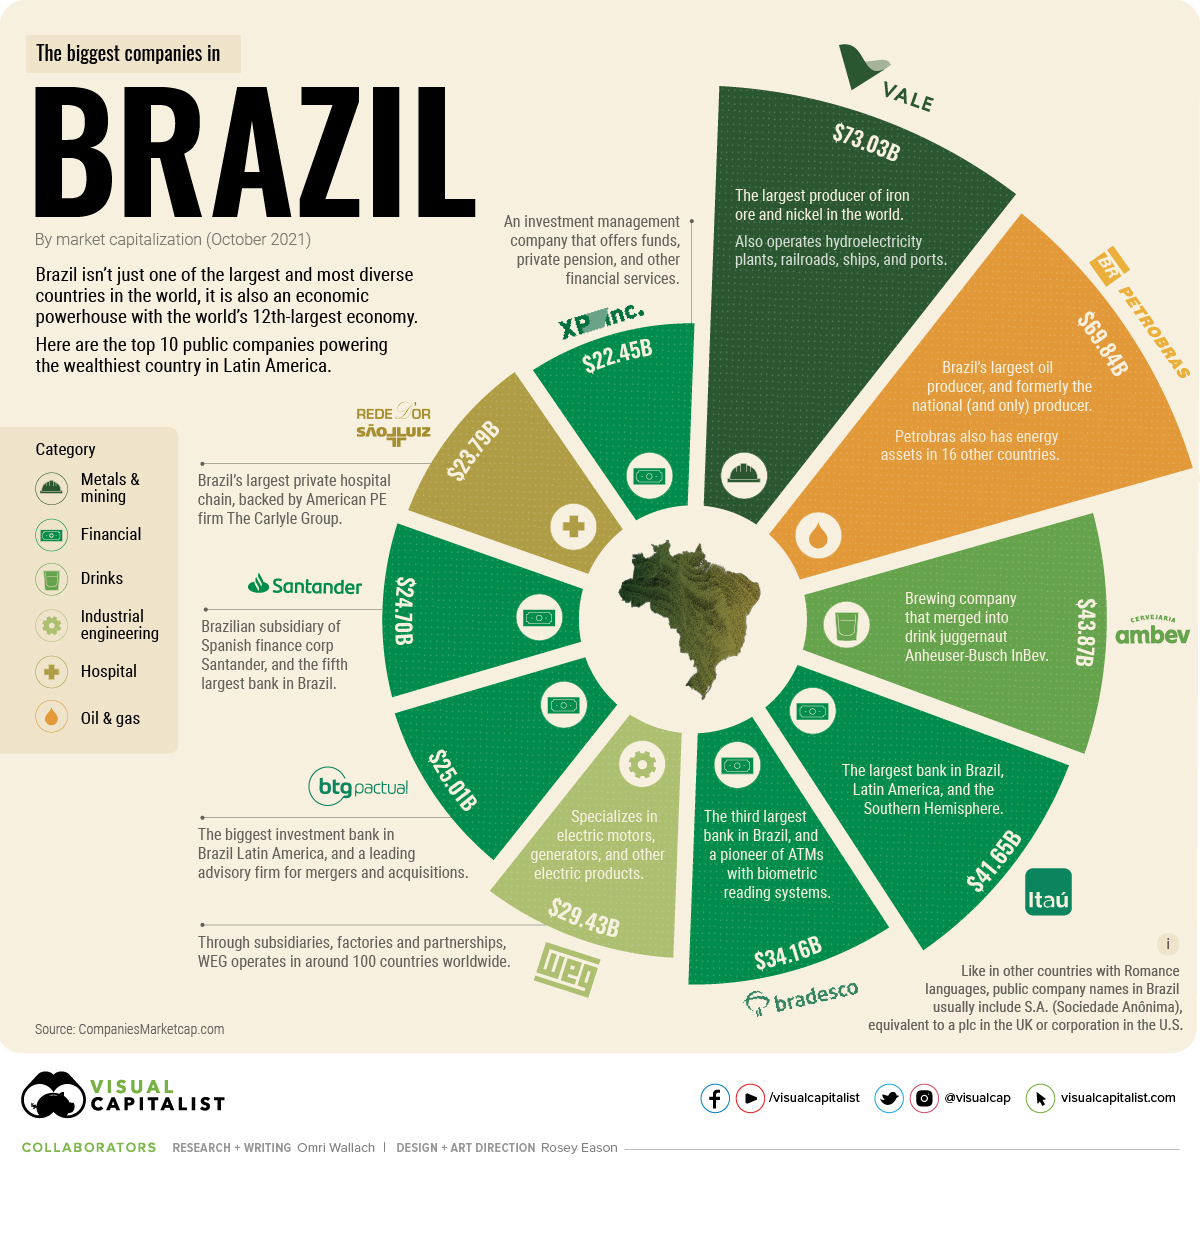
Brazil isn’t just one of the largest and most diverse countries in the world, it is also an economic powerhouse.
With over 213 million people, Brazil is the sixth most populous country on Earth and the largest in Latin America. It’s also the wealthiest on the continent, with the world’s 12th-largest economy.
Once a colony focused on sugar and gold, Brazil rapidly industrialized in the 20th century. Today, it is a top 10 exporter of industrial steel, with the country’s economic strength coming chiefly from natural resources and financials.
Here are Brazil’s biggest public companies by market capitalization in October 2021:
| Top 10 Companies (October 2021) | Category | Market Cap (USD) |
|---|---|---|
| Vale | Metals and Mining | $73.03B |
| Petróleo Brasileiro | Oil and Gas | $69.84B |
| Ambev | Drinks | $43.87B |
| Itaú Unibanco | Financial | $41.65B |
| Banco Bradesco | Financial | $34.16B |
| WEG | Industrial Engineering | $29.43B |
| BTG Pactual | Financial | $25.01B |
| Banco Santander Brasil | Financial | $24.70B |
| Rede D’Or Sao Luiz | Hospital | $23.79B |
| XP Inc. | Financial | $22.45B |
At the top of the ranking is Vale, a metals and mining giant that is the world’s largest producer of iron ore and nickel. Also the operator of infrastructure including hydroelectricity plants, railroads, and ports, It consistently ranks as the most valuable company in Latin America.
Vale and second-ranking company Petróleo Brasileiro, Brazil’s largest oil producer, were former state-owned corporations that became privatized in the 1990s.
Finance in Brazil’s Top 10 Biggest Companies
Other than former monopolies, the top 10 biggest companies in Brazil highlight the power of the banking sector.
Five of the 10 companies with a market cap above $20 billion are in the financial industry.
They include Itaú Unibanco, the largest bank in the Southern Hemisphere, and Banco Santander Brasil, the Brazilian subsidiary of Spanish finance corp.
Another well-known subsidiary is brewing company Ambev, which produces the majority of the country’s liquors and also bottles and distributes PepsiCo products in much of Latin America. Ambev is an important piece of Belgian drink juggernaut Anheuser-Busch InBev, which is one of the world’s largest 100 companies.
Noticeably missing from the top 10 list are companies in the agriculture sector, as Brazil is the world’s largest exporter of coffee, soybeans, beef, and ethanol. Many multinational corporations have Brazilian subsidiaries or partners for supply chain access, which has recently put a spotlight on Amazon deforestation.
What other companies or industries do you associate with Brazil?
Correction: Two companies listed had errors in their market cap calculations and have been updated. All data is as of October 11, 2021.


Economy
Economic Growth Forecasts for G7 and BRICS Countries in 2024
The IMF has released its economic growth forecasts for 2024. How do the G7 and BRICS countries compare?


G7 & BRICS Real GDP Growth Forecasts for 2024
The International Monetary Fund’s (IMF) has released its real gross domestic product (GDP) growth forecasts for 2024, and while global growth is projected to stay steady at 3.2%, various major nations are seeing declining forecasts.
This chart visualizes the 2024 real GDP growth forecasts using data from the IMF’s 2024 World Economic Outlook for G7 and BRICS member nations along with Saudi Arabia, which is still considering an invitation to join the bloc.
Get the Key Insights of the IMF’s World Economic Outlook
Want a visual breakdown of the insights from the IMF’s 2024 World Economic Outlook report?
This visual is part of a special dispatch of the key takeaways exclusively for VC+ members.
Get the full dispatch of charts by signing up to VC+.
Mixed Economic Growth Prospects for Major Nations in 2024
Economic growth projections by the IMF for major nations are mixed, with the majority of G7 and BRICS countries forecasted to have slower growth in 2024 compared to 2023.
Only three BRICS-invited or member countries, Saudi Arabia, the UAE, and South Africa, have higher projected real GDP growth rates in 2024 than last year.
| Group | Country | Real GDP Growth (2023) | Real GDP Growth (2024P) |
|---|---|---|---|
| G7 | 🇺🇸 U.S. | 2.5% | 2.7% |
| G7 | 🇨🇦 Canada | 1.1% | 1.2% |
| G7 | 🇯🇵 Japan | 1.9% | 0.9% |
| G7 | 🇫🇷 France | 0.9% | 0.7% |
| G7 | 🇮🇹 Italy | 0.9% | 0.7% |
| G7 | 🇬🇧 UK | 0.1% | 0.5% |
| G7 | 🇩🇪 Germany | -0.3% | 0.2% |
| BRICS | 🇮🇳 India | 7.8% | 6.8% |
| BRICS | 🇨🇳 China | 5.2% | 4.6% |
| BRICS | 🇦🇪 UAE | 3.4% | 3.5% |
| BRICS | 🇮🇷 Iran | 4.7% | 3.3% |
| BRICS | 🇷🇺 Russia | 3.6% | 3.2% |
| BRICS | 🇪🇬 Egypt | 3.8% | 3.0% |
| BRICS-invited | 🇸🇦 Saudi Arabia | -0.8% | 2.6% |
| BRICS | 🇧🇷 Brazil | 2.9% | 2.2% |
| BRICS | 🇿🇦 South Africa | 0.6% | 0.9% |
| BRICS | 🇪🇹 Ethiopia | 7.2% | 6.2% |
| 🌍 World | 3.2% | 3.2% |
China and India are forecasted to maintain relatively high growth rates in 2024 at 4.6% and 6.8% respectively, but compared to the previous year, China is growing 0.6 percentage points slower while India is an entire percentage point slower.
On the other hand, four G7 nations are set to grow faster than last year, which includes Germany making its comeback from its negative real GDP growth of -0.3% in 2023.
Faster Growth for BRICS than G7 Nations
Despite mostly lower growth forecasts in 2024 compared to 2023, BRICS nations still have a significantly higher average growth forecast at 3.6% compared to the G7 average of 1%.
While the G7 countries’ combined GDP is around $15 trillion greater than the BRICS nations, with continued higher growth rates and the potential to add more members, BRICS looks likely to overtake the G7 in economic size within two decades.
BRICS Expansion Stutters Before October 2024 Summit
BRICS’ recent expansion has stuttered slightly, as Argentina’s newly-elected president Javier Milei declined its invitation and Saudi Arabia clarified that the country is still considering its invitation and has not joined BRICS yet.
Even with these initial growing pains, South Africa’s Foreign Minister Naledi Pandor told reporters in February that 34 different countries have submitted applications to join the growing BRICS bloc.
Any changes to the group are likely to be announced leading up to or at the 2024 BRICS summit which takes place October 22-24 in Kazan, Russia.
Get the Full Analysis of the IMF’s Outlook on VC+
This visual is part of an exclusive special dispatch for VC+ members which breaks down the key takeaways from the IMF’s 2024 World Economic Outlook.
For the full set of charts and analysis, sign up for VC+.

-

 Debt1 week ago
How Debt-to-GDP Ratios Have Changed Since 2000
-

 Markets2 weeks ago
Ranked: The World’s Top Flight Routes, by Revenue
-

 Countries2 weeks ago
Population Projections: The World’s 6 Largest Countries in 2075
-

 Markets2 weeks ago
The Top 10 States by Real GDP Growth in 2023
-

 Demographics2 weeks ago
The Smallest Gender Wage Gaps in OECD Countries
-

 United States2 weeks ago
Where U.S. Inflation Hit the Hardest in March 2024
-

 Green2 weeks ago
Top Countries By Forest Growth Since 2001
-

 United States2 weeks ago
Ranked: The Largest U.S. Corporations by Number of Employees