Mining
Visualizing 50 Years of Global Steel Production
![]() Subscribe to the Elements free mailing list for more like this
Subscribe to the Elements free mailing list for more like this
Visualizing 50 Years of Global Steel Production
This was originally posted on Elements. Sign up to the free mailing list to get beautiful visualizations on natural resource megatrends in your email every week.
From the bronze age to the iron age, metals have defined eras of human history. If our current era had to be defined similarly, it would undoubtedly be known as the steel age.
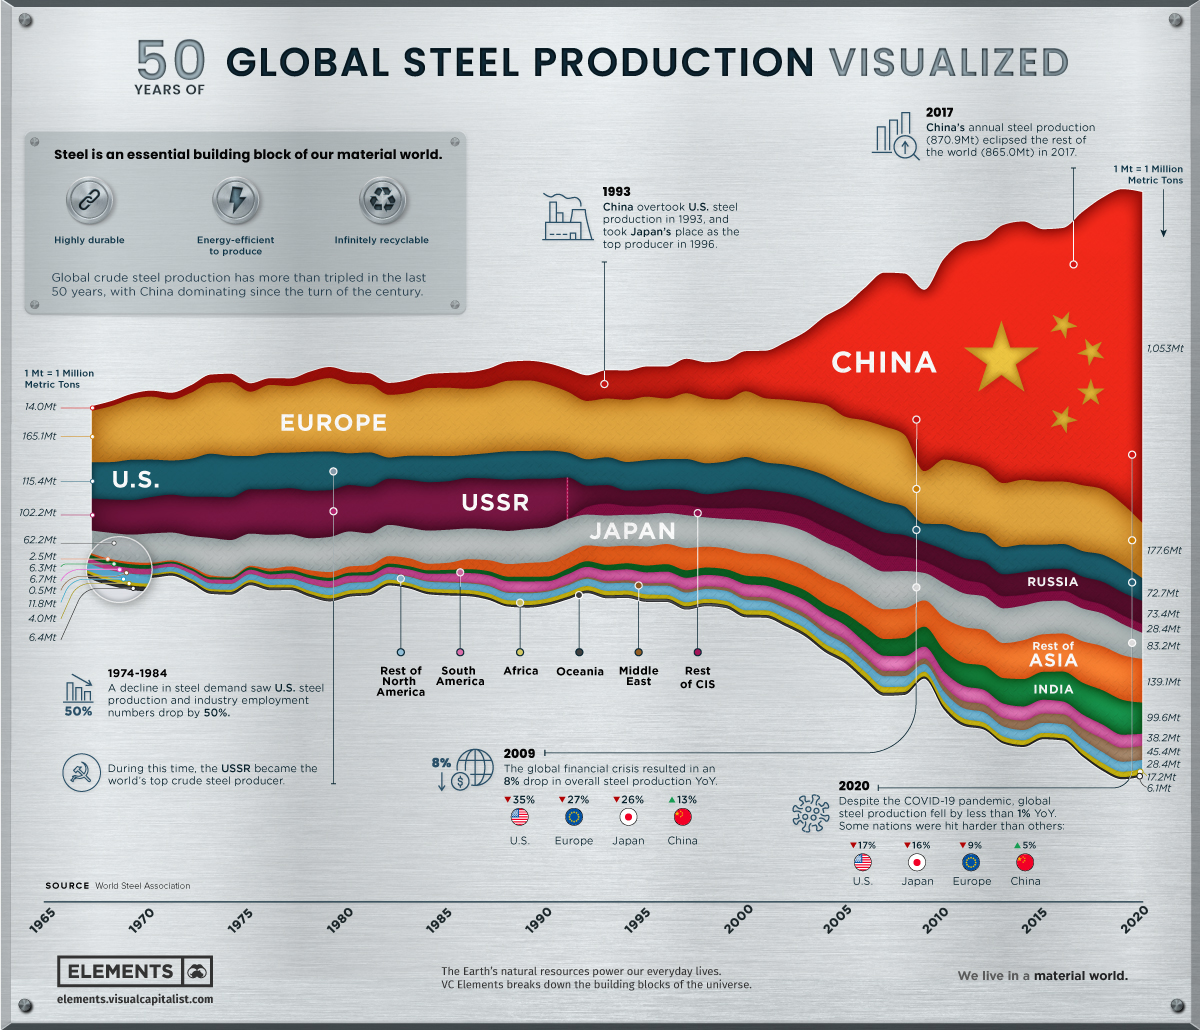
Steel is the foundation of our buildings, vehicles, and industries, with its rates of production and consumption often seen as markers for a nation’s development. Today, it is the world’s most commonly used metal and most recycled material, with 1,864 million metric tons of crude steel produced in 2020.
This infographic uses data from the World Steel Association to visualize 50 years of crude steel production, showcasing our world’s unrelenting creation of this essential material.
The State of Steel Production
Global steel production has more than tripled over the past 50 years, despite nations like the U.S. and Russia scaling down their domestic production and relying more on imports. Meanwhile, China and India have consistently grown their production to become the top two steel producing nations.
Below are the world’s current top crude steel producing nations by 2020 production.
| Rank | Country | Steel Production (2020, Mt) |
|---|---|---|
| #1 | 🇨🇳 China | 1,053.0 |
| #2 | 🇮🇳 India | 99.6 |
| #3 | 🇯🇵 Japan | 83.2 |
| #4 | 🇷🇺 Russia* | 73.4 |
| #5 | 🇺🇸 United States | 72.7 |
| #6 | 🇰🇷 South Korea | 67.1 |
| #7 | 🇹🇷 Turkey | 35.8 |
| #8 | 🇩🇪 Germany | 35.7 |
| #9 | 🇧🇷 Brazil | 31.0 |
| #10 | 🇮🇷 Iran* | 29.0 |
Source: World Steel Association. *Estimates.
Despite its current dominance, China could be preparing to scale back domestic steel production to curb overproduction risks and ensure it can reach carbon neutrality by 2060.
As iron ore and steel prices have skyrocketed in the last year, U.S. demand could soon lessen depending on the Biden administration’s actions. A potential infrastructure bill would bring investment into America’s steel mills to build supply for the future, and any walkbalk on the Trump administration’s 2018 tariffs on imported steel could further soften supply constraints.
Steel’s Secret: Infinite Recyclability
Made up primarily of iron ore, steel is an alloy which also contains less than 2% carbon and 1% manganese and other trace elements. While the defining difference might seem small, steel can be 1,000x stronger than iron.
However, steel’s true strength lies in its infinite recyclability with no loss of quality. No matter the grade or application, steel can always be recycled, with new steel products containing 30% recycled steel on average.
The alloy’s magnetic properties make it easy to recover from waste streams, and nearly 100% of the steel industry’s co-products can be used in other manufacturing or electricity generation.
It’s fitting then that steel makes up essential parts of various sustainable energy technologies:
- The average wind turbine is made of 80% steel on average (140 metric tons).
- Steel is used in the base, pumps, tanks, and heat exchangers of solar power installations.
- Electrical steel is at the heart of the generators and motors of electric and hybrid vehicles.
The Steel Industry’s Future Sustainability
Considering the crucial role steel plays in just about every industry, it’s no wonder that prices are surging to record highs. However, steel producers are thinking about long-term sustainability, and are working to make fossil-fuel-free steel a reality by completely removing coal from the metallurgical process.
While the industry has already cut down the average energy intensity per metric ton produced from 50 gigajoules to 20 gigajoules since the 1960s, steel-producing giants like ArcelorMittal are going further and laying out their plans for carbon-neutral steel production by 2050.
Steel consumption and demand is only set to continue rising as the world’s economy gradually reopens, especially as Rio Tinto’s new development of atomized steel powder could bring about the next evolution in 3D printing.
As the industry continues to innovate in both sustainability and usability, steel will continue to be a vital material across industries that we can infinitely recycle and rely on.


Lithium
Ranked: The Top 10 EV Battery Manufacturers in 2023
Asia dominates this ranking of the world’s largest EV battery manufacturers in 2023.


The Top 10 EV Battery Manufacturers in 2023
This was originally posted on our Voronoi app. Download the app for free on iOS or Android and discover incredible data-driven charts from a variety of trusted sources.
Despite efforts from the U.S. and EU to secure local domestic supply, all major EV battery manufacturers remain based in Asia.
In this graphic we rank the top 10 EV battery manufacturers by total battery deployment (measured in megawatt-hours) in 2023. The data is from EV Volumes.
Chinese Dominance
Contemporary Amperex Technology Co. Limited (CATL) has swiftly risen in less than a decade to claim the title of the largest global battery group.
The Chinese company now has a 34% share of the market and supplies batteries to a range of made-in-China vehicles, including the Tesla Model Y, SAIC’s MG4/Mulan, and various Li Auto models.
| Company | Country | 2023 Production (megawatt-hour) | Share of Total Production |
|---|---|---|---|
| CATL | 🇨🇳 China | 242,700 | 34% |
| BYD | 🇨🇳 China | 115,917 | 16% |
| LG Energy Solution | 🇰🇷 Korea | 108,487 | 15% |
| Panasonic | 🇯🇵 Japan | 56,560 | 8% |
| SK On | 🇰🇷 Korea | 40,711 | 6% |
| Samsung SDI | 🇰🇷 Korea | 35,703 | 5% |
| CALB | 🇨🇳 China | 23,493 | 3% |
| Farasis Energy | 🇨🇳 China | 16,527 | 2% |
| Envision AESC | 🇨🇳 China | 8,342 | 1% |
| Sunwoda | 🇨🇳 China | 6,979 | 1% |
| Other | - | 56,040 | 8% |
In 2023, BYD surpassed LG Energy Solution to claim second place. This was driven by demand from its own models and growth in third-party deals, including providing batteries for the made-in-Germany Tesla Model Y, Toyota bZ3, Changan UNI-V, Venucia V-Online, as well as several Haval and FAW models.
The top three battery makers (CATL, BYD, LG) collectively account for two-thirds (66%) of total battery deployment.
Once a leader in the EV battery business, Panasonic now holds the fourth position with an 8% market share, down from 9% last year. With its main client, Tesla, now sourcing batteries from multiple suppliers, the Japanese battery maker seems to be losing its competitive edge in the industry.
Overall, the global EV battery market size is projected to grow from $49 billion in 2022 to $98 billion by 2029, according to Fortune Business Insights.

-

 Debt1 week ago
How Debt-to-GDP Ratios Have Changed Since 2000
-

 Markets2 weeks ago
Ranked: The World’s Top Flight Routes, by Revenue
-

 Countries2 weeks ago
Population Projections: The World’s 6 Largest Countries in 2075
-

 Markets2 weeks ago
The Top 10 States by Real GDP Growth in 2023
-

 Demographics2 weeks ago
The Smallest Gender Wage Gaps in OECD Countries
-

 United States2 weeks ago
Where U.S. Inflation Hit the Hardest in March 2024
-

 Green2 weeks ago
Top Countries By Forest Growth Since 2001
-

 United States2 weeks ago
Ranked: The Largest U.S. Corporations by Number of Employees