Debt
Visualizing the Snowball of Government Debt
Visualizing the Snowball of Government Debt in 2021
As we approach the second half of 2021, many countries around the world are beginning to relax their COVID-19 restrictions.
And while this signals a return to normalcy for much of the global economy, there’s one subject that’s likely to remain controversial: government debt.
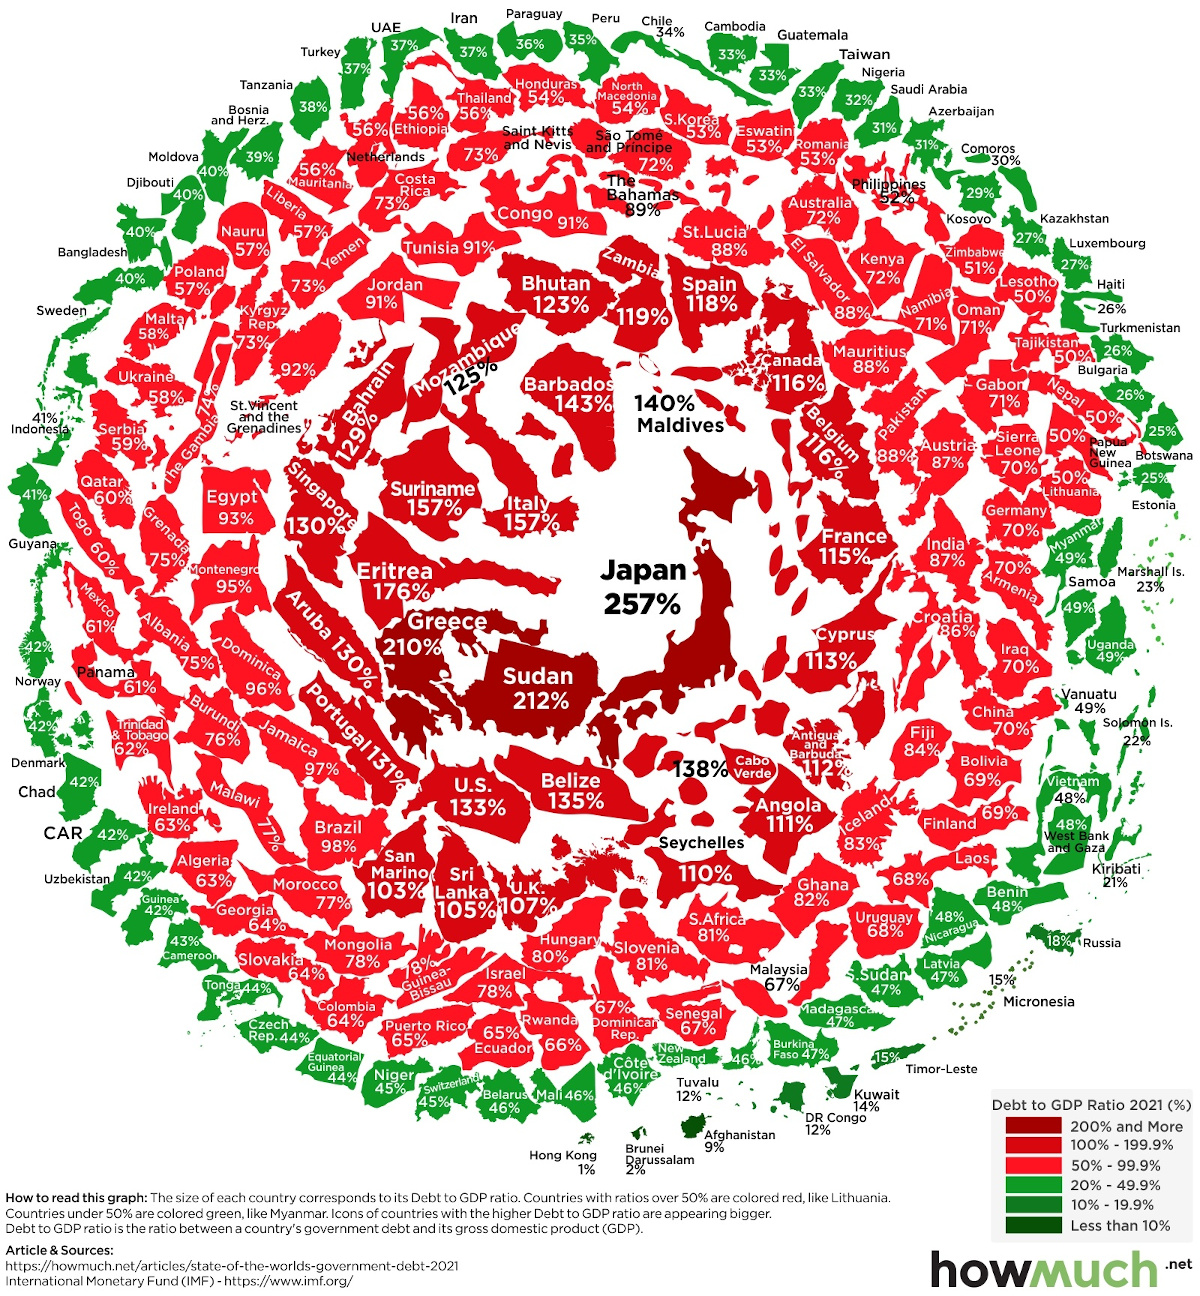
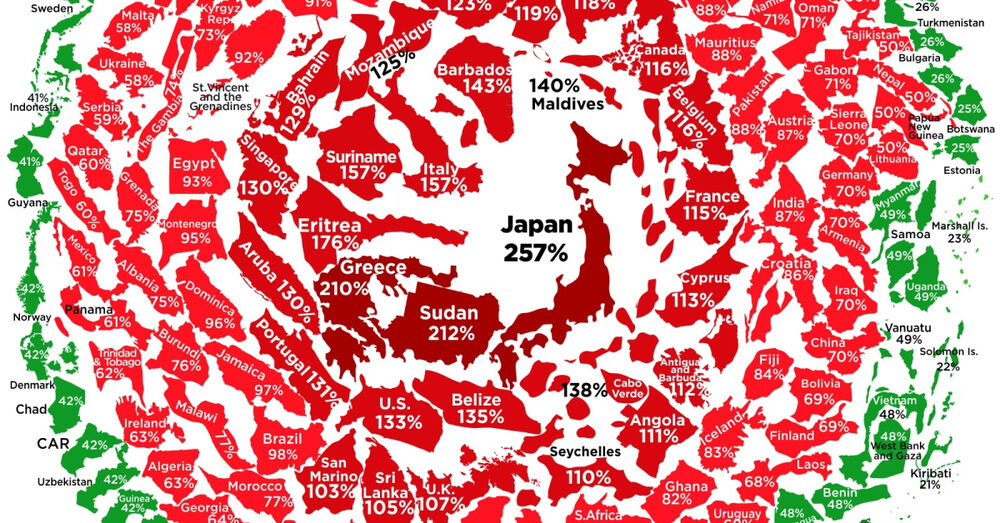
To see how each country is faring in the aftermath of an unprecedented global borrowing spree, this graphic from HowMuch.net visualizes debt-to-GDP ratios using April 2021 data from the International Monetary Fund (IMF).
Ranking the Top 10 in Government Debt
Government debt is often analyzed through the debt-to-GDP metric because it contextualizes an otherwise massive number.
Take for example the U.S. national debt, which currently sits at over $27 trillion. In isolation this figure sounds daunting, but when expressed as a % of U.S. GDP, it works out to a more relatable 133%. This format also allows us to make a better comparison between countries, especially when their economies differ in size.
With that being said, here are the top 10 countries in terms of debt-to-GDP. For further context, we’ve included their 2019 and 2020 values as well.
| Rank (2021) | Country | Debt-to-GDP (2019) | Debt-to-GDP (2020) | Debt-to-GDP (April 2021) |
|---|---|---|---|---|
| #1 | 🇯🇵 Japan | 235% | 256% | 257% |
| #2 | 🇸🇩 Sudan | 200% | 262% | 212% |
| #3 | 🇬🇷 Greece | 185% | 213% | 210% |
| #4 | 🇪🇷 Eritrea | 189% | 185% | 176% |
| #5 | 🇸🇷 Suriname | 93% | 166% | 157% |
| #6 | 🇮🇹 Italy | 135% | 156% | 157% |
| #7 | 🇧🇧 Barbados | 127% | 149% | 143% |
| #8 | 🇲🇻 Maldives | 78% | 143% | 140% |
| #9 | 🇨🇻 Cape Verde | 125% | 139% | 138% |
| #10 | 🇧🇿 Belize | 98% | 127% | 135% |
Source: IMF
Japan tops the list with a ratio of 257%, though this isn’t really a surprise—the country’s debt-to-GDP ratio first surpassed 100% in the 1990s, and in 2010, it became the first advanced economy to reach 200%.
Such significant debt burdens are the result of non-traditional monetary policies, many of which were first implemented by Japan, then adopted by others. In the late 1990s, for instance, the Bank of Japan (BoJ) set interest rates at 0% to counter deflation and promote economic growth.
This low cost of borrowing enables businesses and governments to accumulate debt much more freely, and has seen widespread use among other developed nations post-2008.
What are the Risks?
Given that a majority of countries in this visual are red (meaning their debt-to-GDP ratios are over 50%), it’s safe to say that government borrowing is common practice.
But are large government debts a cause for concern?
Some believe that excessive borrowing will lead to higher interest costs in the long run, which could detract from economic growth and public sector investment. This theory is unlikely to become a reality anytime soon, however.
A recent report by RBC Wealth Management reported that the cost of servicing U.S. federal debt actually decreased in 2020, thanks to the low borrowing costs mentioned previously.
Perhaps a more prescient question would be: how long can the world’s central banks keep interest rates at near-zero levels?


Debt
How Debt-to-GDP Ratios Have Changed Since 2000
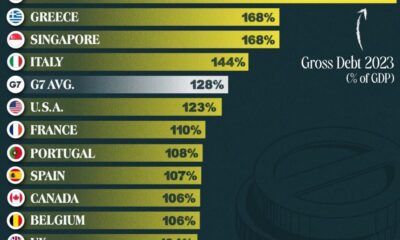
See how much the debt-to-GDP ratios of advanced economies have grown (or shrank) since the year 2000.


How Debt-to-GDP Ratios Have Changed Since 2000
This was originally posted on our Voronoi app. Download the app for free on Apple or Android and discover incredible data-driven charts from a variety of trusted sources.
Government debt levels have grown in most parts of the world since the 2008 financial crisis, and even more so after the COVID-19 pandemic.
To gain perspective on this long-term trend, we’ve visualized the debt-to-GDP ratios of advanced economies, as of 2000 and 2024 (estimated). All figures were sourced from the IMF’s World Economic Outlook.
Data and Highlights
The data we used to create this graphic is listed in the table below. “Government gross debt” consists of all liabilities that require payment(s) of interest and/or principal in the future.
| Country | 2000 (%) | 2024 (%) | Change (pp) |
|---|---|---|---|
| 🇯🇵 Japan | 135.6 | 251.9 | +116.3 |
| 🇸🇬 Singapore | 82.3 | 168.3 | +86.0 |
| 🇺🇸 United States | 55.6 | 126.9 | +71.3 |
| 🇬🇧 United Kingdom | 36.6 | 105.9 | +69.3 |
| 🇬🇷 Greece | 104.9 | 160.2 | +55.3 |
| 🇫🇷 France | 58.9 | 110.5 | +51.6 |
| 🇵🇹 Portugal | 54.2 | 104.0 | +49.8 |
| 🇪🇸 Spain | 57.8 | 104.7 | +46.9 |
| 🇸🇮 Slovenia | 25.9 | 66.5 | +40.6 |
| 🇫🇮 Finland | 42.4 | 76.5 | +34.1 |
| 🇭🇷 Croatia | 35.4 | 61.8 | +26.4 |
| 🇨🇦 Canada | 80.4 | 103.3 | +22.9 |
| 🇨🇾 Cyprus | 56.0 | 70.9 | +14.9 |
| 🇦🇹 Austria | 65.7 | 74.0 | +8.3 |
| 🇸🇰 Slovak Republic | 50.5 | 56.5 | +6.0 |
| 🇩🇪 Germany | 59.3 | 64.0 | +4.7 |
| 🇧🇪 Belgium | 109.6 | 106.8 | -2.8 |
| 🇮🇱 Israel | 77.4 | 56.8 | -20.6 |
| 🇮🇸 Iceland | 75.8 | 54.6 | -21.2 |
The debt-to-GDP ratio indicates how much a country owes compared to the size of its economy, reflecting its ability to manage and repay debts. Percentage point (pp) changes shown above indicate the increase or decrease of these ratios.
Countries with the Biggest Increases
Japan (+116 pp), Singapore (+86 pp), and the U.S. (+71 pp) have grown their debt as a percentage of GDP the most since the year 2000.
All three of these countries have stable, well-developed economies, so it’s unlikely that any of them will default on their growing debts. With that said, higher government debt leads to increased interest payments, which in turn can diminish available funds for future government budgets.
This is a rising issue in the U.S., where annual interest payments on the national debt have surpassed $1 trillion for the first time ever.
Only 3 Countries Saw Declines
Among this list of advanced economies, Belgium (-2.8 pp), Iceland (-21.2 pp), and Israel (-20.6 pp) were the only countries that decreased their debt-to-GDP ratio since the year 2000.
According to Fitch Ratings, Iceland’s debt ratio has decreased due to strong GDP growth and the use of its cash deposits to pay down upcoming maturities.
See More Debt Graphics from Visual Capitalist
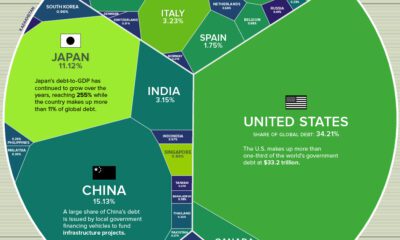
Curious to see which countries have the most government debt in dollars? Check out this graphic that breaks down $97 trillion in debt as of 2023.

-

 Science1 week ago
Visualizing the Average Lifespans of Mammals
-

 Demographics2 weeks ago
The Smallest Gender Wage Gaps in OECD Countries
-

 United States2 weeks ago
Where U.S. Inflation Hit the Hardest in March 2024
-

 Green2 weeks ago
Top Countries By Forest Growth Since 2001
-

 United States2 weeks ago
Ranked: The Largest U.S. Corporations by Number of Employees
-

 Maps2 weeks ago
The Largest Earthquakes in the New York Area (1970-2024)
-

 Green2 weeks ago
Ranked: The Countries With the Most Air Pollution in 2023
-

 Green2 weeks ago
Ranking the Top 15 Countries by Carbon Tax Revenue