Debt
Ranked: Government Debt by Country, in Advanced Economies
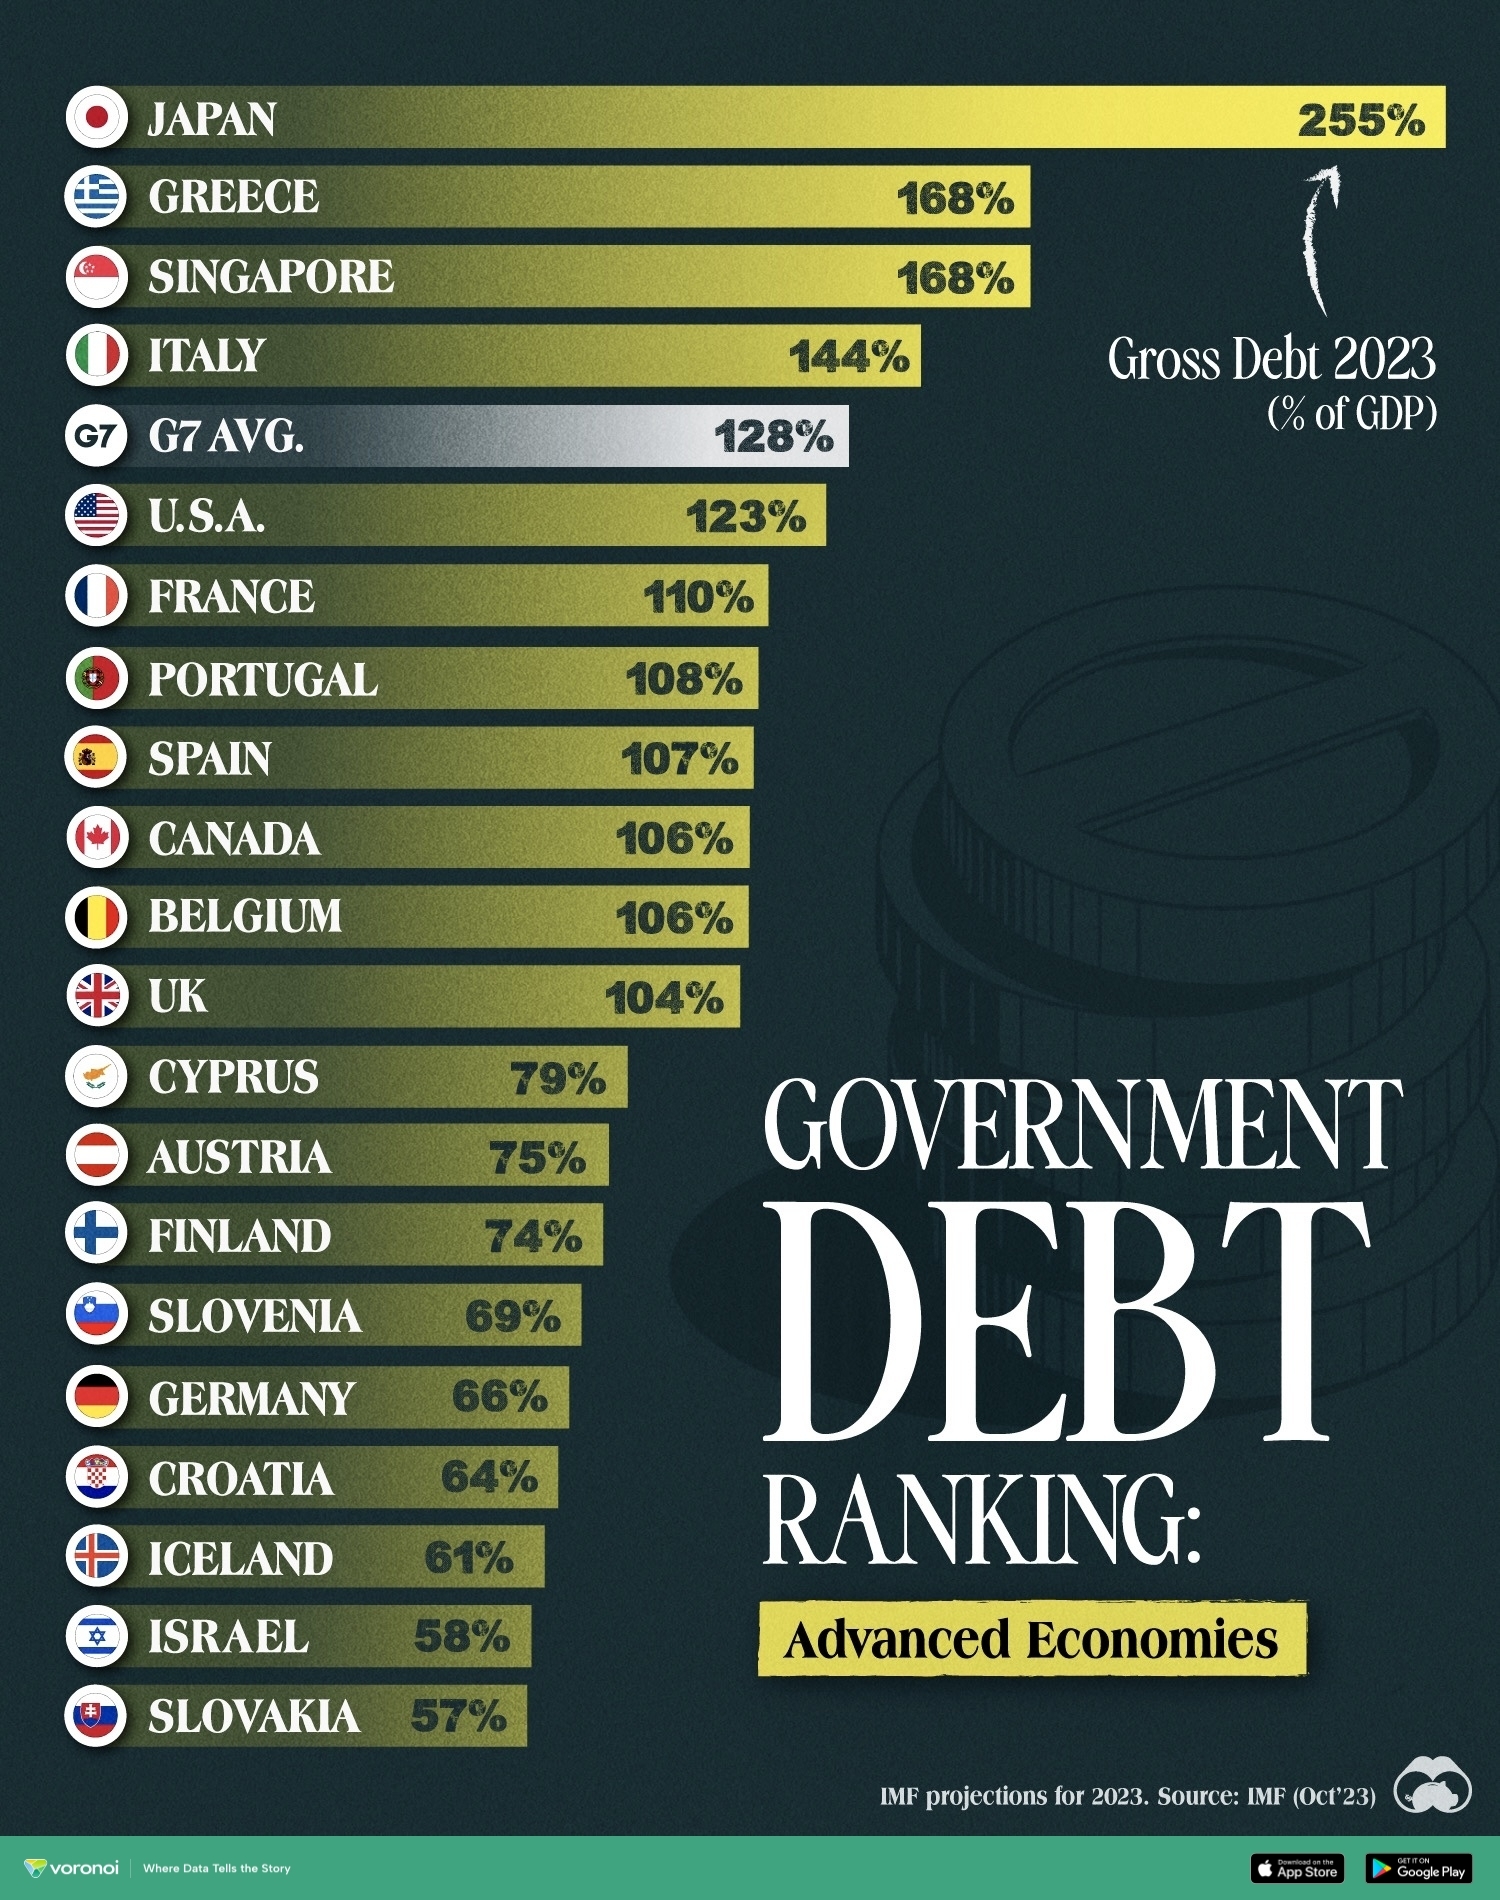
Government Debt by Country, in Advanced Economies
The amount of debt a government holds is a crucial indicator for the sustainability of its finances.
If the debt is excessively high—especially as a percentage of gross domestic product (GDP)—it may signal challenges in meeting financial obligations, potentially leading to economic instability.
This graphic ranks government debt by country for advanced economies, using their gross debt-to-GDP ratio. The ranking is based on IMF Outlook from October 2023.
Debt-to-GDP Ratio for Advanced Economies in 2023
From 20 economies analyzed, 11 have a debt-to-GDP ratio of over 100%.
At the top is Japan, whose national debt has remained above 100% of its GDP for two decades, reaching 255% in 2023.
| Economy by Gross Debt | % of GDP (2023) |
|---|---|
| 🇯🇵 Japan | 255% |
| 🇬🇷 Greece | 168% |
| 🇸🇬 Singapore | 168% |
| 🇮🇹 Italy | 144% |
| 🇺🇸 United States* | 123% |
| 🇫🇷 France | 110% |
| 🇵🇹 Portugal | 108% |
| 🇪🇸 Spain | 107% |
| 🇨🇦 Canada* | 106% |
| 🇧🇪 Belgium | 106% |
| 🇬🇧 United Kingdom | 104% |
| 🇨🇾 Cyprus | 79% |
| 🇦🇹 Austria | 75% |
| 🇫🇮 Finland | 74% |
| 🇸🇮 Slovenia | 69% |
| 🇩🇪 Germany | 66% |
| 🇭🇷 Croatia | 64% |
| 🇮🇸 Iceland | 61% |
| 🇮🇱 Israel | 58% |
| 🇸🇰 Slovak Republic | 57% |
| 🌎 G7 Average | 128% |
*For the U.S. and Canada, gross debt levels were adjusted to exclude unfunded pension liabilities of government employees’ defined-benefit pension plans.
Japan has indeed been borrowing heavily, though mainly in the form of intergovernmental holdings with interest rates around 0%. However, with the country experiencing a rapidly aging population, an increasing burden of social security expenses could lead to an even larger fiscal deficit in the future.
The U.S. national debt hit $32 trillion in 2023, making up 123% of the country’s GDP. To put it in perspective, two decades ago, the U.S. debt-to-GDP ratio was less than half of what it is today. Nonetheless, it remains below the G7 average of 128%.
Germany’s ratio of 66% is the lowest in the G7, though it climbed following the COVID-19 pandemic. All EU member states attempt to keep their ratios below 60% for stability. Otherwise, when debt grows beyond what countries can pay, emergency bailouts and defaults lead to economies crashing, as seen in the European debt crisis from 2009 to 2014.
However, a high gross debt-to-GDP ratio (over 100%) is not always a cause for concern. Net ratios that take intergovernmental holdings into account can indicate exposure to debt better in the short-term, as does comparing liabilities and assets. The question is, where are debt ratios heading in the future?


Debt
How Debt-to-GDP Ratios Have Changed Since 2000
See how much the debt-to-GDP ratios of advanced economies have grown (or shrank) since the year 2000.


How Debt-to-GDP Ratios Have Changed Since 2000
This was originally posted on our Voronoi app. Download the app for free on Apple or Android and discover incredible data-driven charts from a variety of trusted sources.
Government debt levels have grown in most parts of the world since the 2008 financial crisis, and even more so after the COVID-19 pandemic.
To gain perspective on this long-term trend, we’ve visualized the debt-to-GDP ratios of advanced economies, as of 2000 and 2024 (estimated). All figures were sourced from the IMF’s World Economic Outlook.
Data and Highlights
The data we used to create this graphic is listed in the table below. “Government gross debt” consists of all liabilities that require payment(s) of interest and/or principal in the future.
| Country | 2000 (%) | 2024 (%) | Change (pp) |
|---|---|---|---|
| 🇯🇵 Japan | 135.6 | 251.9 | +116.3 |
| 🇸🇬 Singapore | 82.3 | 168.3 | +86.0 |
| 🇺🇸 United States | 55.6 | 126.9 | +71.3 |
| 🇬🇧 United Kingdom | 36.6 | 105.9 | +69.3 |
| 🇬🇷 Greece | 104.9 | 160.2 | +55.3 |
| 🇫🇷 France | 58.9 | 110.5 | +51.6 |
| 🇵🇹 Portugal | 54.2 | 104.0 | +49.8 |
| 🇪🇸 Spain | 57.8 | 104.7 | +46.9 |
| 🇸🇮 Slovenia | 25.9 | 66.5 | +40.6 |
| 🇫🇮 Finland | 42.4 | 76.5 | +34.1 |
| 🇭🇷 Croatia | 35.4 | 61.8 | +26.4 |
| 🇨🇦 Canada | 80.4 | 103.3 | +22.9 |
| 🇨🇾 Cyprus | 56.0 | 70.9 | +14.9 |
| 🇦🇹 Austria | 65.7 | 74.0 | +8.3 |
| 🇸🇰 Slovak Republic | 50.5 | 56.5 | +6.0 |
| 🇩🇪 Germany | 59.3 | 64.0 | +4.7 |
| 🇧🇪 Belgium | 109.6 | 106.8 | -2.8 |
| 🇮🇱 Israel | 77.4 | 56.8 | -20.6 |
| 🇮🇸 Iceland | 75.8 | 54.6 | -21.2 |
The debt-to-GDP ratio indicates how much a country owes compared to the size of its economy, reflecting its ability to manage and repay debts. Percentage point (pp) changes shown above indicate the increase or decrease of these ratios.
Countries with the Biggest Increases
Japan (+116 pp), Singapore (+86 pp), and the U.S. (+71 pp) have grown their debt as a percentage of GDP the most since the year 2000.
All three of these countries have stable, well-developed economies, so it’s unlikely that any of them will default on their growing debts. With that said, higher government debt leads to increased interest payments, which in turn can diminish available funds for future government budgets.
This is a rising issue in the U.S., where annual interest payments on the national debt have surpassed $1 trillion for the first time ever.
Only 3 Countries Saw Declines
Among this list of advanced economies, Belgium (-2.8 pp), Iceland (-21.2 pp), and Israel (-20.6 pp) were the only countries that decreased their debt-to-GDP ratio since the year 2000.
According to Fitch Ratings, Iceland’s debt ratio has decreased due to strong GDP growth and the use of its cash deposits to pay down upcoming maturities.
See More Debt Graphics from Visual Capitalist
Curious to see which countries have the most government debt in dollars? Check out this graphic that breaks down $97 trillion in debt as of 2023.

-

 Debt1 week ago
How Debt-to-GDP Ratios Have Changed Since 2000
-

 Countries2 weeks ago
Population Projections: The World’s 6 Largest Countries in 2075
-

 Markets2 weeks ago
The Top 10 States by Real GDP Growth in 2023
-

 Demographics2 weeks ago
The Smallest Gender Wage Gaps in OECD Countries
-

 United States2 weeks ago
Where U.S. Inflation Hit the Hardest in March 2024
-

 Green2 weeks ago
Top Countries By Forest Growth Since 2001
-

 United States2 weeks ago
Ranked: The Largest U.S. Corporations by Number of Employees
-

 Maps2 weeks ago
The Largest Earthquakes in the New York Area (1970-2024)