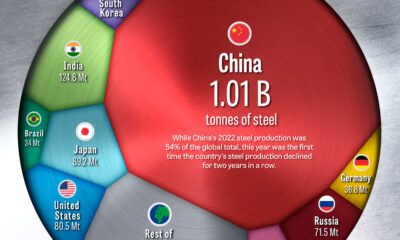

China has dominated global steel production the past few decades, but how did the country get here, and is its production growth over?
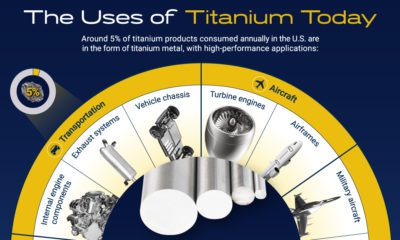

This infographic explores titanium's growth markets and potential for mainstream application.
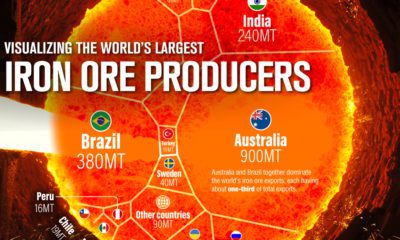

Iron ore made up 93% of the 2.7 billion tonnes of metals mined in 2021. This infographic lists the world’s largest iron ore producers.
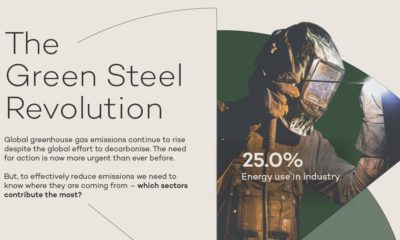

How will high emission industries respond to climate change? We highlight industrial emissions and hydrogen's role in green steel production.
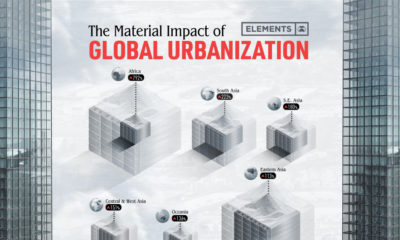

The world’s material consumption is expected to grow from 41 billion tonnes in 2010 to about 89 billion tonnes by 2050. This graphic shows the impact...
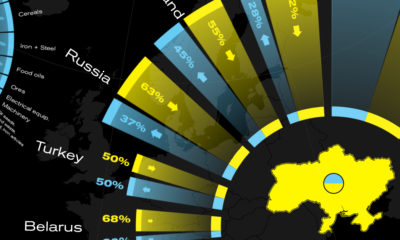

This graphic visualizes Ukraine's top international trading partners and the country's most exported and imported products in 2020.
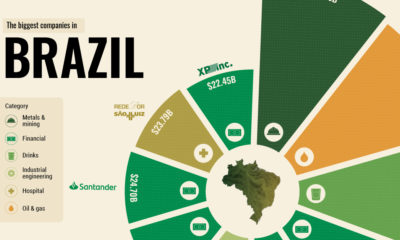

What drives some of the world’s emerging economies? From natural resources to giant banks, here are the top 10 biggest companies in Brazil.
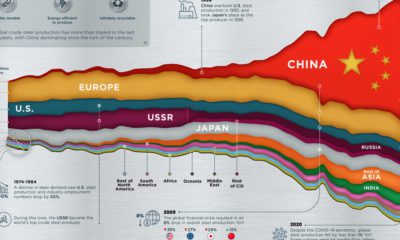

Global steel production has tripled over the past 50 years, with China's steel production eclipsing the rest of the world.


Zinc's widespread uses in the modern economy make it essential for urbanization and economic development. Learn more about the uses of zinc in this infographic.
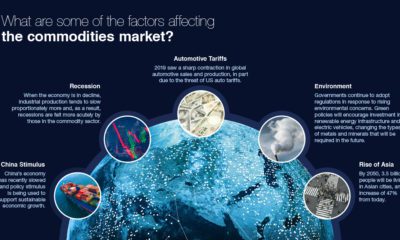

For 50 years, the CRU Group has tracked the commodities that drive the modern world, bringing macroeconomic insights to investors for accurate pricing.


