Mining
All the Metals We Mined in 2021: Visualized
![]() Subscribe to the Elements free mailing list for more like this
Subscribe to the Elements free mailing list for more like this
View the full-size infographic
All the Metals We Mined in 2021
This was originally posted on Elements. Sign up to the free mailing list to get beautiful visualizations on natural resource megatrends in your email every week.
“If you can’t grow it, you have to mine it” is a famous saying that encapsulates the importance of minerals and metals in the modern world.
From every building we enter to every device we use, virtually everything around us contains some amount of metal.
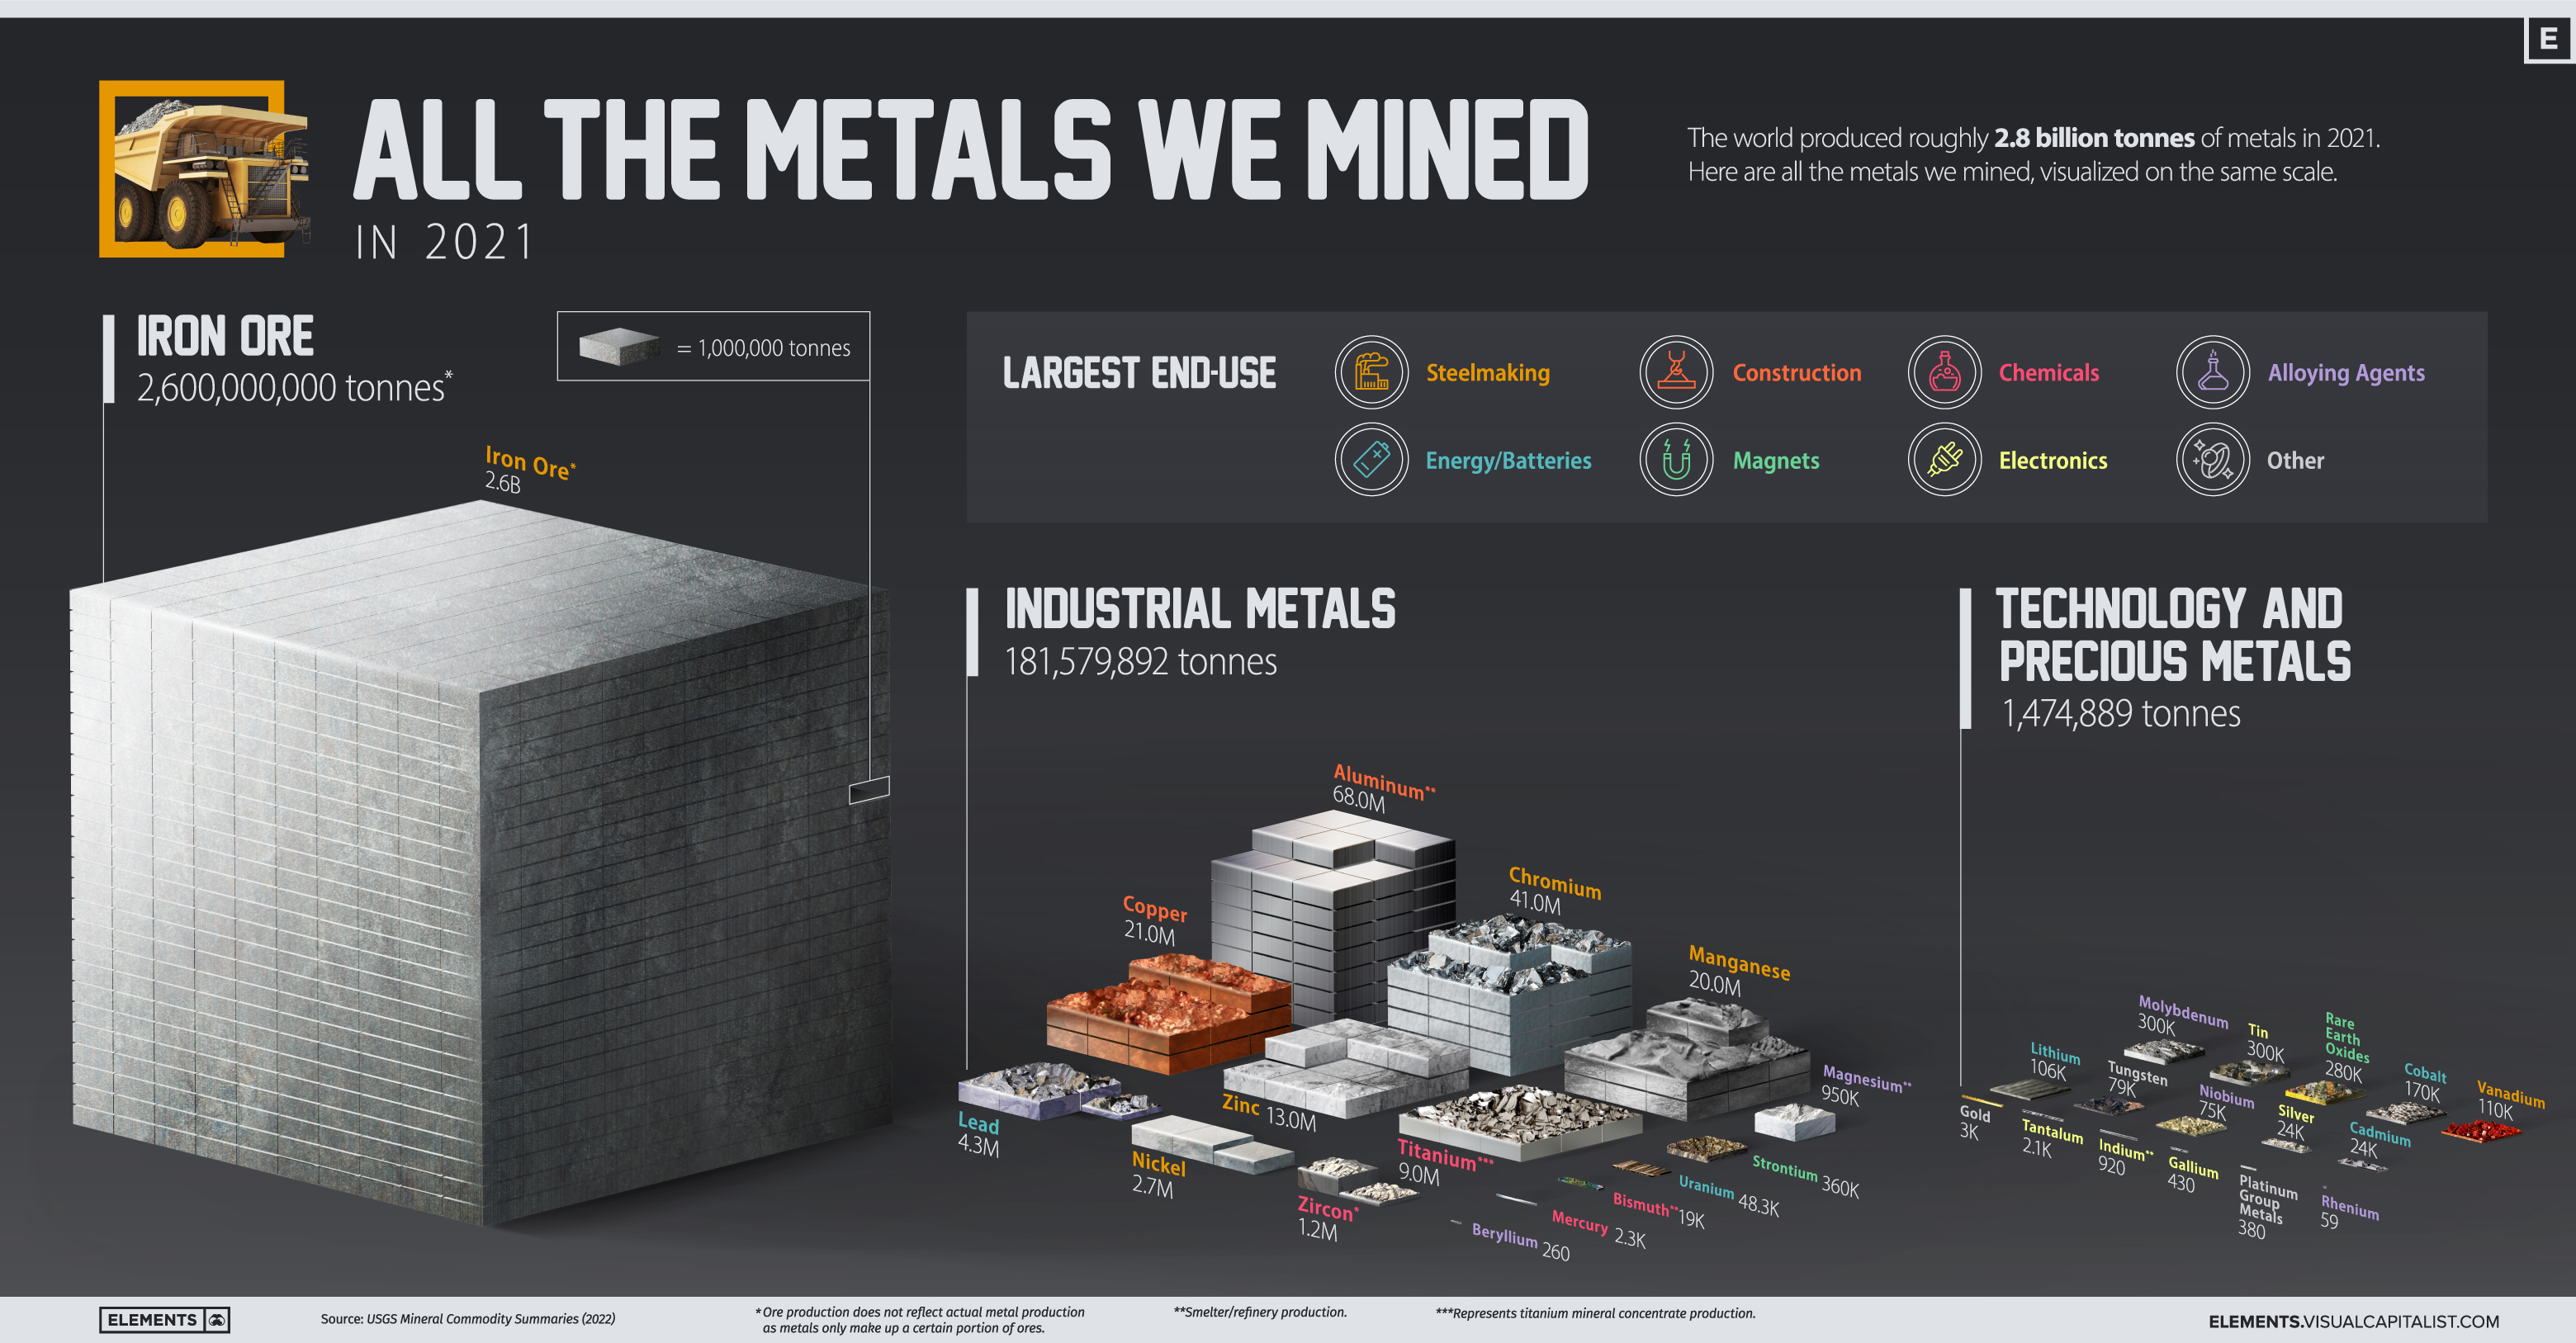
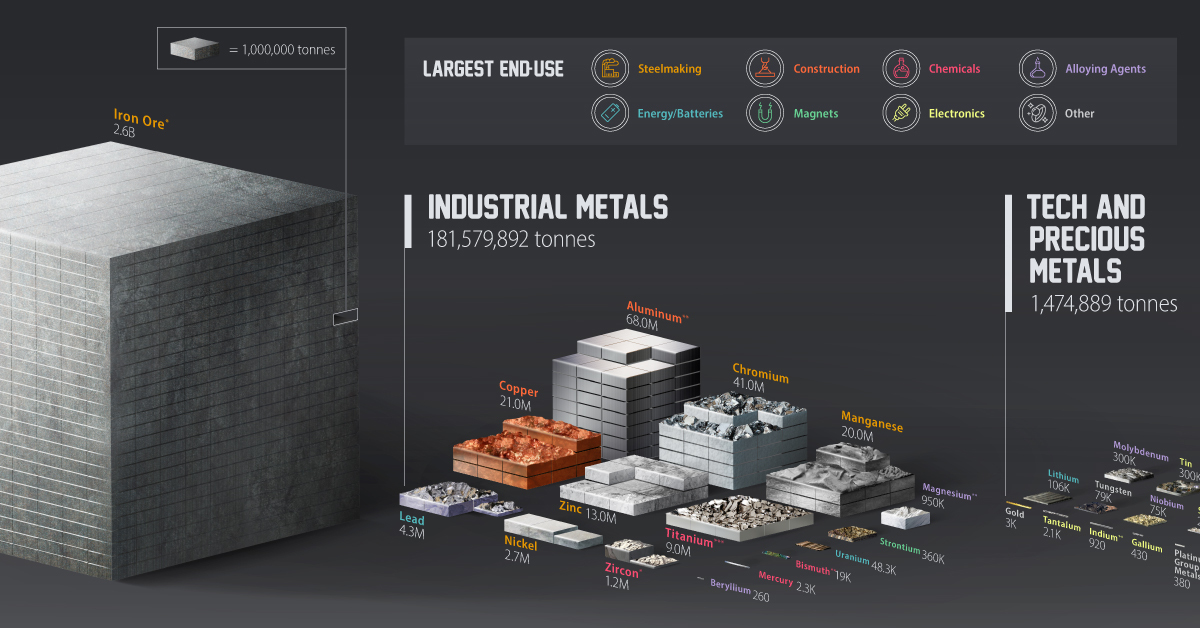
The above infographic visualizes all 2.8 billion tonnes of metals mined in 2021 and highlights each metal’s largest end-use using data from the United States Geological Survey (USGS).
Why Do We Mine So Much Iron Ore?
Iron ore accounted for 93% of the metals mined in 2021, with 2.6 billion tonnes extracted from the ground. It’s important to note that this is ore production, which is typically higher than metal production since metals are extracted and refined from ores. For example, the iron metal content of this ore is estimated at 1.6 billion tonnes.
| Metal/Ore | 2021 Mine Production (tonnes) | % of Total |
|---|---|---|
| Iron ore | 2,600,000,000 | 93.4% |
| Industrial metals | 181,579,892 | 6.5% |
| Technology and precious metals | 1,474,889 | 0.05% |
| Total | 2,783,054,781 | 100.0% |
With 98% of it converted into pig iron to make steel, iron ore is ubiquitous in our lives. Steel made from iron ore is used in construction, transportation, and household appliances, and it’s likely that you encounter something made out of it every day, especially if you live in a city.
Due to its key role in building infrastructure, iron ore is one of the most important materials supporting urbanization and economic growth.
Industrial Metals
Industrial metals are largely used in steelmaking, construction, chemical manufacturing, and as alloying agents. In 2021, the world mined over 181 million tonnes of these metals.
| Industrial Metals | 2021 Mine Production (tonnes) | % of Total |
|---|---|---|
| Aluminum* | 68,000,000 | 37.4% |
| Chromium | 41,000,000 | 22.6% |
| Copper | 21,000,000 | 11.6% |
| Manganese | 20,000,000 | 11.0% |
| Zinc | 13,000,000 | 7.2% |
| Titanium (mineral concentrates) | 9,000,000 | 5.0% |
| Lead | 4,300,000 | 2.4% |
| Nickel | 2,700,000 | 1.5% |
| Zirconium Minerals (Zircon) | 1,200,000 | 0.7% |
| Magnesium* | 950,000 | 0.5% |
| Strontium | 360,000 | 0.2% |
| Uranium | 48,332 | 0.03% |
| Bismuth* | 19,000 | 0.01% |
| Mercury | 2,300 | 0.001% |
| Beryllium | 260 | 0.0001% |
| Total | 181,579,892 | 100.0% |
*Represents refinery/smelter production.
Aluminum accounted for nearly 40% of industrial metal production in 2021. China was by far the largest aluminum producer, making up more than half of global production. The construction industry uses roughly 25% of annually produced aluminum, with 23% going into transportation.
Chromium is a lesser-known metal with a key role in making stainless steel stainless. In fact, stainless steel is usually composed of 10% to 30% of chromium, enhancing its strength and corrosion resistance.
Copper, manganese, and zinc round out the top five industrial metals mined in 2021, each with its own unique properties and roles in the economy.
Technology and Precious Metals
Technology metals include those that are commonly used in technology and devices. Compared to industrial metals, these are usually mined on a smaller scale and could see faster consumption growth as the world adopts new technologies.
| Technology and Precious Metals | 2021 Mine Production (tonnes) | % of Total |
|---|---|---|
| Tin | 300,000 | 20.3% |
| Molybdenum | 300,000 | 20.3% |
| Rare Earth Oxides | 280,000 | 19.0% |
| Cobalt | 170,000 | 11.5% |
| Vanadium | 110,000 | 7.5% |
| Lithium | 106,000 | 7.2% |
| Tungsten | 79,000 | 5.4% |
| Niobium | 75,000 | 5.1% |
| Silver | 24,000 | 1.6% |
| Cadmium | 24,000 | 1.6% |
| Gold | 3,000 | 0.2% |
| Tantalum | 2,100 | 0.1% |
| Indium* | 920 | 0.1% |
| Gallium | 430 | 0.03% |
| Platinum Group Metals | 380 | 0.03% |
| Rhenium | 59 | 0.004% |
| Total | 1,474,889 | 100.0% |
*Represents refinery/smelter production.
The major use of rhenium, one of the rarest metals in terms of production, is in superalloys that are critical for engine turbine blades in aircraft and gas turbine engines. The petroleum industry uses it in rhenium-platinum catalysts to produce high-octane gasoline for vehicles.
In terms of growth, clean energy technology metals stand out. For example, lithium production has more than doubled since 2016 and is set to ride the boom in EV battery manufacturing. Over the same period, global rare earth production more than doubled, driven by the rising demand for magnets.
Indium is another interesting metal on this list. Most of it is used to make indium tin oxide, an important component of touchscreens, TV screens, and solar panels.
The Metal Mining Megatrend
The world’s material consumption has grown significantly over the last few decades, with growing economies and cities demanding more resources.
Global production of both iron ore and aluminum has more than tripled relative to the mid-1990s. Other metals, including copper and steel, have also seen significant consumption growth.
Today, economies are not only growing and urbanizing but also adopting mineral-intensive clean energy technologies, pointing towards further increases in metal production and consumption.


Lithium
Ranked: The Top 10 EV Battery Manufacturers in 2023
Asia dominates this ranking of the world’s largest EV battery manufacturers in 2023.


The Top 10 EV Battery Manufacturers in 2023
This was originally posted on our Voronoi app. Download the app for free on iOS or Android and discover incredible data-driven charts from a variety of trusted sources.
Despite efforts from the U.S. and EU to secure local domestic supply, all major EV battery manufacturers remain based in Asia.
In this graphic we rank the top 10 EV battery manufacturers by total battery deployment (measured in megawatt-hours) in 2023. The data is from EV Volumes.
Chinese Dominance
Contemporary Amperex Technology Co. Limited (CATL) has swiftly risen in less than a decade to claim the title of the largest global battery group.
The Chinese company now has a 34% share of the market and supplies batteries to a range of made-in-China vehicles, including the Tesla Model Y, SAIC’s MG4/Mulan, and various Li Auto models.
| Company | Country | 2023 Production (megawatt-hour) | Share of Total Production |
|---|---|---|---|
| CATL | 🇨🇳 China | 242,700 | 34% |
| BYD | 🇨🇳 China | 115,917 | 16% |
| LG Energy Solution | 🇰🇷 Korea | 108,487 | 15% |
| Panasonic | 🇯🇵 Japan | 56,560 | 8% |
| SK On | 🇰🇷 Korea | 40,711 | 6% |
| Samsung SDI | 🇰🇷 Korea | 35,703 | 5% |
| CALB | 🇨🇳 China | 23,493 | 3% |
| Farasis Energy | 🇨🇳 China | 16,527 | 2% |
| Envision AESC | 🇨🇳 China | 8,342 | 1% |
| Sunwoda | 🇨🇳 China | 6,979 | 1% |
| Other | - | 56,040 | 8% |
In 2023, BYD surpassed LG Energy Solution to claim second place. This was driven by demand from its own models and growth in third-party deals, including providing batteries for the made-in-Germany Tesla Model Y, Toyota bZ3, Changan UNI-V, Venucia V-Online, as well as several Haval and FAW models.
The top three battery makers (CATL, BYD, LG) collectively account for two-thirds (66%) of total battery deployment.
Once a leader in the EV battery business, Panasonic now holds the fourth position with an 8% market share, down from 9% last year. With its main client, Tesla, now sourcing batteries from multiple suppliers, the Japanese battery maker seems to be losing its competitive edge in the industry.
Overall, the global EV battery market size is projected to grow from $49 billion in 2022 to $98 billion by 2029, according to Fortune Business Insights.

-

 Debt1 week ago
How Debt-to-GDP Ratios Have Changed Since 2000
-

 Markets2 weeks ago
Ranked: The World’s Top Flight Routes, by Revenue
-

 Countries2 weeks ago
Population Projections: The World’s 6 Largest Countries in 2075
-

 Markets2 weeks ago
The Top 10 States by Real GDP Growth in 2023
-

 Demographics2 weeks ago
The Smallest Gender Wage Gaps in OECD Countries
-

 United States2 weeks ago
Where U.S. Inflation Hit the Hardest in March 2024
-

 Green2 weeks ago
Top Countries By Forest Growth Since 2001
-

 United States2 weeks ago
Ranked: The Largest U.S. Corporations by Number of Employees