Mining
Mapped: The 10 Largest Gold Mines in the World, by Production
![]() Subscribe to the Elements free mailing list for more like this
Subscribe to the Elements free mailing list for more like this
The 10 Largest Gold Mines in the World, by Production
This was originally posted on Elements. Sign up to the free mailing list to get beautiful visualizations on natural resource megatrends in your email every week.
Gold mining is a global business, with hundreds of mining companies digging for the precious metal in dozens of countries.
But where exactly are the largest gold mines in the world?
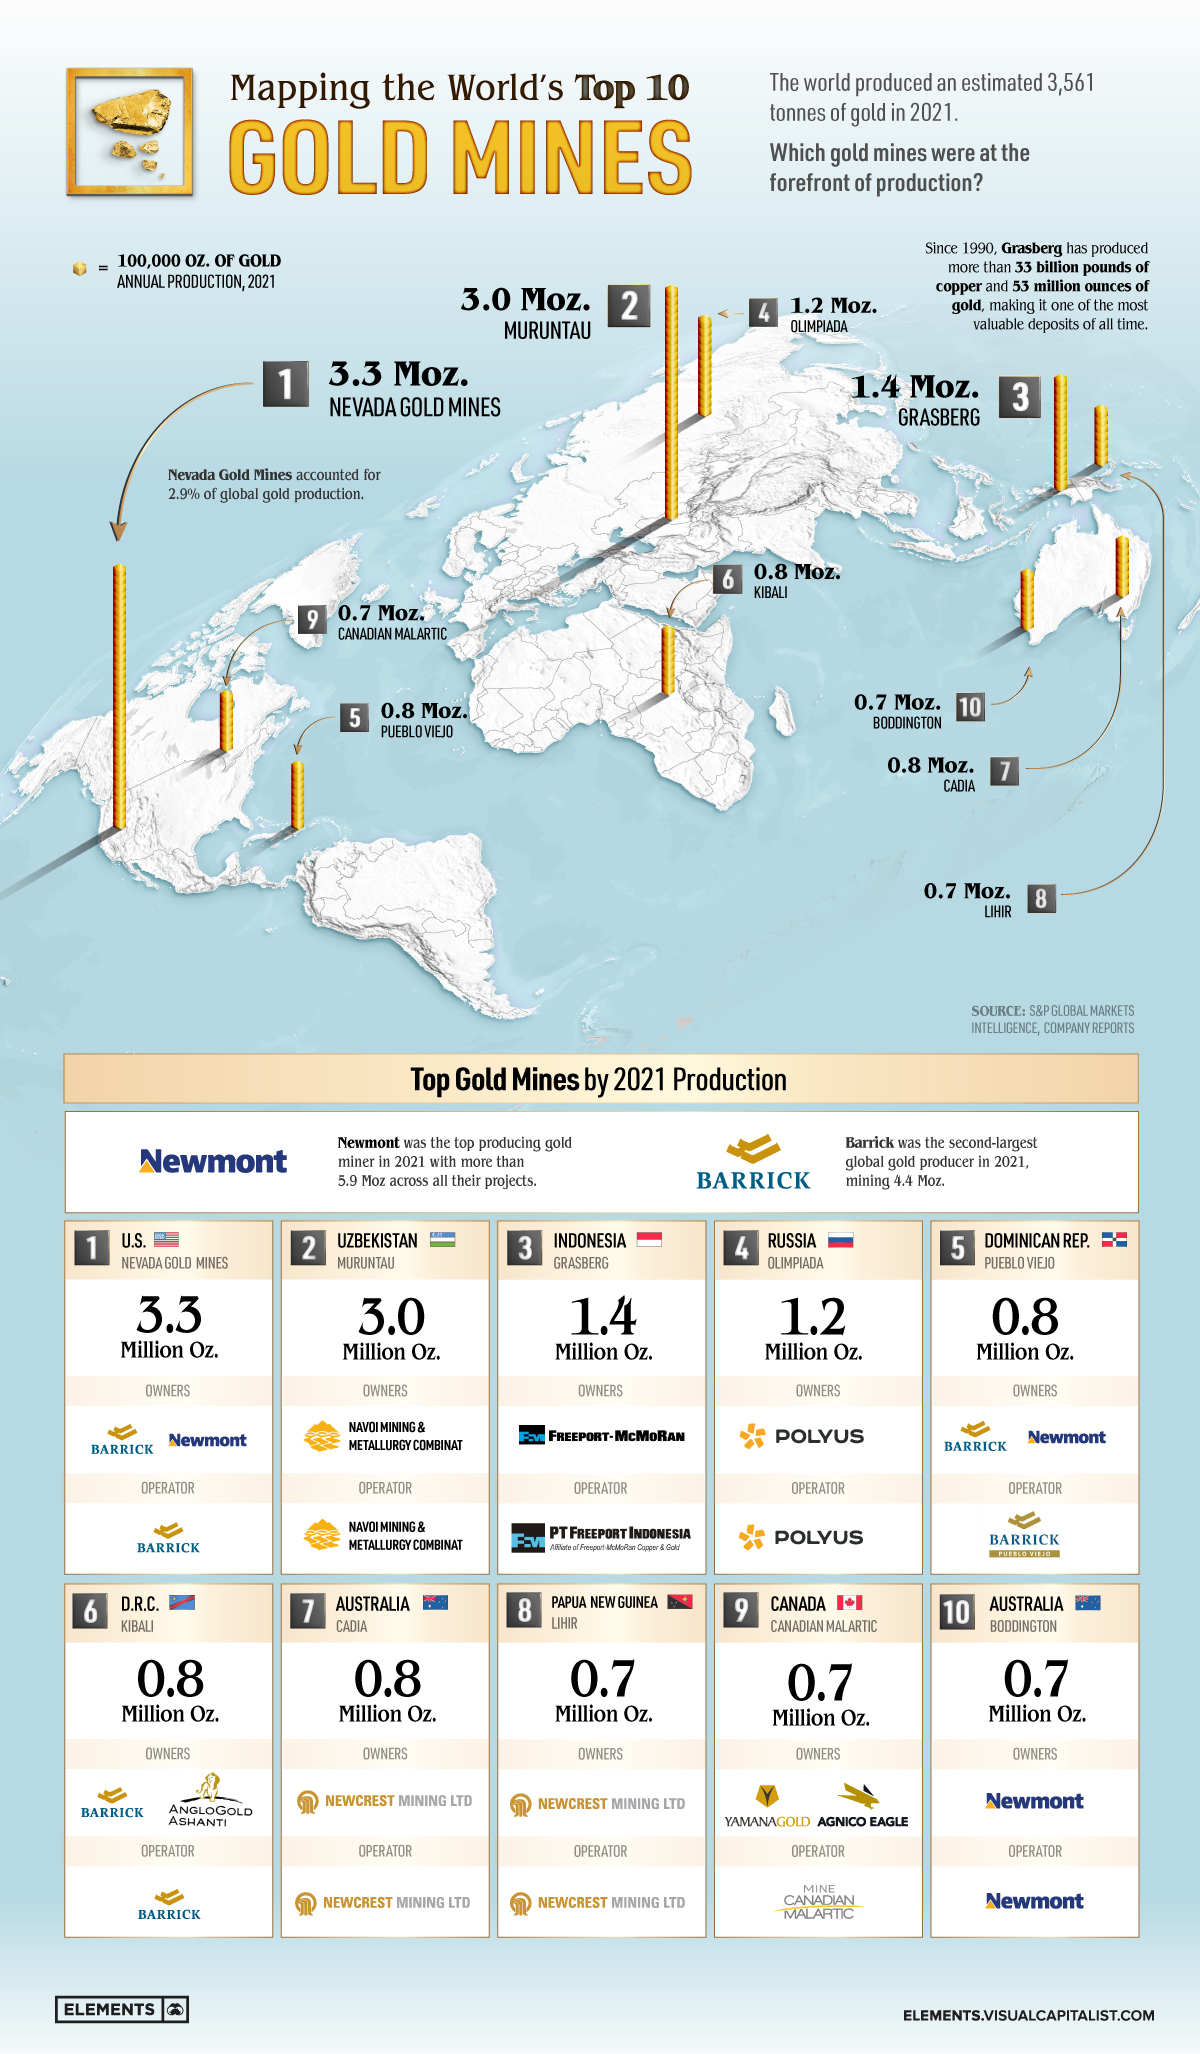
The above infographic uses data compiled from S&P Global Market Intelligence and company reports to map the top 10 gold-producing mines in 2021.
Editor’s Note: The article uses publicly available global production data from the World Gold Council to calculate the production share of each mine. The percentages slightly differ from those calculated by S&P.
The Top Gold Mines in 2021
The 10 largest gold mines are located across nine different countries in North America, Oceania, Africa, and Asia.
Together, they accounted for around 13 million ounces or 12% of global gold production in 2021.
| Rank | Mine | Location | Production (ounces) | % of global production |
|---|---|---|---|---|
| #1 | Nevada Gold Mines | 🇺🇸 U.S. | 3,311,000 | 2.9% |
| #2 | Muruntau | 🇺🇿 Uzbekistan | 2,990,020 | 2.6% |
| #3 | Grasberg | 🇮🇩 Indonesia | 1,370,000 | 1.2% |
| #4 | Olimpiada | 🇷🇺 Russia | 1,184,068 | 1.0% |
| #5 | Pueblo Viejo | 🇩🇴 Dominican Republic | 814,000 | 0.7% |
| #6 | Kibali | 🇨🇩 Democratic Republic of the Congo | 812,000 | 0.7% |
| #7 | Cadia | 🇦🇺 Australia | 764,895 | 0.7% |
| #8 | Lihir | 🇵🇬 Papua New Guinea | 737,082 | 0.6% |
| #9 | Canadian Malartic | 🇨🇦 Canada | 714,784 | 0.6% |
| #10 | Boddington | 🇦🇺 Australia | 696,000 | 0.6% |
| N/A | Total | N/A | 13,393,849 | 11.7% |
Share of global gold production is based on 3,561 tonnes (114.5 million troy ounces) of 2021 production as per the World Gold Council.
In 2019, the world’s two largest gold miners—Barrick Gold and Newmont Corporation—announced a historic joint venture combining their operations in Nevada. The resulting joint corporation, Nevada Gold Mines, is now the world’s largest gold mining complex with six mines churning out over 3.3 million ounces annually.
Uzbekistan’s state-owned Muruntau mine, one of the world’s deepest open-pit operations, produced just under 3 million ounces, making it the second-largest gold mine. Muruntau represents over 80% of Uzbekistan’s overall gold production.
Only two other mines—Grasberg and Olimpiada—produced more than 1 million ounces of gold in 2021. Grasberg is not only the third-largest gold mine but also one of the largest copper mines in the world. Olimpiada, owned by Russian gold mining giant Polyus, holds around 26 million ounces of gold reserves.
Polyus was also recently crowned the biggest miner in terms of gold reserves globally, holding over 104 million ounces of proven and probable gold between all deposits.
How Profitable is Gold Mining?
The price of gold is up by around 50% since 2016, and it’s hovering near the all-time high of $2,000/oz.
That’s good news for gold miners, who achieved record-high profit margins in 2020. For every ounce of gold produced in 2020, gold miners pocketed $828 on average, significantly higher than the previous high of $666/oz set in 2011.
With inflation rates hitting decade-highs in several countries, gold mining could be a sector to watch, especially given gold’s status as a traditional inflation hedge.


Lithium
Ranked: The Top 10 EV Battery Manufacturers in 2023
Asia dominates this ranking of the world’s largest EV battery manufacturers in 2023.


The Top 10 EV Battery Manufacturers in 2023
This was originally posted on our Voronoi app. Download the app for free on iOS or Android and discover incredible data-driven charts from a variety of trusted sources.
Despite efforts from the U.S. and EU to secure local domestic supply, all major EV battery manufacturers remain based in Asia.
In this graphic we rank the top 10 EV battery manufacturers by total battery deployment (measured in megawatt-hours) in 2023. The data is from EV Volumes.
Chinese Dominance
Contemporary Amperex Technology Co. Limited (CATL) has swiftly risen in less than a decade to claim the title of the largest global battery group.
The Chinese company now has a 34% share of the market and supplies batteries to a range of made-in-China vehicles, including the Tesla Model Y, SAIC’s MG4/Mulan, and various Li Auto models.
| Company | Country | 2023 Production (megawatt-hour) | Share of Total Production |
|---|---|---|---|
| CATL | 🇨🇳 China | 242,700 | 34% |
| BYD | 🇨🇳 China | 115,917 | 16% |
| LG Energy Solution | 🇰🇷 Korea | 108,487 | 15% |
| Panasonic | 🇯🇵 Japan | 56,560 | 8% |
| SK On | 🇰🇷 Korea | 40,711 | 6% |
| Samsung SDI | 🇰🇷 Korea | 35,703 | 5% |
| CALB | 🇨🇳 China | 23,493 | 3% |
| Farasis Energy | 🇨🇳 China | 16,527 | 2% |
| Envision AESC | 🇨🇳 China | 8,342 | 1% |
| Sunwoda | 🇨🇳 China | 6,979 | 1% |
| Other | - | 56,040 | 8% |
In 2023, BYD surpassed LG Energy Solution to claim second place. This was driven by demand from its own models and growth in third-party deals, including providing batteries for the made-in-Germany Tesla Model Y, Toyota bZ3, Changan UNI-V, Venucia V-Online, as well as several Haval and FAW models.
The top three battery makers (CATL, BYD, LG) collectively account for two-thirds (66%) of total battery deployment.
Once a leader in the EV battery business, Panasonic now holds the fourth position with an 8% market share, down from 9% last year. With its main client, Tesla, now sourcing batteries from multiple suppliers, the Japanese battery maker seems to be losing its competitive edge in the industry.
Overall, the global EV battery market size is projected to grow from $49 billion in 2022 to $98 billion by 2029, according to Fortune Business Insights.

-

 Education1 week ago
How Hard Is It to Get Into an Ivy League School?
-

 Technology2 weeks ago
Ranked: Semiconductor Companies by Industry Revenue Share
-

 Markets2 weeks ago
Ranked: The World’s Top Flight Routes, by Revenue
-

 Demographics2 weeks ago
Population Projections: The World’s 6 Largest Countries in 2075
-

 Markets2 weeks ago
The Top 10 States by Real GDP Growth in 2023
-

 Demographics2 weeks ago
The Smallest Gender Wage Gaps in OECD Countries
-

 Economy2 weeks ago
Where U.S. Inflation Hit the Hardest in March 2024
-

 Environment2 weeks ago
Top Countries By Forest Growth Since 2001