Science
Visualized: How Snowflakes are Formed
The Art of Snow
If you look at snow up close, you will probably notice that it is made up of thousands of tiny flakes with beautifully complex designs.
These snowflakes are actually ice crystals. They form in our atmosphere, high in the clouds, and transform along their journey to Earth thanks to different factors and forces.
We look at how snowflakes are formed, and what atmospheric conditions contribute to the beautiful intricacies we’ve come to know them for.
How to Build a Snowflake
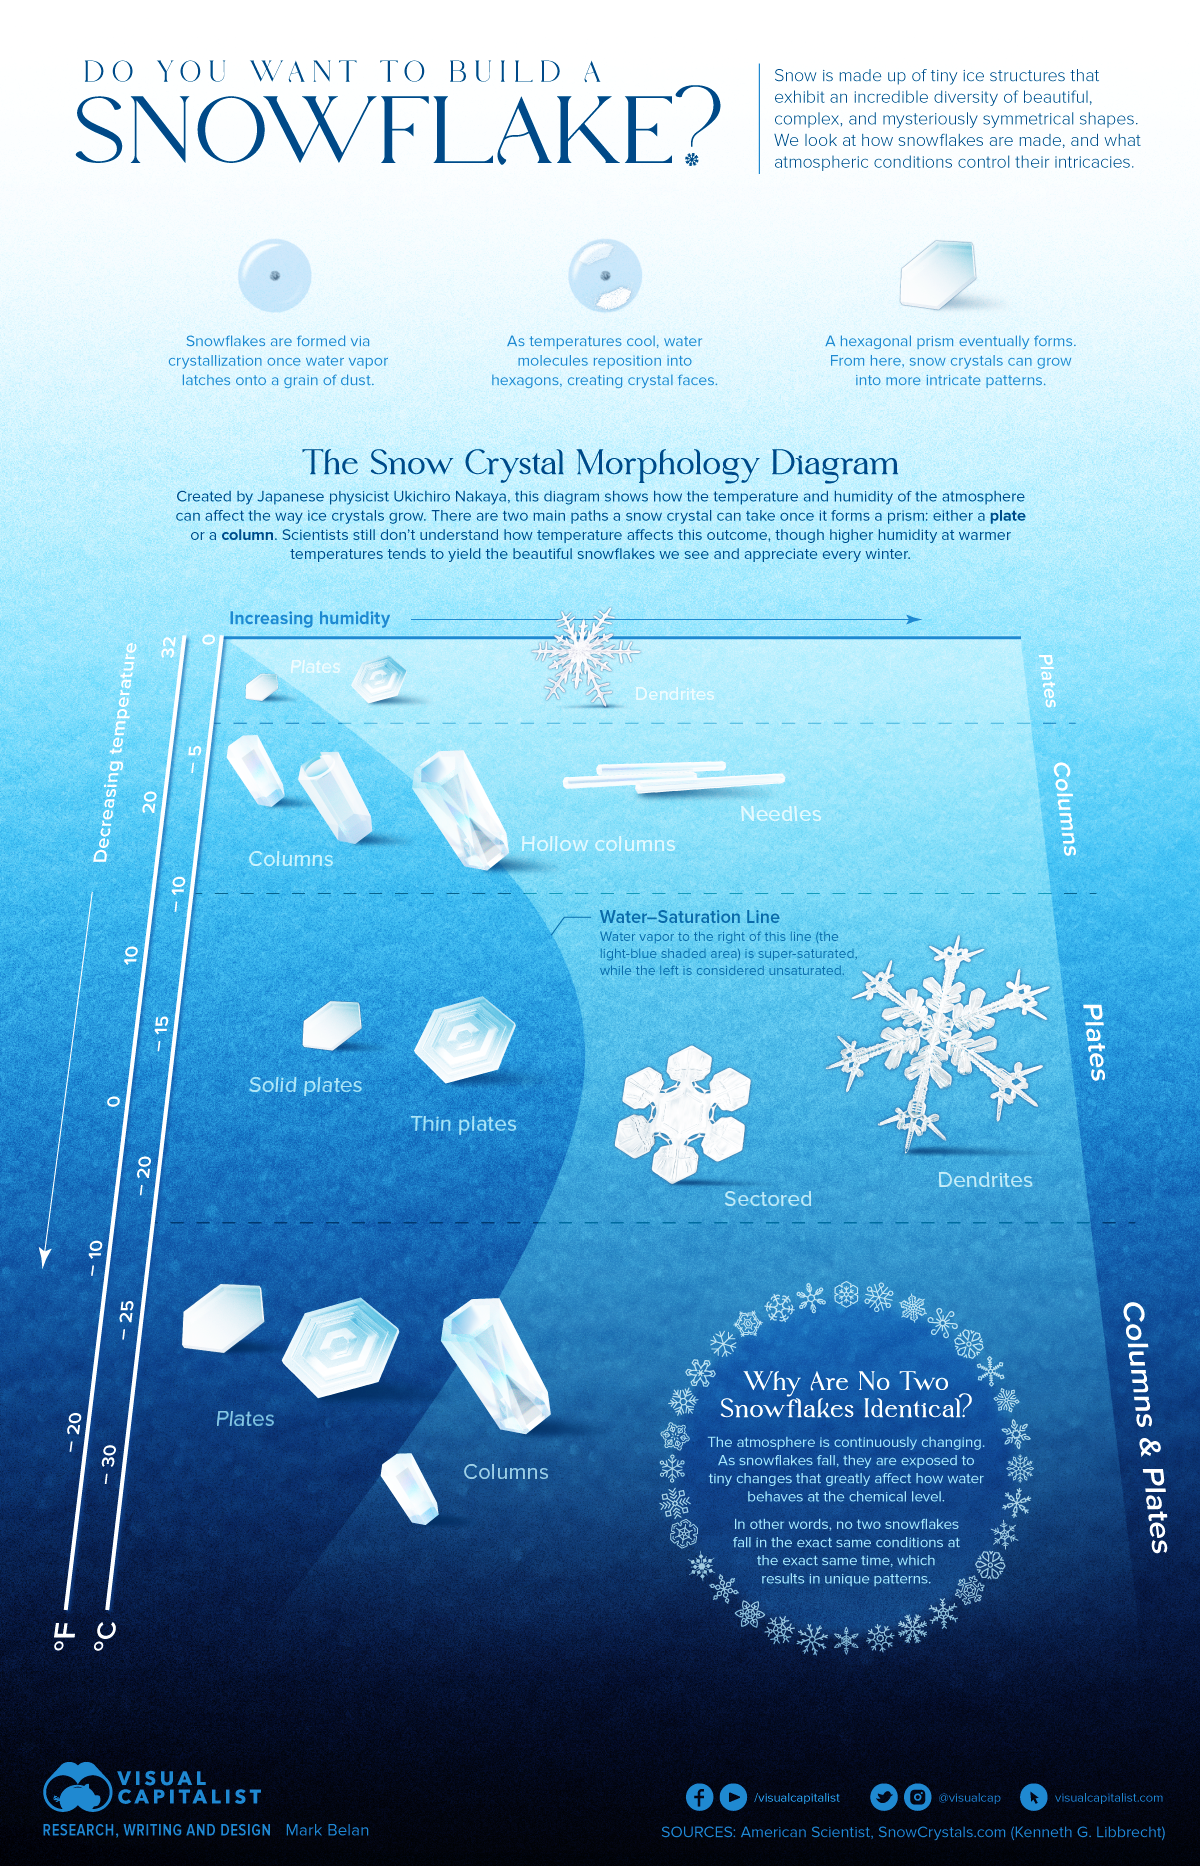
The designs of snowflakes are actually products of a crystallization process that is controlled by the atmosphere.
Water vapor in the atmosphere latches onto a free-floating speck of pollen or dust and acts as a nucleator. This means that it can begin to add on (ie. nucleate) more water molecules and grow in size. When this happens at cold temperatures, water also freezes and crystallizes.
Despite the many unique styles of snowflakes, they all crystallize in the exact same shape—a hexagon. The reason for this has to do with how water behaves at the chemical level. At room temperature, water molecules flow randomly around each other, forming and breaking bonds endlessly.
When temperatures cool, however, they begin to lose kinetic energy and form more stable bonds. By 0°C, they reorient themselves into an energetically-efficient position, which happens to be a rigid, hexagonal configuration. This is frozen water, or ice.
All snowflakes nucleate and crystallize this way. As more water molecules nucleate to the infant snow crystal, they crystallize long arms and branching tendrils, forming unique, artistic designs.
How these designs materialize is simply a matter of water availability and temperature, a relationship best described in the Nakaya Diagram of Snowflakes.
The Nakaya Diagram of Snowflakes
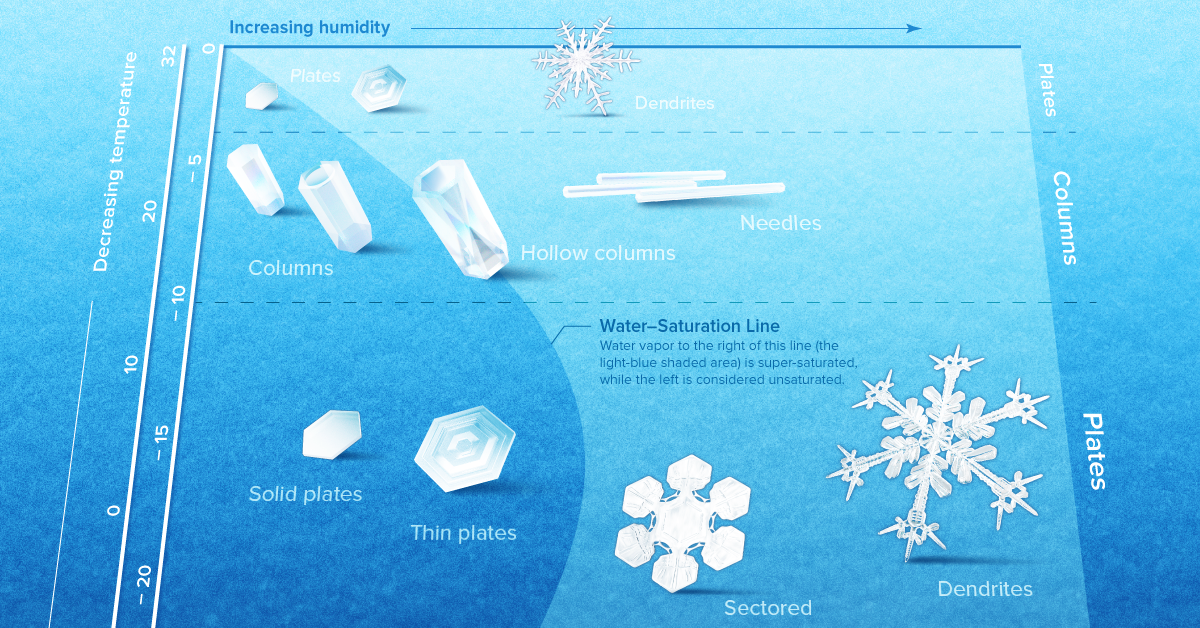
In the 1930s, Japanese physicist Ukichiro Nakaya created the first artificial snowflakes and studied their growth as an analog for natural snow crystal formation. The Snow Crystal Morphology Diagram, or the Nakaya Diagram, is his handy chart that illustrates how snowflakes are formed.
The diagram illustrates the kinds of snowflakes that form via atmospheric temperature and humidity during a snow crystal’s fall to the ground.
Snowflake size and complexity depend on the humidity of the atmosphere. More water means larger, more intricate snowflakes.
Surprisingly, snowflakes cycle between two classes of growth (plates vs. columns) as temperatures decrease.
Close to its 100-year anniversary, this detail of the Nakaya diagram still puzzles researchers today. Many continue to theorize and demonstrate how this phenomenon may be possible.
Start the Same, Finish Different
You might be wondering how it is possible that no two snowflakes are identical if they all have a hexagonal inception and can form only columns or plates.
The answer lies in the dynamic nature of the atmosphere.
The atmosphere is constantly changing. As each second goes by, temperature, humidity, wind direction, and a number of other factors bombard a snow crystal as it falls to the ground.
Snow crystals are sensitive to the tiniest of these changes. Water vapor that is crystallizing responds to different exposures which ultimately make new patterns.
Since no two snowflakes travel in the exact same path at the exact same time, no two snowflakes will look the same. Same start, different endings.


Science
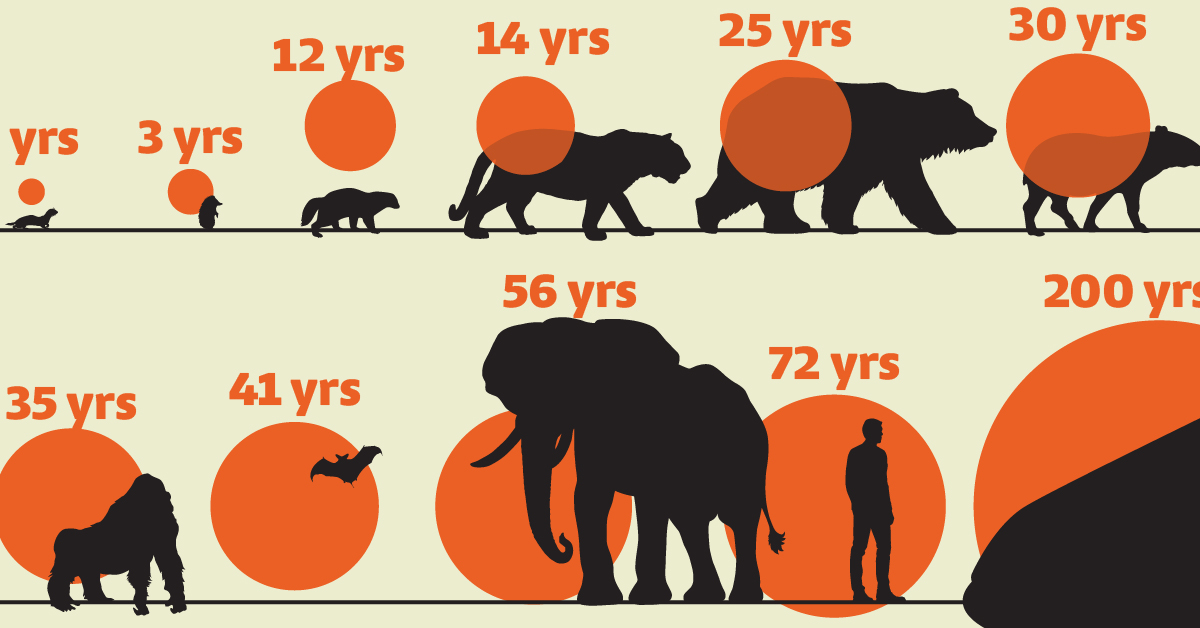
Visualizing the Average Lifespans of Mammals
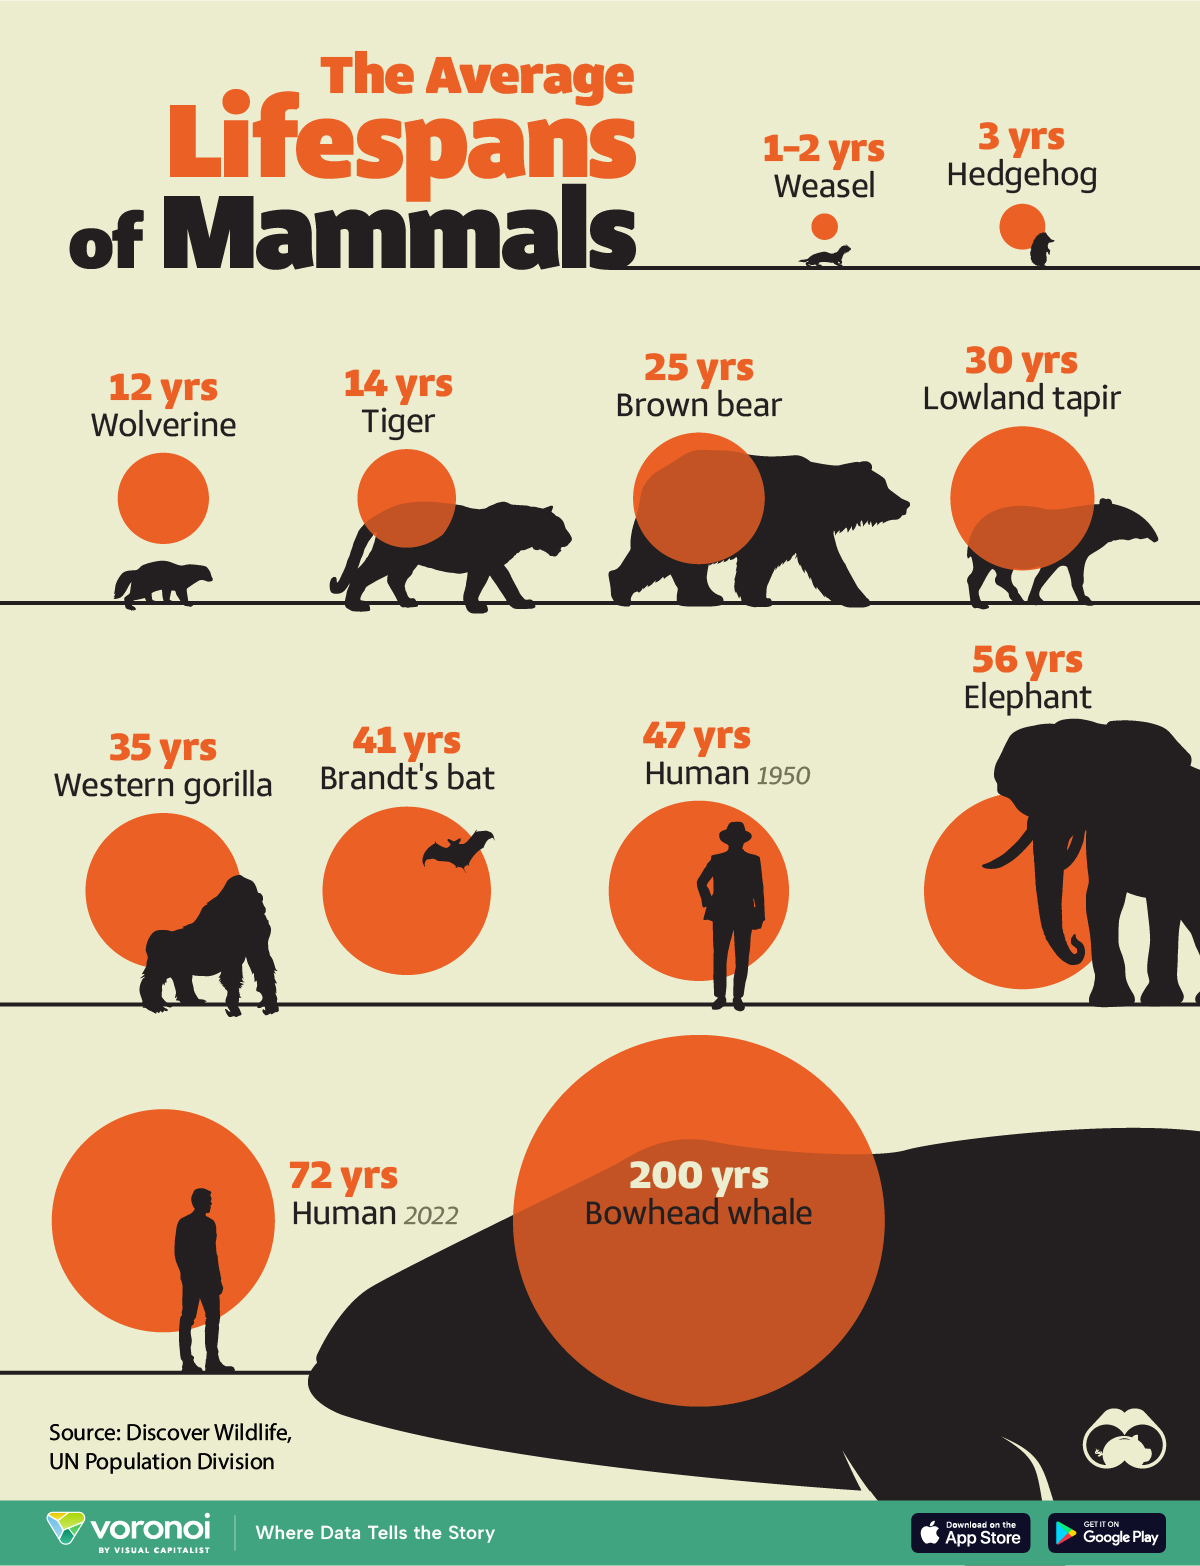
While smaller animals such as weasels typically live 1-2 years, larger counterparts can thrive for decades.
Visualizing the Average Lifespans of Mammals
This was originally posted on our Voronoi app. Download the app for free on iOS or Android and discover incredible data-driven charts from a variety of trusted sources.
Mammals, though comprising a small fraction of Earth’s creatures, hold vital ecological roles globally. They are crucial for maintaining ecosystem health through services like pollination, seed dispersal, and predator-prey dynamics.
In this visualization, we depict the average lifespans of mammals, using data from Discover Wildlife and the United Nations.
Human Lifespans on the Rise
Defined as warm-blooded creatures with hair or fur, mammals nurse their young with milk from mammary glands. While smaller animals such as weasels typically live 1-2 years, larger counterparts like elephants can thrive for decades, and bowhead whales can live for 200 years, or even longer.
| Animal | Average lifespan (years) |
|---|---|
| Weasel | 1 to 2 |
| Hedgehog | 3 |
| Wolverine | 12 |
| Tiger | 14 |
| Brown bear | 25 |
| Lowland tapir | 30 |
| Western gorilla | 35 |
| Brandt's bat | 41 |
| Humans (1950) | 47 |
| Elephant | 56 |
| Humans (2022) | 72 |
| Bowhead whale | 200 |
Notably, human lifespans have experienced a remarkable surge. According to the UN Population Division, the global average life expectancy has surged from 47 years in 1950 to 72 years in 2022, marking a 25-year increase. This is attributed to advancements in nutrition, medication, and essential resources.
However, as human longevity flourishes, it can have an adverse effect on wildlife mammal populations. To put this into numbers, over the past 100,000 years, the surge in human population has precipitated an 85% reduction in wild mammal biomass.
Today, livestock dominates 62% of the world’s mammal biomass, with humans accounting for 34%, while wild mammals comprise only 4%.
Despite a decline in mammal diversity, the total biomass of terrestrial mammals has significantly increased, expanding approximately ninefold over the past 10,000 years.
Curious to learn more about mammals? Check out this graphic that shows the biomass of all the world’s mammals.

-

 Science1 week ago
Visualizing the Average Lifespans of Mammals
-

 Demographics2 weeks ago
The Smallest Gender Wage Gaps in OECD Countries
-

 Economy2 weeks ago
Where U.S. Inflation Hit the Hardest in March 2024
-

 Green2 weeks ago
Top Countries By Forest Growth Since 2001
-

 United States2 weeks ago
Ranked: The Largest U.S. Corporations by Number of Employees
-

 Maps2 weeks ago
The Largest Earthquakes in the New York Area (1970-2024)
-

 Green2 weeks ago
Ranked: The Countries With the Most Air Pollution in 2023
-

 Green2 weeks ago
Ranking the Top 15 Countries by Carbon Tax Revenue