Maps
Where the Ultra-Rich Spend Their Holidays
Visualized: Where the Ultra-Rich Spend Their Holidays
There are more than 25,000 centi-millionaires around the world today, forming an elite club composed primarily of founders and heirs of family fortunes.
According to Henley & Partners, most of these individuals—who have more than $100 million in investable assets by definition—split their time between several properties each year.
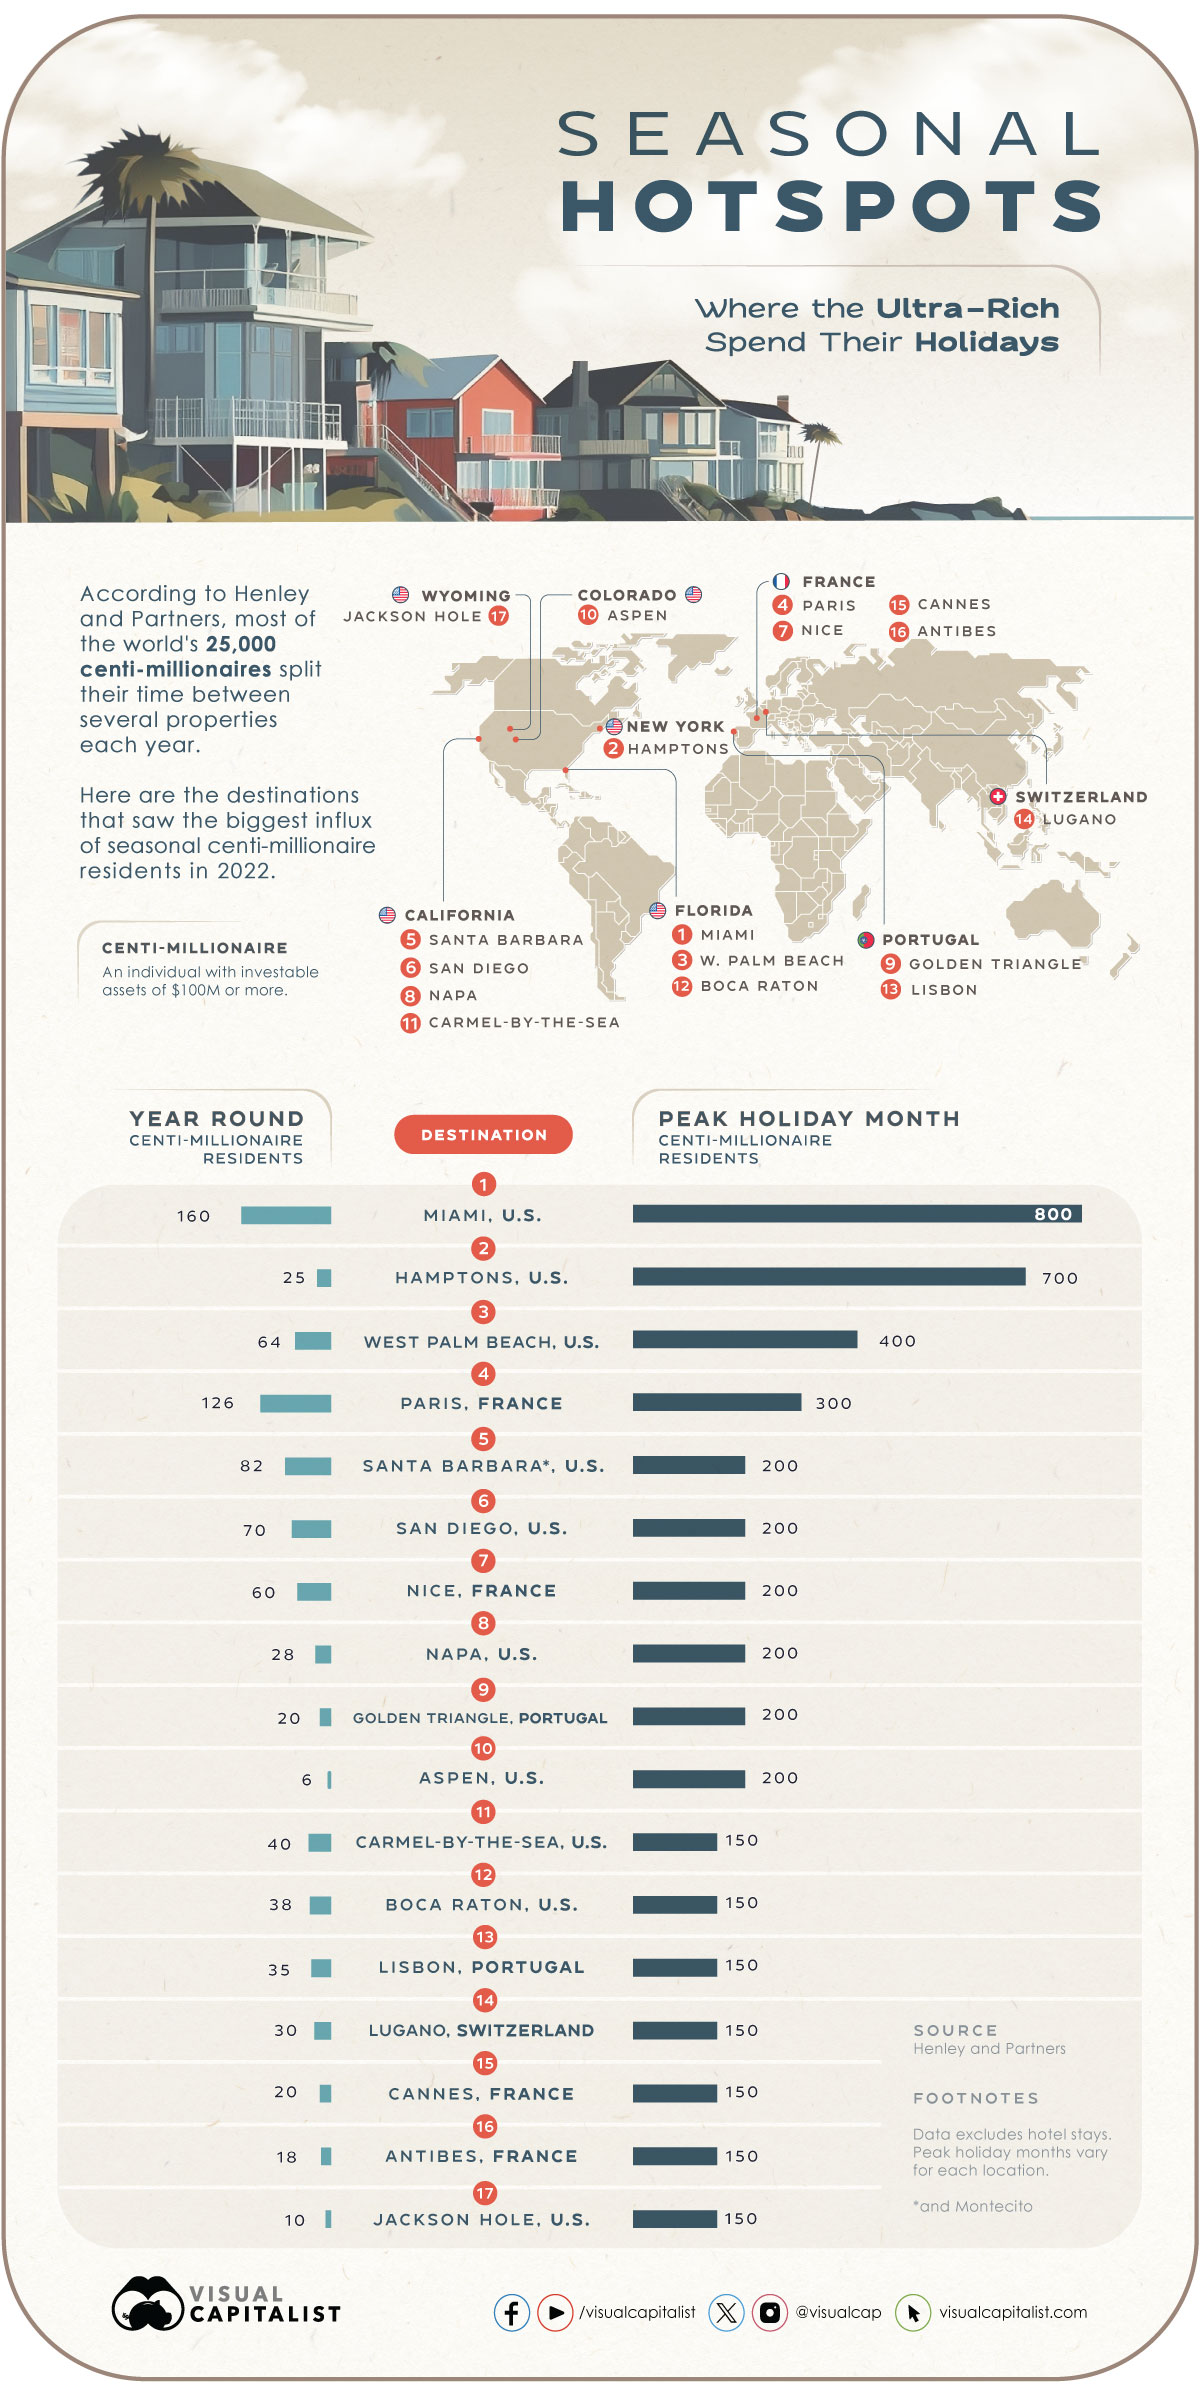
To explore the destinations that are the most sought-after by the ultra-wealthy, we’ve visualized the cities that saw the biggest influx of seasonal centi-millionaire residents in 2022, using data from Henley & Partners.
Centi-Millionaire Vacation Hotspots
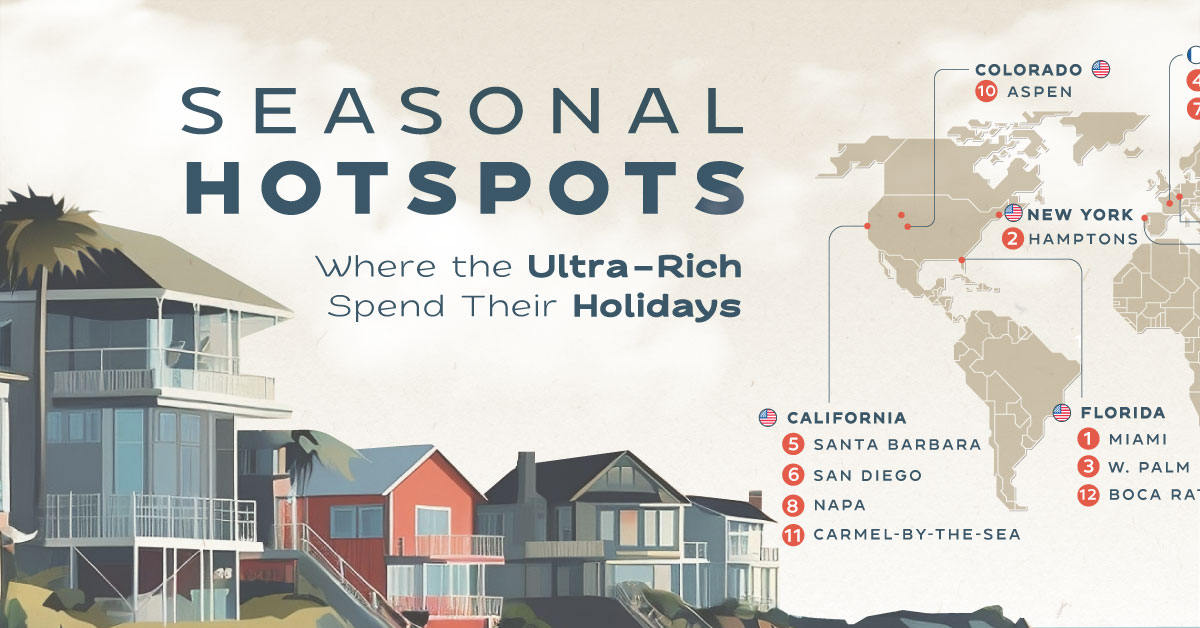
The top three seasonal vacation hotspots of the ultra-rich are found in the United States: Miami, the Hamptons, and Florida’s West Palm Beach.
This may not come as a shock given the concentration of centi-millionaires in the United States, with New York, the San Francisco Bay Area, and Los Angeles being home to the highest number of centi-millionaire residents in the world.
Regardless of where they live year-round, the table below reveals where these elites flock for seasonal getaways in their secondary homes.
| Rank | City or Town | Year-Round Centi-Millionaire Residents, 2022 | Peak Holiday Month Centi-Millionaire Residents, 2022 |
|---|---|---|---|
| 1 | 🇺🇸 Miami, Florida | 160 | 800 |
| 2 | 🇺🇸 The Hamptons, New York | 25 | 700 |
| 3 | 🇺🇸 West Palm Beach, Florida | 64 | 400 |
| 4 | 🇫🇷 Paris, France | 126 | 300 |
| 5 | 🇺🇸 Santa Barbara & Montecito, California | 82 | 200 |
| 6 | 🇺🇸 San Diego, California | 70 | 200 |
| 7 | 🇫🇷 Nice, France | 60 | 200 |
| 8 | 🇺🇸 Napa, California | 28 | 200 |
| 9 | 🇵🇹 Golden Triangle, Algarve, Portugal | 20 | 200 |
| 10 | 🇺🇸 Aspen, Colorado | 6 | 200 |
| 11 | 🇺🇸 Carmel-by-the-Sea, California | 40 | 150 |
| 12 | 🇺🇸 Boca Raton, Florida | 38 | 150 |
| 13 | 🇵🇹 Lisbon, Portugal | 35 | 150 |
| 14 | 🇨🇭 Lugano, Switzerland | 30 | 150 |
| 15 | 🇫🇷 Cannes, France | 20 | 150 |
| 16 | 🇫🇷 Antibes, France | 18 | 150 |
| 17 | 🇺🇸 Jackson Hole, Wyoming | 10 | 150 |
The data above only considers centi-millionaires vacationing in their secondary residences, therefore excluding hotel stays, holiday rentals, and yachts. Peak holiday months vary for each location.
Beyond the 10 U.S. cities that constitute the top 17 centi-millionaire seasonal hotspots, we come across several French cities on the list, including Paris, Nice, Cannes, and Antibes, as well as Portugal’s Golden Triangle and Lisbon.
Global Centi-Millionaire Trends
According to Henley & Partners’ 2023 Centi-Millionaire Report, the global centi-millionaire population is expected to grow by 38% in the next decade, reaching nearly 40,000 by 2033.
Much of this growth is expected to be seen in countries such as China, India, and Saudi Arabia. China’s Hangzhou and Shenzhen, specifically, are expected to see the highest percentage growth in centi-millionaire populations through 2033, growing by 95% and 88%, respectively.
Despite the rapid growth of the wealthy in the global East, however, it’s notable that many centi-millionaires are still graduating from American universities.
More than half of the top 20 universities with the most centi-millionaire alumni are in the United States, with Harvard, Stanford, and the University of Pennsylvania making up the top three spots.
Maps
The Largest Earthquakes in the New York Area (1970-2024)
The earthquake that shook buildings across New York in April 2024 was the third-largest quake in the Northeast U.S. over the past 50 years.
The Largest Earthquakes in the New York Area
This was originally posted on our Voronoi app. Download the app for free on Apple or Android and discover incredible data-driven charts from a variety of trusted sources.
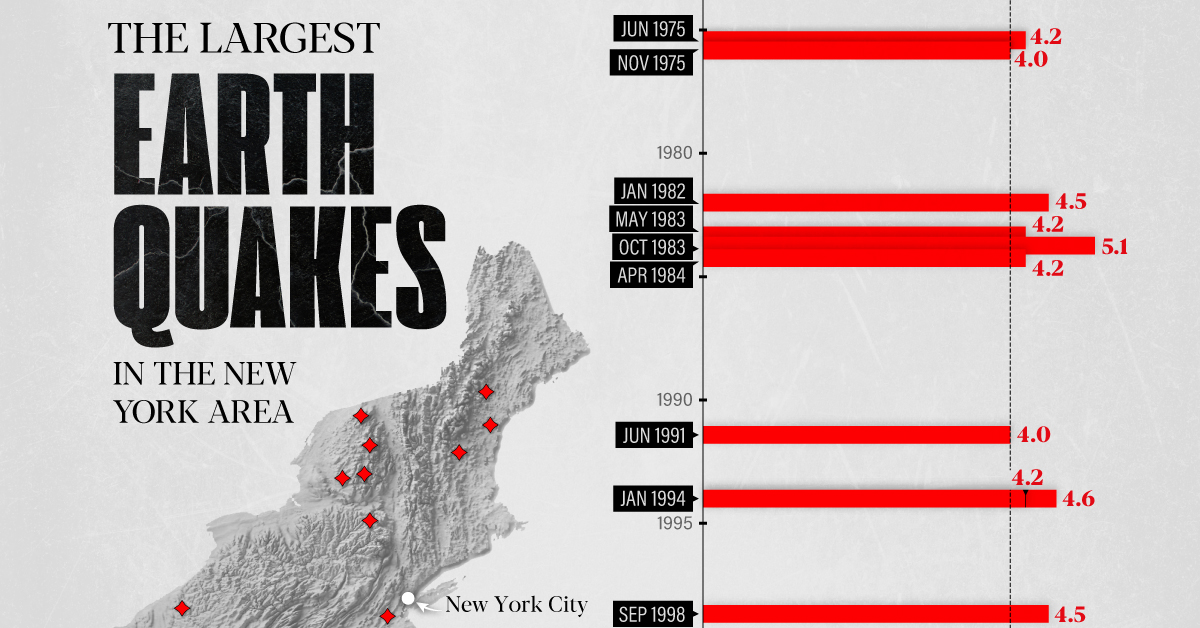
The 4.8 magnitude earthquake that shook buildings across New York on Friday, April 5th, 2024 was the third-largest quake in the U.S. Northeast area over the past 50 years.
In this map, we illustrate earthquakes with a magnitude of 4.0 or greater recorded in the Northeastern U.S. since 1970, according to the United States Geological Survey (USGS).
Shallow Quakes and Older Buildings
The earthquake that struck the U.S. Northeast in April 2024 was felt by millions of people from Washington, D.C., to north of Boston. It even caused a full ground stop at Newark Airport.
The quake, occurring just 5 km beneath the Earth’s surface, was considered shallow, which is what contributed to more intense shaking at the surface.
According to the USGS, rocks in the eastern U.S. are significantly older, denser, and harder than those on the western side, compressed by time. This makes them more efficient conduits for seismic energy. Additionally, buildings in the Northeast tend to be older and may not adhere to the latest earthquake codes.
Despite disrupting work and school life, the earthquake was considered minor, according to the Michigan Technological University magnitude scale:
| Magnitude | Earthquake Effects | Estimated Number Each Year |
|---|---|---|
| 2.5 or less | Usually not felt, but can be recorded by seismograph. | Millions |
| 2.5 to 5.4 | Often felt, but only causes minor damage. | 500,000 |
| 5.5 to 6.0 | Slight damage to buildings and other structures. | 350 |
| 6.1 to 6.9 | May cause a lot of damage in very populated areas. | 100 |
| 7.0 to 7.9 | Major earthquake. Serious damage. | 10-15 |
| 8.0 or greater | Great earthquake. Can totally destroy communities near the epicenter. | One every year or two |
The largest earthquake felt in the area over the past 50 years was a 5.3 magnitude quake that occurred in Au Sable Forks, New York, in 2002. It damaged houses and cracked roads in a remote corner of the Adirondack Mountains, but caused no injuries.
| Date | Magnitude | Location | State |
|---|---|---|---|
| April 20, 2002 | 5.3 | Au Sable Forks | New York |
| October 7, 1983 | 5.1 | Newcomb | New York |
| April 5, 2024 | 4.8 | Whitehouse Station | New Jersey |
| October 16, 2012 | 4.7 | Hollis Center | Maine |
| January 16, 1994 | 4.6 | Sinking Spring | Pennsylvania |
| January 19, 1982 | 4.5 | Sanbornton | New Hampshire |
| September 25, 1998 | 4.5 | Adamsville | Pennsylvania |
| June 9, 1975 | 4.2 | Altona | New York |
| May 29, 1983 | 4.2 | Peru | Maine |
| April 23, 1984 | 4.2 | Conestoga | Pennsylvania |
| January 16, 1994 | 4.2 | Sinking Spring | Pennsylvania |
| November 3, 1975 | 4 | Long Lake | New York |
| June 17, 1991 | 4 | Worcester | New York |
The largest earthquake in U.S. history, however, was the 1964 Good Friday quake in Alaska, measuring 9.2 magnitude and killing 131 people.
-

 Education1 week ago
How Hard Is It to Get Into an Ivy League School?
-

 Technology2 weeks ago
Ranked: Semiconductor Companies by Industry Revenue Share
-

 Markets2 weeks ago
Ranked: The World’s Top Flight Routes, by Revenue
-

 Demographics2 weeks ago
Population Projections: The World’s 6 Largest Countries in 2075
-

 Markets2 weeks ago
The Top 10 States by Real GDP Growth in 2023
-

 Demographics2 weeks ago
The Smallest Gender Wage Gaps in OECD Countries
-

 Economy2 weeks ago
Where U.S. Inflation Hit the Hardest in March 2024
-

 Environment2 weeks ago
Top Countries By Forest Growth Since 2001
