Misc
Visualized: The Best Universities in America
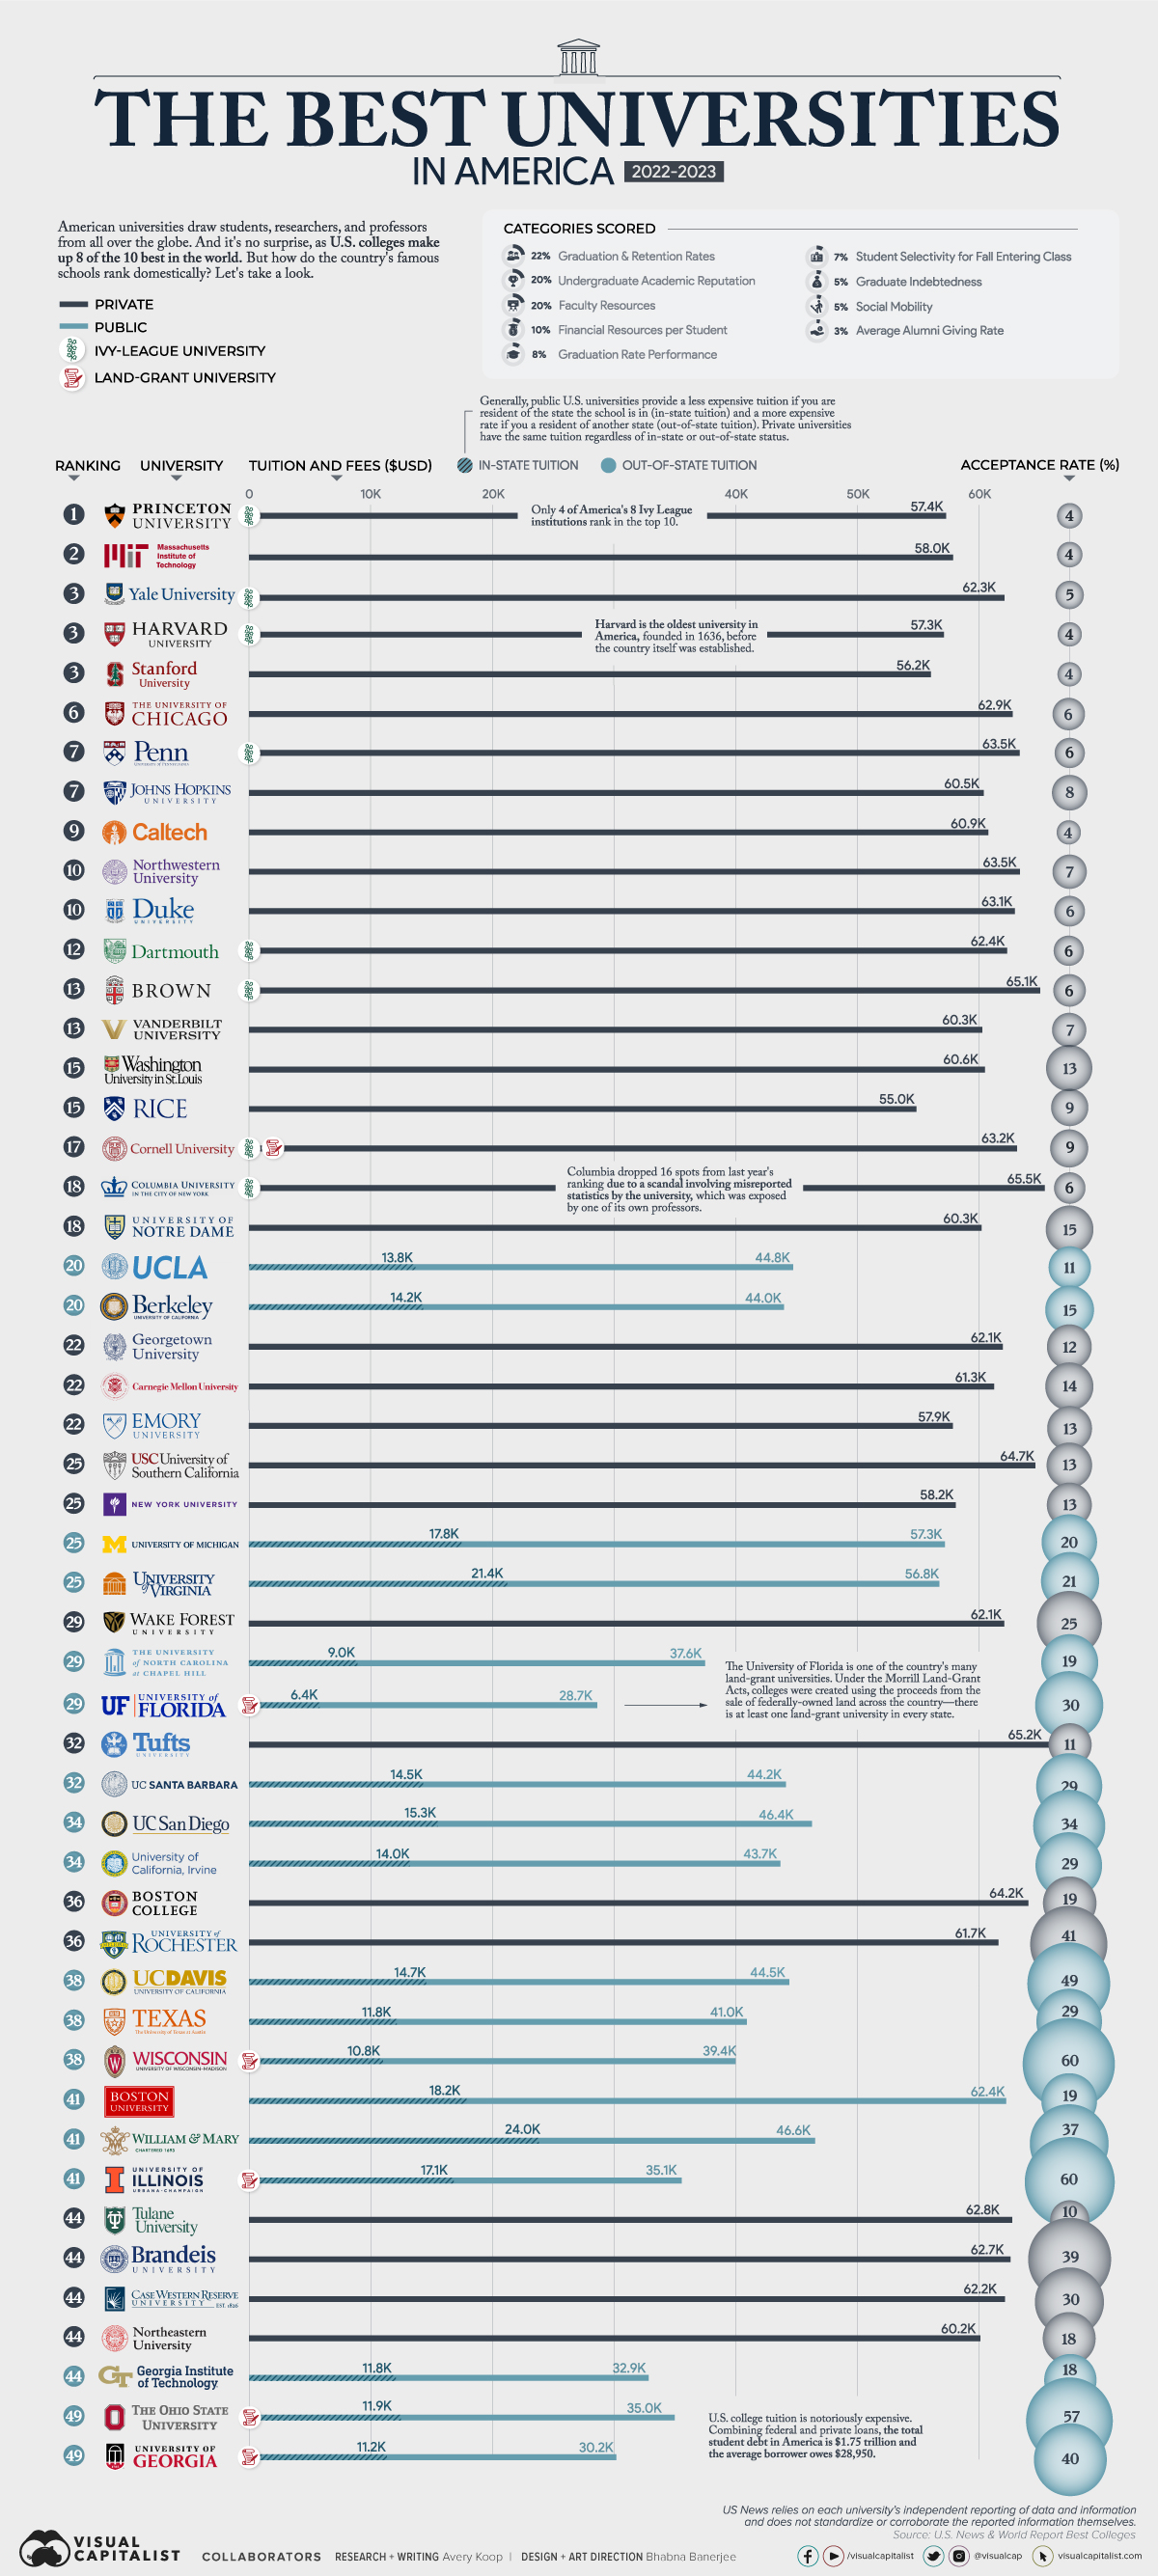


Visualized: The Best Universities in America
The United States is home to many world-class universities like Harvard, Princeton, and Yale, which boast innovative research programs, famous alumni, prestigious awards, and students and faculty from all over the world.
But which schools are actually the best ones in America?
This ranking uses data from U.S. News & World Report to rank America’s 50 best universities from the Ivy League to public institutions. Additionally, this visual shows the average tuition and acceptance rate of each school.
The Methodology
Here’s a look at how different categories are scored in the ranking. It is worth noting that U.S. News relies on each university’s independent reporting of data and information and does not standardize or corroborate the reported information themselves.
How categories are weighted:
- Graduation & Retention Rates = 22%
- Undergraduate Academic Reputation = 20%
- Faculty Resources = 20%
- Financial Resources per Student = 10%
- Graduation Rate Performance = 8%
- Student Selectivity for Fall Entering Class = 7%
- Social Mobility = 5%
- Graduate Indebtedness = 5%
- Average Alumni Giving Rate = 3%
The Top Schools
Ivy League universities are often assumed to be the top schools in America, but in reality, only four of the eight make the top 10.
Here’s a closer look:
| Rank | University | Acceptance Rate | School Type | Tuition and Fees (Private or Public Out-of-State) | In-State Tuition (Public Institutions Only) | State |
|---|---|---|---|---|---|---|
| #1 | Princeton University | 4% | Private, Ivy League | $57,410 | N/A | New Jersey |
| #2 | Massachusetts Institute of Technology | 4% | Private | $57,986 | N/A | Massachusetts |
| #3 | Yale University | 5% | Private, Ivy League | $62,250 | N/A | Connecticut |
| #3 | Harvard University | 4% | Private, Ivy League | $57,261 | N/A | Massachusetts |
| #3 | Stanford University | 4% | Private | $56,169 | N/A | California |
| #6 | University of Chicago | 6% | Private | $62,940 | N/A | Illinois |
| #7 | University of Pennsylvania | 6% | Private, Ivy League | $63,452 | N/A | Pennsylvania |
| #7 | Johns Hopkins University | 8% | Private | $60,480 | N/A | Maryland |
| #9 | California Institute of Technology | 4% | Private | $60,864 | N/A | California |
| #10 | Northwestern University | 7% | Private | $63,468 | N/A | Illinois |
| #10 | Duke University | 6% | Private | $63,054 | N/A | North Carolina |
| #12 | Dartmouth College | 6% | Private, Ivy League | $62,430 | N/A | New Hampshire |
| #13 | Brown University | 6% | Private, Ivy League | $65,146 | N/A | Rhode Island |
| #13 | Vanderbilt University | 7% | Private | $60,348 | N/A | Tennessee |
| #15 | Washington University in St. Louis | 13% | Private | $60,590 | N/A | Missouri |
| #15 | Rice University | 9% | Private | $54,960 | N/A | Texas |
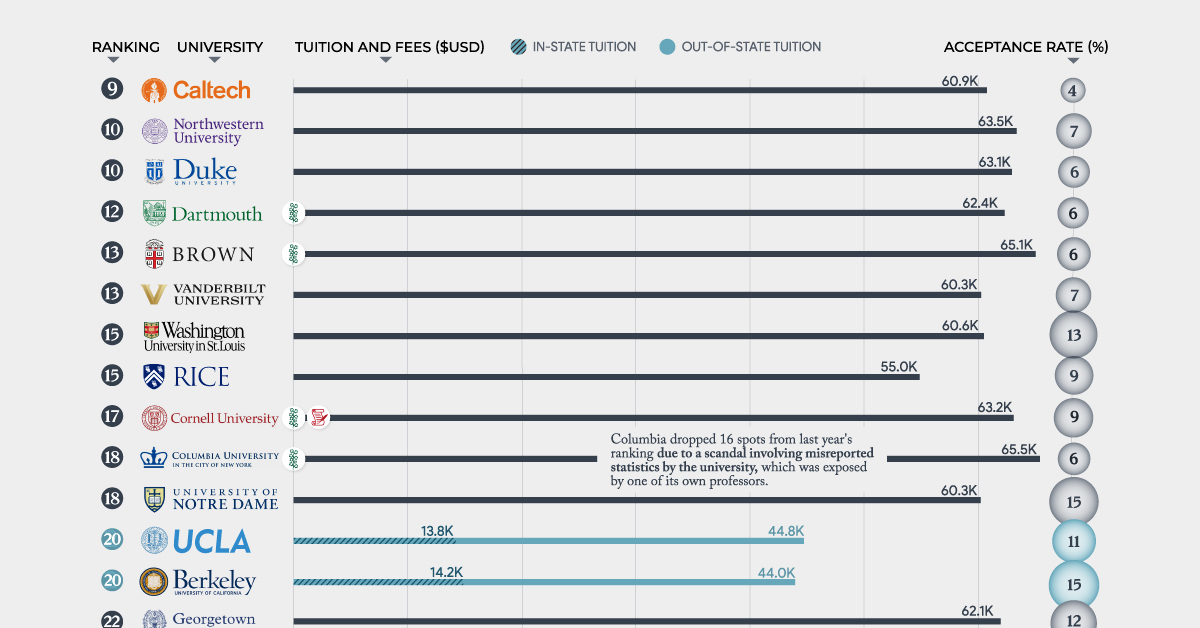
| #17 | Cornell University | 9% | Private, Ivy League, Land-Grant | $63,200 | N/A | New York |
| #18 | Columbia University | 6% | Private, Ivy League | $65,524 | N/A | New York |
| #18 | University of Notre Dame | 15% | Private | $60,301 | N/A | Indiana |
| #20 | University of California, Los Angeles | 11% | Public | $44,830 | $13,804 | California |
| #20 | University of California, Berkeley | 15% | Public | $43,980 | $14,226 | California |
| #22 | Georgetown University | 12% | Private | $62,052 | N/A | District of Columbia |
| #22 | Carnegie Mellon University | 14% | Private | $61,344 | N/A | Pennsylvania |
| #22 | Emory University | 13% | Private | $57,948 | N/A | Georgia |
| #25 | University of Southern California | 13% | Private | $64,726 | N/A | California |
| #25 | New York University | 13% | Private | $58,168 | N/A | New York |
| #25 | University of Michigan--Ann Arbor | 20% | Public | $57,273 | $17,786 | Michigan |
| #25 | University of Virginia | 21% | Public | $56,837 | $21,381 | Virginia |
| #29 | Wake Forest University | 25% | Private | $62,128 | N/A | North Carolina |
| #29 | University of North Carolina at Chapel Hill | 19% | Public | $37,558 | $8,998 | North Carolina |
| #29 | University of Florida | 30% | Public, Land-Grant | $28,658 | $6,380 | Florida |
| #32 | Tufts University | 11% | Private | $65,222 | N/A | Massachussets |
| #32 | University of California, Santa Barbara | 29% | Public | $44,204 | $14,450 | California |
| #34 | University of California, San Diego | 34% | Public | $46,374 | $15,348 | California |
| #34 | University of California, Irvine | 29% | Public | $43,739 | $13,985 | California |
| #36 | Boston College | 19% | Private | $64,176 | N/A | Massachussetts |
| #36 | University of Rochester | 41% | Private | $61,678 | N/A | New York |
| #38 | University of California, Davis | 49% | Public | $44,494 | $14,740 | California |
| #38 | University of Texas at Austin | 29% | Public | $40,996 | $11,752 | Texas |
| #38 | University of Wisconsin--Madison | 60% | Public, Land-Grant | $39,427 | $10,796 | Wisconsin |
| #41 | Boston University | 19% | Public | $62,360 | $18,229 | Massachussetts |
| #41 | William & Mary | 37% | Public | $46,625 | $23,970 | Virginia |
| #41 | University of Illinois Urbana-Champaign | 6% | Public, Land-Grant | $35,110 | $17,138 | Illinois |
| #44 | Tulane University | 10% | Private | $62,844 | N/A | Louisiana |
| #44 | Brandeis University | 39% | Private | $62,722 | N/A | Massachussets |
| #44 | Case Western Reserve University | 30% | Private | $62,234 | N/A | Ohio |
| #44 | Northeastern University | 18% | Private | $60,192 | N/A | Massachusse |
| #44 | Georgia Institute of Technology | 18% | Private | $32,876 | $11,764 | Georgia |
| #49 | The Ohio State University | 57% | Private, Land-Grant | $35,019 | $11,936 | Ohio |
| #49 | University of Georgia | 40% | Private, Land-Grant | $30,220 | $11,180 | Georgia |
One of the Ivies, Columbia University, actually dropped 16 spots from last year’s ranking due to a scandal involving misreported statistics by the university, which was exposed by one of its own professors. There have been critiques of the U.S. News & World Report ranking since, as it doesn’t provide a uniform set of standards for the universities, but lets them determine how they score their categories themselves.
Among the top 10 schools admittance is very competitive, and none of the acceptance rates surpass the 7% mark. Massachusetts Institute of Technology (MIT), Stanford University, and Caltech are among the most difficult universities to get into, with only 4% of applicants receiving that exciting acceptance letter. On the flip side, the universities of Illinois and Wisconsin, for example, accept 60% of all applicants.
Types of Universities
A few more things to know—there are eight private schools in the U.S. that have earned the distinction of “Ivy League,” due to their history and prestige. A number of schools are also classified as land-grant universities—built on land which was essentially given to them by the U.S. government. This was in an effort to provide higher education to lacking communities across the country, and there is at least one in every state.
These are the U.S.’ eight Ivy League Institutions:
- Princeton University
- Yale University
- Columbia University
- Brown University
- Harvard University
- Cornell University
- Dartmouth University
- University of Pennsylvania
Beyond these prestigious academies, there are many high caliber institutions like The Ohio State University and the University of Wisconsin—both of which are land-grant universities.
Among the top 50, there are another four land-grant universities:
- University of Florida
- University of Georgia
- University of Illinois
- Cornell University
There is ripe controversy, however, surrounding land-grant universities, as, in many cases, the U.S. government funded these institutions through expropriated indigenous land.
The Cost of an American Education
U.S. college tuition is famous for being unaffordable. Combining all the federal and private loans in the country, the total student debt comes out to $1.75 trillion and the average borrower owes $28,950.
Here’s a look at how tuition breaks down on average:
The most expensive school in America is Columbia University, with the cost of admission coming out to a whopping $65,524, with some estimates showing even higher rates for the 2022/2023 academic year. The least expensive among the top 50 is the University of Florida at $6,380 for in-state tuition—more than 10x cheaper than Columbia.
But many Americans may soon see their college loans forgiven. The Biden administration’s initiative to cancel student debt will roll out any day now and will be available on federal loans for select qualifying individuals. It has the potential to provide 40 million people with as much as $20,000 in debt forgiveness.
And given that American universities make up eight of the 10 best universities in the world, perhaps the price tag will be worth it.


Education
How Hard Is It to Get Into an Ivy League School?
We detail the admission rates and average annual cost for Ivy League schools, as well as the median SAT scores required to be accepted.


How Hard Is It to Get Into an Ivy League School?
This was originally posted on our Voronoi app. Download the app for free on iOS or Android and discover incredible data-driven charts from a variety of trusted sources.
Ivy League institutions are renowned worldwide for their academic excellence and long-standing traditions. But how hard is it to get into one of the top universities in the U.S.?
In this graphic, we detail the admission rates and average annual cost for Ivy League schools, as well as the median SAT scores required to be accepted. The data comes from the National Center for Education Statistics and was compiled by 24/7 Wall St.
Note that “average annual cost” represents the net price a student pays after subtracting the average value of grants and/or scholarships received.
Harvard is the Most Selective
The SAT is a standardized test commonly used for college admissions in the United States. It’s taken by high school juniors and seniors to assess their readiness for college-level academic work.
When comparing SAT scores, Harvard and Dartmouth are among the most challenging universities to gain admission to. The median SAT scores for their students are 760 for reading and writing and 790 for math. Still, Harvard has half the admission rate (3.2%) compared to Dartmouth (6.4%).
| School | Admission rate (%) | SAT Score: Reading & Writing | SAT Score: Math | Avg Annual Cost* |
|---|---|---|---|---|
| Harvard University | 3.2 | 760 | 790 | $13,259 |
| Columbia University | 3.9 | 750 | 780 | $12,836 |
| Yale University | 4.6 | 760 | 780 | $16,341 |
| Brown University | 5.1 | 760 | 780 | $26,308 |
| Princeton University | 5.7 | 760 | 780 | $11,080 |
| Dartmouth College | 6.4 | 760 | 790 | $33,023 |
| University of Pennsylvania | 6.5 | 750 | 790 | $14,851 |
| Cornell University | 7.5 | 750 | 780 | $29,011 |
*Costs after receiving federal financial aid.
Additionally, Dartmouth has the highest average annual cost at $33,000. Princeton has the lowest at $11,100.
While student debt has surged in the United States in recent years, hitting $1.73 trillion in 2023, the worth of obtaining a degree from any of the schools listed surpasses mere academics. This is evidenced by the substantial incomes earned by former students.
Harvard grads, for example, have the highest average starting salary in the country, at $91,700.

-

 Maps2 weeks ago
Mapped: Average Wages Across Europe
-

 Money1 week ago
Which States Have the Highest Minimum Wage in America?
-

 Real Estate1 week ago
Ranked: The Most Valuable Housing Markets in America
-

 Markets1 week ago
Charted: Big Four Market Share by S&P 500 Audits
-

 AI1 week ago
The Stock Performance of U.S. Chipmakers So Far in 2024
-

 Automotive2 weeks ago
Almost Every EV Stock is Down After Q1 2024
-

 Money2 weeks ago
Where Does One U.S. Tax Dollar Go?
-

 Green2 weeks ago
Ranked: Top Countries by Total Forest Loss Since 2001