Misc
Map Explainer: The Gaza Strip
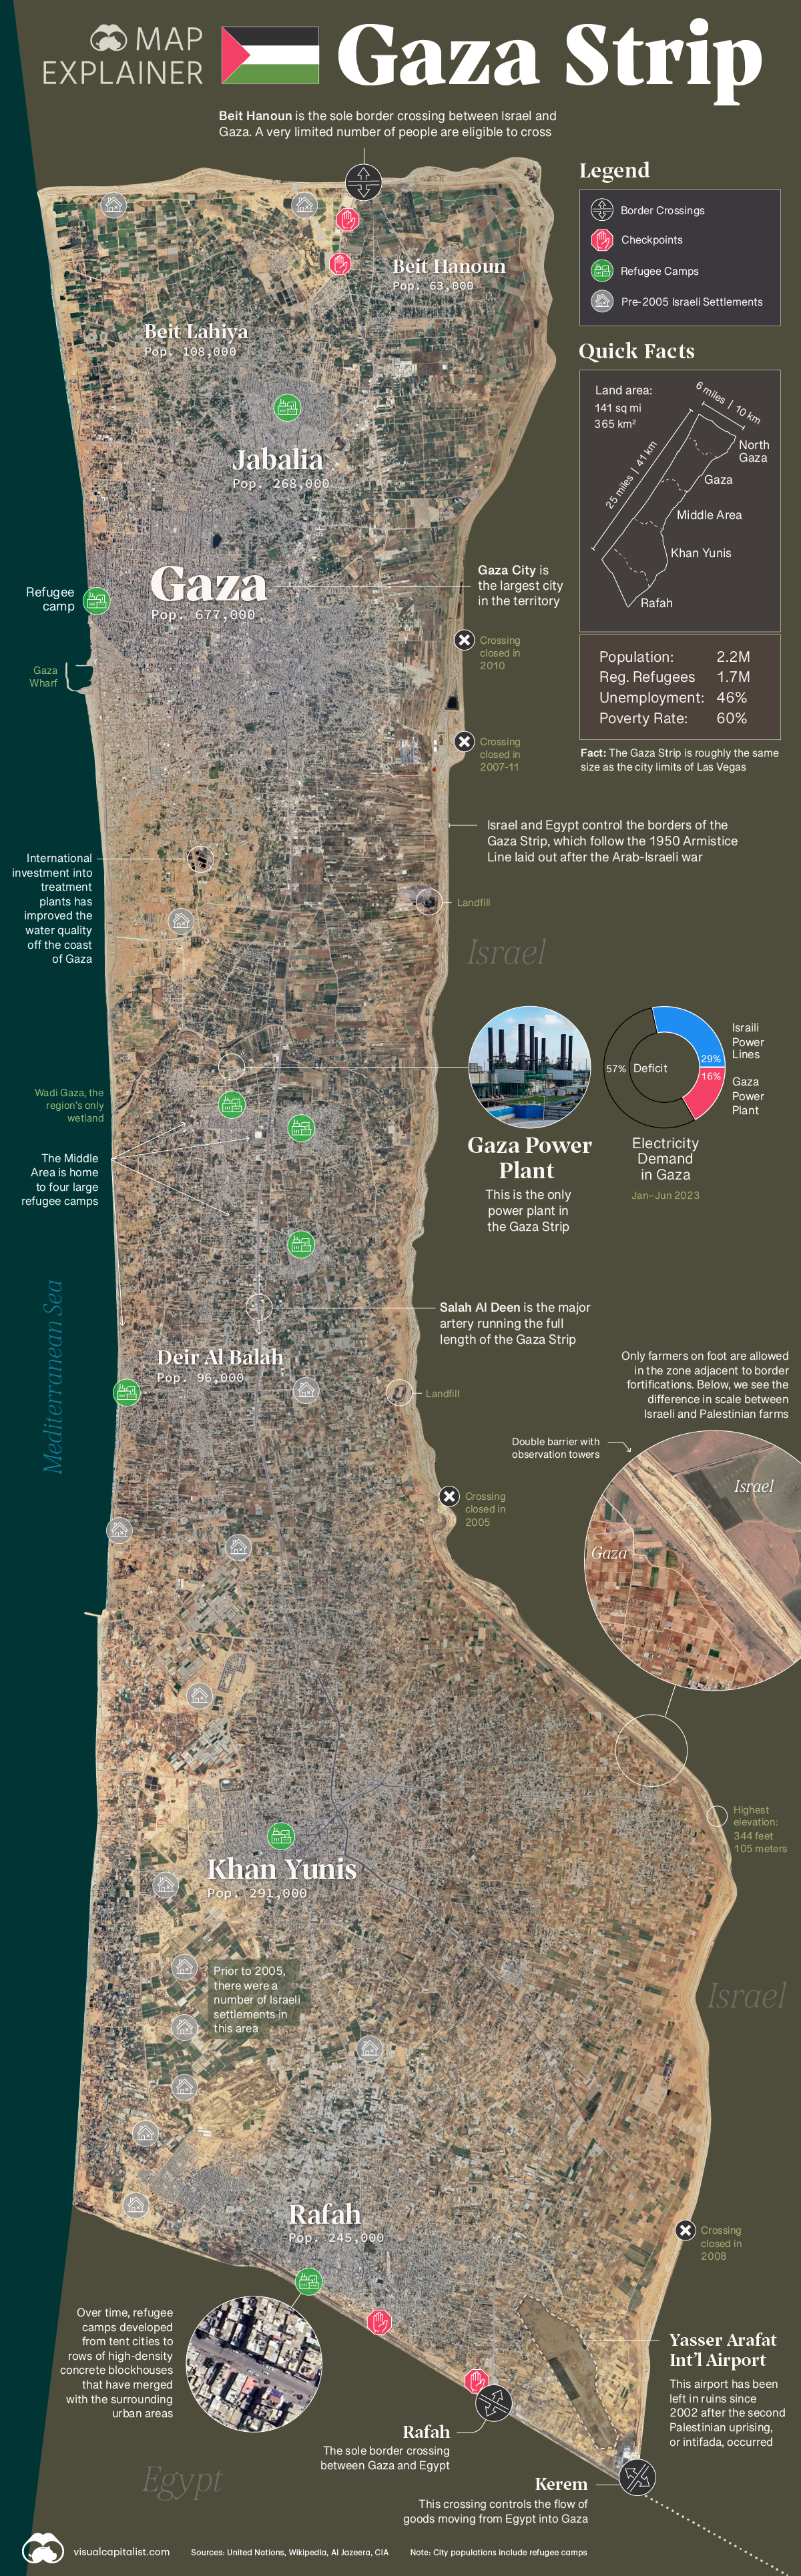


Map Explainer: The Gaza Strip
Recent attacks on Israel by Hamas have placed the Gaza Strip firmly in the spotlight of the global news cycle.
While conflict in that part of the world is thoroughly covered in headlines and news stories, more basic facts about Gaza receive less attention. With this infographic, we aim to fill in some of those gaps, including demographics, infrastructure, and more.
Below, we outline three key facts to know about the Gaza Strip and the people who live there:
1. Gaza is Young and Increasingly Crowded
Gaza has a high fertility rate (3.9), and as a result, nearly half of the people living there are children. Much of this rapidly growing population lives in crowded cities and camps that are some of the most densely populated areas in the world.
The majority of people in the Gaza Strip are officially considered refugees by the UN. Over many decades, refugee camps have become permanent settlements, blending with the surrounding urban areas. Upwards of 80% of the population relies on international aid for basic services and sustenance.
In terms of religion, Gaza is very uniform. 99% of the population are Sunni Muslims. This is similar to Egypt and other North African nations.
2. The Territory is Tightly Controlled
Israel has enforced a land, air, and sea blockade since 2007, when Hamas took control of the Gaza Strip and Israel’s Security Cabinet labeled region a “hostile entity”. The land border of Gaza Strip is heavily fortified consisting of double-wired fencing and concrete barriers. These borders follow the “Green Line”, a demarcation set after the end of the Arab–Israeli War. There is also a 100-300 meter buffer zone inside the territory’s border where access is restricted.
There are two border crossings—one into Egypt in the south and one into Israel in the north—that a limited number of civilians can cross. Over the years, border crossings on the east side of the territory have been closed down. There is an additional large scale crossing on the bottom corner of the territory that serves as a checkpoint for goods entering from Egypt.
The region’s airspace is controlled by Israel. Even its electro-magnetic space is restricted, meaning many Palestinians rely on 2G and 3G.
3. Infrastructure is Patchy
Multiple years of conflict and underinvestment have left infrastructure in shambles in much of the Gaza Strip.
For example, there is a just single diesel power plant servicing the entire region. Power lines run into Gaza from neighboring Israel, but even in non-conflict periods, the region runs a large electricity deficit.
Gaza accesses fresh water via the Coastal Aquifer—an underground water supply that is dwindling due to over-extraction—and from desalination plants. International aid efforts are improving the situation, but infrastructure remains damaged by neglect and intermittent air strikes.
Water treatment infrastructure has slowly been improving due to foreign aid, and less raw sewage is now entering the Mediterranean Sea. This clean-up effort has helped create more recreation opportunities along the territory’s beaches.


Misc
Visualizing the Most Common Pets in the U.S.
Lions, tigers, and bears, oh my!—these animals do not feature on this list of popular American household pets.


Visualizing The Most Common Pets in the U.S.
This was originally posted on our Voronoi app. Download the app for free on iOS or Android and discover incredible data-driven charts from a variety of trusted sources.
In this graphic, we visualized the most common American household pets, based on 2023-2024 data from the American Pet Products Association (accessed via Forbes Advisor).
Figures represent the number of households that own each pet type, rather than the actual number of each animal. The “small animal” category includes hamsters, gerbils, rabbits, guinea pigs, chinchillas, mice, rats, and ferrets.
What is the Most Popular American Household Pet?
Based on this data, dogs—one of the first domesticated animals—are the most common pets in the United States. In fact, around 65 million households own a dog, and spend an average of $900 a year on their care.
| Rank | Species | Households |
|---|---|---|
| 1 | 🐶 Dog | 65M |
| 2 | 🐱 Cat | 47M |
| 3 | 🐟 Freshwater Fish | 11M |
| 4 | 🐰 Small Animals | 7M |
| 5 | 🐦 Bird | 6M |
| 6 | 🦎 Reptile | 6M |
| 7 | 🐴 Horse | 2M |
| 8 | 🐠 Saltwater Fish | 2M |
Note: Households can own multiple pets, and are counted for all relevant categories.
Cats rank second, at 47 million households, and these smaller felines are a little less expensive to own at $700/year according to Forbes estimates.
But aside from these two juggernauts, there are plenty of other common pet types found in households across the country.
Freshwater fish can be found in 11 million households, along with small animals—rabbits, hamsters, guinea pigs—in 7 million. Meanwhile, nearly 6 million homes have birds or reptiles.
Pet Ownership is on the Rise in America
Forbes found that 66% of all American households (numbering 87 million) own at least one pet, up from 56% in 1988. One third of these (29 million) own multiple pets.
A combination of factors is driving this increase: rising incomes, delayed childbirth, and of course the impact of the pandemic which nearly cleared out animal shelters across the globe.
America’s loneliness epidemic may also be a factor. Fledgling research has shown that single-individual households with pets recorded lower rates of loneliness during the pandemic than those without a pet.

-

 Science1 week ago
Visualizing the Average Lifespans of Mammals
-

 Demographics2 weeks ago
The Smallest Gender Wage Gaps in OECD Countries
-

 United States2 weeks ago
Where U.S. Inflation Hit the Hardest in March 2024
-

 Green2 weeks ago
Top Countries By Forest Growth Since 2001
-

 United States2 weeks ago
Ranked: The Largest U.S. Corporations by Number of Employees
-

 Maps2 weeks ago
The Largest Earthquakes in the New York Area (1970-2024)
-

 Green2 weeks ago
Ranked: The Countries With the Most Air Pollution in 2023
-

 Green2 weeks ago
Ranking the Top 15 Countries by Carbon Tax Revenue