History
The Top News Stories of 2023, Based on Google Search Trends
![]() See this visualization first on the Voronoi app.
See this visualization first on the Voronoi app.
2023 in News Through Google Search Trends
This was originally posted on our Voronoi app. Download the app for free on Apple or Android and discover incredible data-driven charts from a variety of trusted sources.
In an age of rapid-fire social media updates, memes, and never-ending cat videos, what’s the world still collectively paying attention to?
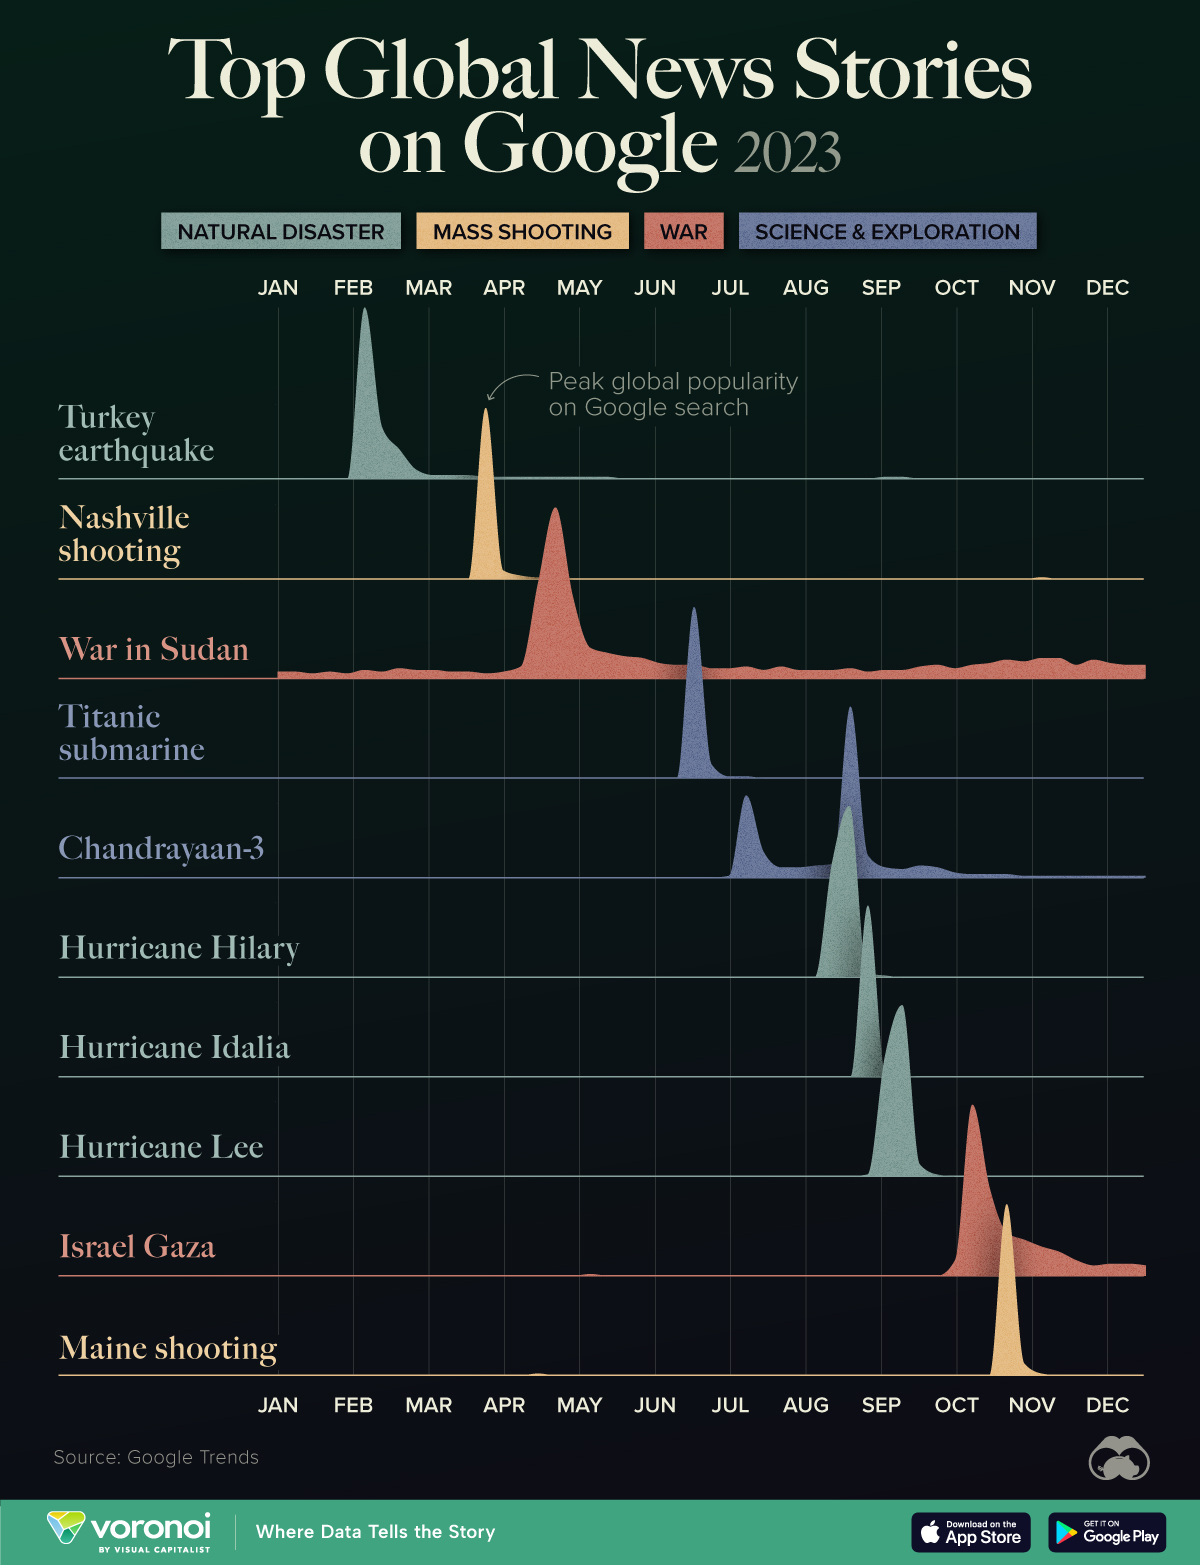
We visualize the top 10 news stories of 2023 according to Google Search trends.
Hope Amidst Disasters
In February, southern Turkey and parts of Syria suffered a deadly earthquake which killed more than 50,000 people and left more than a million without a home. Adverse weather conditions and poor infrastructure hampered rescue efforts, worsening the effects of the disaster.
While rebuilding has since begun, the scale of the project is vast: more than 300,000 buildings collapsed or were damaged beyond repair. Steadily rising inflation in the country, along with a depreciating Turkish lira, has ballooned reconstruction costs.
| News Story | Peak Search Date |
|---|---|
| Turkey Earthquake | February 5th |
| Nashville Shooting | March 26th |
| War in Sudan | April 23rd |
| Titanic Submarine | June 18th |
| Chandrayaan-3 | August 20th |
Meanwhile, an ongoing war in Sudan is being fought between opposing factions within Sudan’s military government. Millions of people are facing food insecurity, and there are widespread reports of war crimes.
On a more positive note, Google users also looked up Chandrayaan-3, India’s third lunar-exploration mission. In August 2023, India became fourth country to successfully land on the moon.
Hurricane Season and Violent Events
Another year gone by, another global temperature record broken. Rising temperatures in the Atlantic Ocean, along with the effect of El Niño, led to plenty of tropical storms in the region, of which the World Meteorological Organization named 20.
Of them, Hurricane Idalia caused widespread damage in Florida, and Hurricane Lee resulted in prolonged power outages in Maine, Nova Scotia, and New Brunswick.
On the Pacific side, Hurricane Hilary brought torrential rain and flooding to parts of Mexico and the southwestern U.S.
| News Story | Peak Search Date |
|---|---|
| Hurricane Hilary | August 20th |
| Hurricane Idalia | August 27th |
| Hurricane Lee | September 10th |
| Israel/Gaza | Ocotber 8th |
| Maine Shooting | October 22nd |
Finally, the Israel-Hamas war has led to more than 15,000 deaths in Palestine and 1,500 fatalities in Israel.
On December 22nd, the UN Security Council passed a resolution “calling for humanitarian pauses” in the fighting and increased aid to Gaza. An earlier resolution (which called for an immediate ceasefire) failed after being vetoed by the United States.
Meanwhile, a proposed peace plan by Egypt (which helped architect an earlier six-day temporary ceasefire) has not been well received, though neither the Netanyahu government, nor Hamas has outright rejected it.


population
Vintage Viz: World Cities With 1 Million Residents (1800–1930)
From someone born in the 19th century, in the midst of historic population growth, comes this vintage visualization showing world cities growing ever bigger.
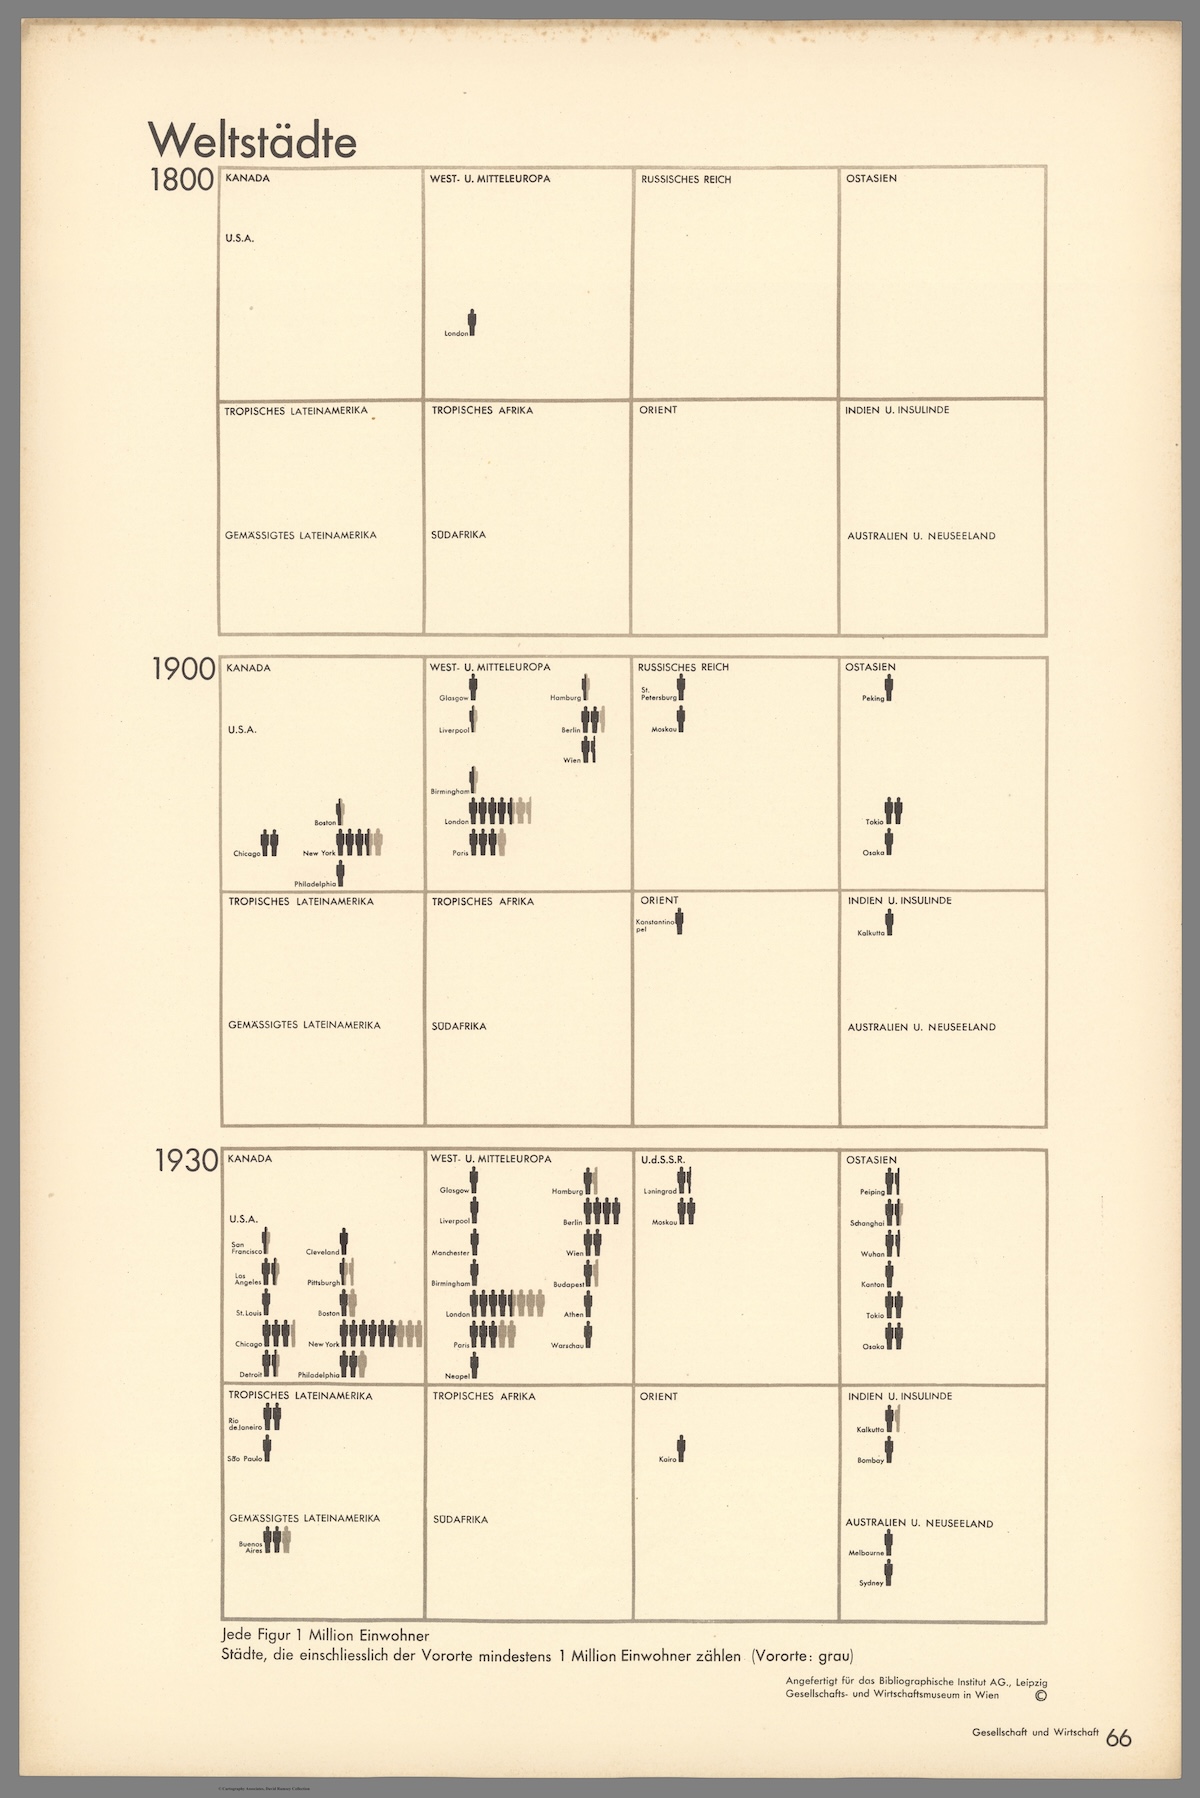
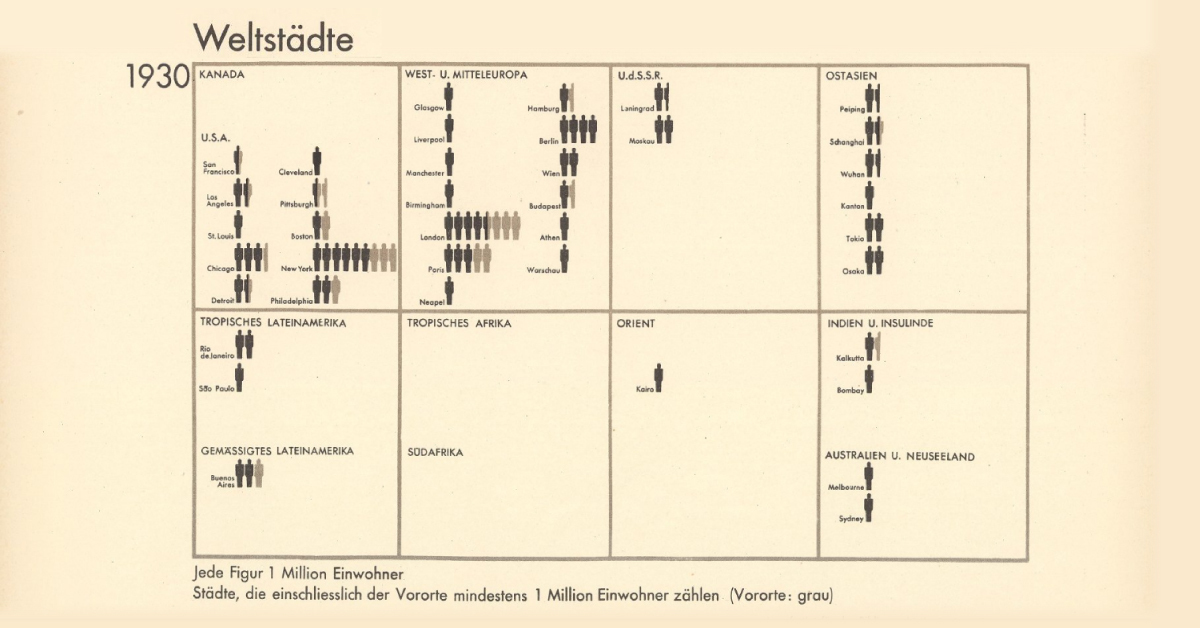
World Cities With At Least 1 Million Residents (1800–1930)
This chart is the latest in our Vintage Viz series, which presents historical visualizations along with the context needed to understand them.
The explosive world population boom in the last 300 years is common knowledge today. Much and more has been written about how and why it happened, why it was unusual, and how the specter of a declining population for the first time in three centuries could impact human society.
However, equally compelling, is how people in the past—those living in the midst of the early waves of this boom—were fascinated by what they were witnessing.
Evidence of this comes from today’s vintage visualization, denoting the increasing number of world cities with at least one million inhabitants through the years.
The above pictogram was made by Austrian philosopher and sociologist Otto Neurath (1882–1945), found in his book, Society and Economy, published in 1930.
World Population Doubles Between 1800 and 1930
In 1800, the world population crossed 1 billion for the first time ever.
In the next 130 years, it doubled past 2 billion.
The Second Agricultural Revolution, characterized by massive land and labor productivity, grew agricultural output more than the population and is one of the key drivers of this population growth.
And in the pictogram above, where one silhouette indicates one million inhabitants, this exponential population growth becomes far more vivid.
In 1800, for example, according to the creator’s estimates, only London had at least million residents. A century later, 15 cities now boasted of the same number. Then, three decades hence, 37 cities across the world had one million inhabitants.
| Year | Cities with One Million Residents |
|---|---|
| 1800 | 1 |
| 1900 | 15 |
| 1930 | 37 |
Importantly, the data above is based on the creator’s estimates from a century ago, and does not include Beijing (then referred to as Peking in English) in 1800. Historians now agree that the city had more than a million residents, and was the largest city in the world at the time.
Another phenomenon becoming increasingly apparent is growing urbanization—food surplus frees up large sections of the population from agriculture, driving specialization in other skills and trade, in turn leading to congregations in urban centers.
Other visualizations in the same book covered migration, Indigenous peoples, labor, religion, trade, and natural resources, reflecting the creator’s interest in the social life of individuals and their well-being.
Who Was Otto Neurath and What is His Legacy?
This vintage visualization might seem incredibly simple, simplistic even, considering how we map out population data today. But the creator Otto Neurath, and his wife Marie, were pioneers in the field of visual communication.
One of their notable achievements was the creation of the Vienna Method of pictorial statistics, which aimed to represent statistical information in a visually accessible way—the forerunner to modern-day infographics.
The Neuraths believed in using clear and simple visual language to convey complex information to a broad audience, an approach that laid the foundation for modern information design.
They fled Austria during the rise of the Nazi regime and spent their later years in various countries, including the UK. Otto Neurath’s influence on graphic design, visual communication, and the philosophy of language has endured, and his legacy is still recognized in these fields today.

-

 Debt1 week ago
How Debt-to-GDP Ratios Have Changed Since 2000
-

 Countries2 weeks ago
Population Projections: The World’s 6 Largest Countries in 2075
-

 Markets2 weeks ago
The Top 10 States by Real GDP Growth in 2023
-

 Demographics2 weeks ago
The Smallest Gender Wage Gaps in OECD Countries
-

 Economy2 weeks ago
Where U.S. Inflation Hit the Hardest in March 2024
-

 Green2 weeks ago
Top Countries By Forest Growth Since 2001
-

 United States2 weeks ago
Ranked: The Largest U.S. Corporations by Number of Employees
-

 Maps2 weeks ago
The Largest Earthquakes in the New York Area (1970-2024)