Maps
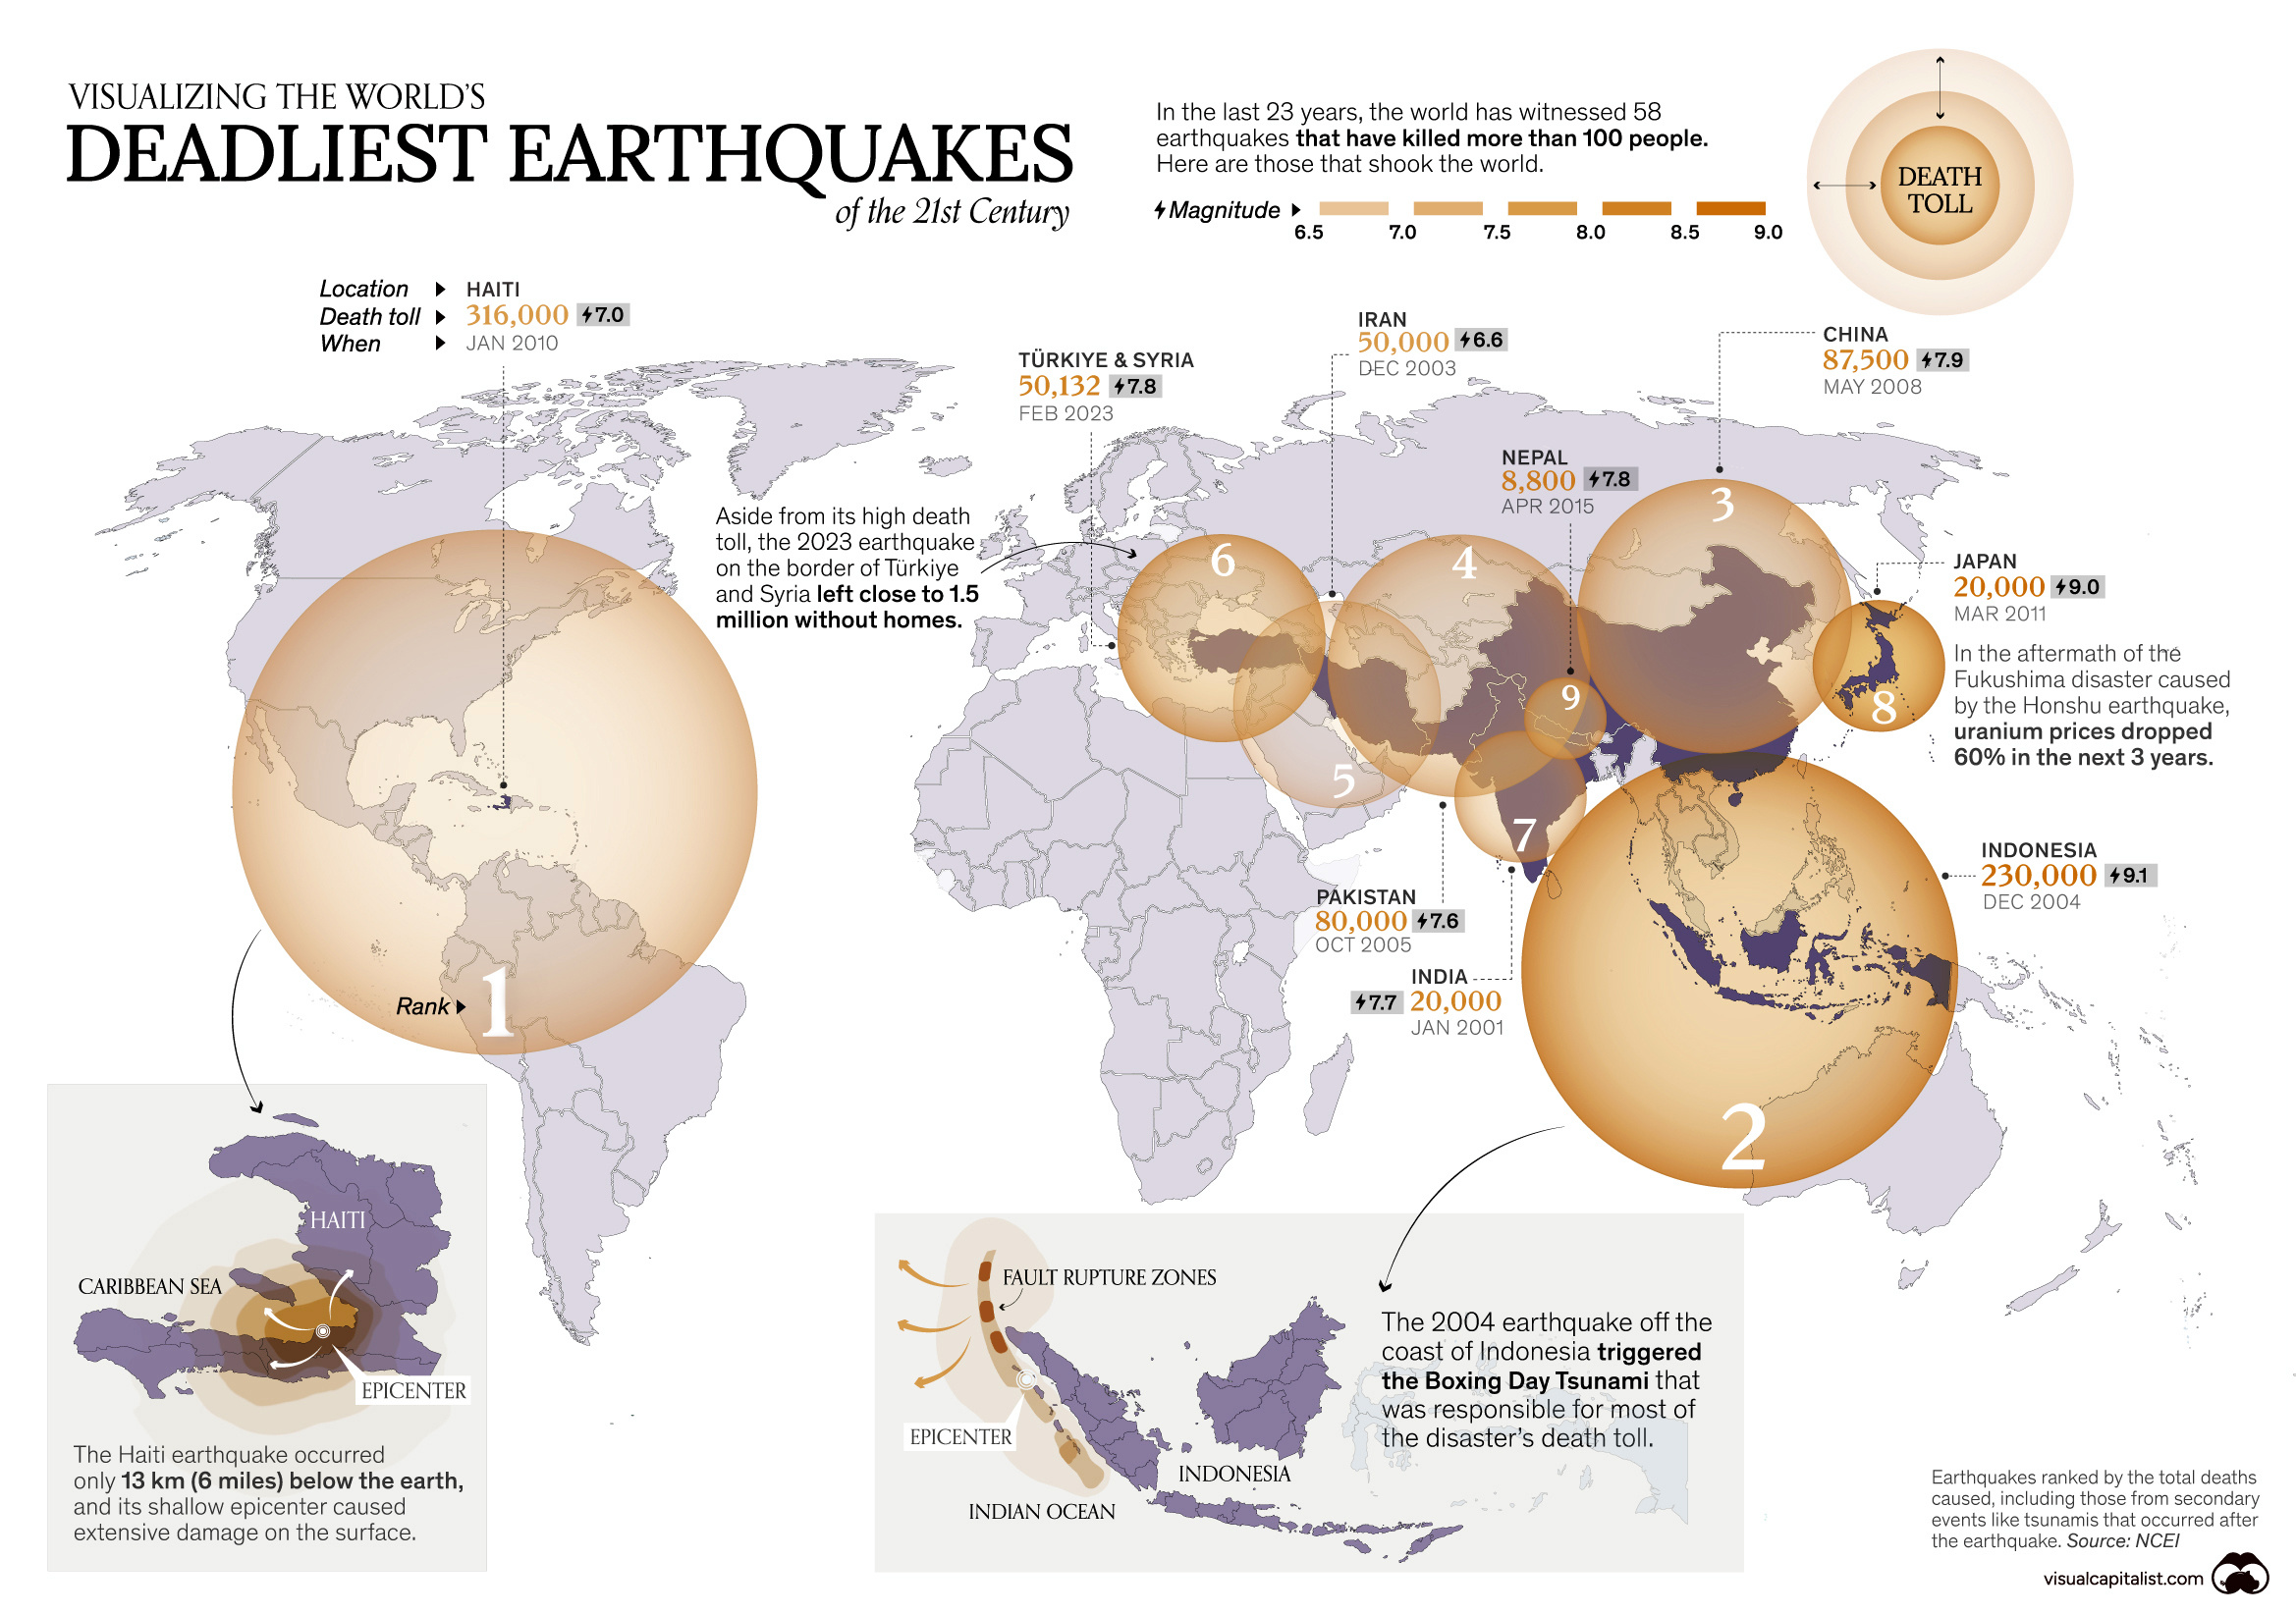
Mapped: The Deadliest Earthquakes of the 21st Century
View the full-size earthquake map
Mapped: The Deadliest Earthquakes of the 21st Century
On September 8, 2023, a powerful earthquake rocked Morocco. With its epicenter located in the Atlas Mountains and structural damage being done to the historical city center of Marrakesh, the 6.8-magnitude quake will likely have a death toll in the thousands.
With these recent events in mind, we use data from the National Centers for Environment Information (NCES) to map out the epicenters of the nine deadliest earthquakes in the 21st century so far, by their total death toll. This includes casualties from secondary events—like tsunamis—after each earthquake.
Earthquakes By Death Toll (2000–2023)
We delve into some of the deadliest earthquakes in recent history.
Haiti, 2010
On January 12th, 2010, a 7.0 magnitude earthquake hit the capital Port-au-Prince. The earthquake’s shallow epicenter—only six miles beneath the surface—caused most of the force to be directed close to where people lived. By the end of the month, after 52 aftershocks rocked the island, the disaster had claimed more than 300,000 lives—the deadliest earthquake in the 21st century thus far.
The extensive destruction led to global support, but slow recovery sparked criticism of government inaction. In 2017, the UN reported 2.5 million Haitians still required aid.
Indonesia, 2004
December 26th, 2004: A 9.1 earthquake occurred off the coast of Indonesia, deep under the ocean. It was the strongest earthquake in this century and the third-most powerful since 1900.
It triggered the worst tsunami recorded in history, causing 230,000 deaths mainly in Indonesia, Sri Lanka, Thailand, and India.
Here’s a list of the deadliest earthquakes, by death toll, in the 21st century.
| Rank | Date | Location | Total Deaths | Magnitude |
|---|---|---|---|---|
| 1 | Jan, 2010 | 🇭🇹 Haiti | 316,000 | 7.0 |
| 2 | Dec, 2004 | 🇮🇩 Indonesia | 227,899 | 9.1 |
| 3 | May, 2008 | 🇨🇳 China | 87,652 | 7.9 |
| 4 | Oct, 2005 | 🇵🇰 Pakistan | 76,213 | 7.6 |
| 5 | Feb, 2023 | 🇹🇷 Türkiye | 56,697 | 7.8 |
| 6 | Dec, 2003 | 🇮🇷 Iran | 31,000 | 6.6 |
| 7 | Jan, 2001 | 🇮🇳 India | 20,005 | 7.6 |
| 8 | March, 2011 | 🇯🇵 Japan | 18,428 | 9.1 |
| 9 | April, 2015 | 🇳🇵 Nepal | 8,957 | 7.8 |
| 10 | May, 2006 | 🇮🇩 Indonesia | 5,749 | 6.3 |
| 11 | Sep, 2018 | 🇮🇩 Indonesia | 4,340 | 7.5 |
| 12 | May, 2003 | 🇩🇿 Algeria | 2,287 | 6.8 |
| 13 | Aug, 2021 | 🇭🇹 Haiti | 2,248 | 7.2 |
| 14 | April, 2010 | 🇨🇳 China | 2,220 | 6.9 |
| 15 | March, 2005 | 🇮🇩 Indonesia | 1,313 | 8.6 |
| 16 | Sep, 2009 | 🇮🇩 Indonesia | 1,117 | 7.5 |
| 17 | June, 2022 | 🇦🇫 Afghanistan | 1,039 | 5.9 |
| 18 | March, 2002 | 🇦🇫 Afghanistan | 1,000 | 6.1 |
| 19 | Jan, 2001 | 🇸🇻 El Salvador | 844 | 7.7 |
| 20 | Sep, 2013 | 🇵🇰 Pakistan | 825 | 7.7 |
| 21 | July, 2006 | 🇮🇩 Indonesia | 802 | 7.7 |
| 22 | April, 2016 | 🇪🇨 Ecuador | 663 | 7.8 |
| 23 | Nov, 2022 | 🇮🇩 Indonesia | 635 | 5.6 |
| 24 | Nov, 2017 | 🇮🇷 Iran | 630 | 7.3 |
| 25 | Feb, 2004 | 🇲🇦 Morocco | 628 | 6.4 |
| 26 | Aug, 2014 | 🇨🇳 China | 615 | 6.2 |
| 27 | Feb, 2005 | 🇮🇷 Iran | 612 | 6.4 |
| 28 | Oct, 2011 | 🇹🇷 Turkey | 604 | 7.1 |
| 29 | Aug, 2018 | 🇮🇩 Indonesia | 560 | 6.9 |
| 30 | Feb, 2010 | 🇨🇱 Chile | 558 | 8.8 |
| 31 | Aug, 2007 | 🇵🇪 Peru | 514 | 8.0 |
| 32 | Oct, 2010 | 🇮🇩 Indonesia | 431 | 7.8 |
| 33 | Oct, 2015 | 🇦🇫 Afghanistan | 399 | 7.5 |
| 34 | Sep, 2017 | 🇲🇽 Mexico | 369 | 7.1 |
| 35 | Feb, 2001 | 🇸🇻 El Salvador | 315 | 6.6 |
| 36 | April, 2009 | 🇮🇹 Italy | 309 | 6.3 |
| 37 | Aug, 2012 | 🇮🇷 Iran | 306 | 6.5 |
| 38 | Aug, 2016 | 🇮🇹 Italy | 299 | 6.2 |
| 39 | June, 2002 | 🇮🇷 Iran | 261 | 6.5 |
| 40 | Feb, 2003 | 🇨🇳 China | 261 | 6.3 |
| 41 | Oct, 2013 | 🇵🇭 Philippines | 222 | 7.1 |
| 42 | Oct, 2008 | 🇵🇰 Pakistan | 215 | 6.4 |
| 43 | April, 2013 | 🇨🇳 China | 196 | 6.6 |
| 44 | Sep, 2009 | 🇼🇸 Samoa Islands | 192 | 8.1 |
| 45 | Feb, 2011 | 🇳🇿 New Zealand | 185 | 6.1 |
| 46 | May, 2003 | 🇹🇷 Turkey | 177 | 6.4 |
| 47 | March, 2002 | 🇦🇫 Afghanistan | 166 | 7.4 |
| 48 | Feb, 2018 | 🇵🇬 Papua New Guinea | 145 | 7.5 |
| 49 | Oct, 2020 | 🇬🇷 Greece | 118 | 7.0 |
| 50 | Sep, 2022 | 🇨🇳 China | 118 | 6.6 |
| 51 | May, 2015 | 🇳🇵 Nepal | 117 | 7.3 |
| 52 | Feb, 2016 | 🇹🇼 Taiwan | 117 | 6.4 |
| 53 | Sep, 2011 | 🇮🇳 India | 111 | 6.9 |
| 54 | Jan, 2021 | 🇮🇩 Indonesia | 105 | 6.2 |
| 55 | March, 2011 | 🇲🇲 Myanmar | 104 | 6.8 |
| 56 | Dec, 2016 | 🇮🇩 Indonesia | 104 | 6.5 |
| 57 | June, 2000 | 🇮🇩 Indonesia | 103 | 7.9 |
| 58 | June, 2001 | 🇵🇪 Peru | 103 | 8.4 |
Türkiye and Syria, 2023
February 6, 2023: Two earthquakes, also with shallow epicenters (5 miles deep), hit the border region between Türkiye and Syria, causing widespread damage in both countries and claiming more than 50,000 lives. Bad weather conditions—including snow, ice, and winter storms—inhibited search and rescue efforts.
In Syria, international sanctions prevented foreign charities and families from sending money to the country, which led to the U.S. suspending the sanctions for 180 days.
Japan, 2011
March 11, 2011: Another undersea earthquake—also 9.1 magnitude—occurred off the coast of Japan, triggering a deadly tsunami which flattened parts of the country 30 minutes later.
The high waves also damaged Fukushima’s Nuclear Plant’s emergency diesel generators leading to reactor meltdowns, and a release of radioactive waste. In total, 18,000 people lost their lives from the earthquake and tsunami.
How Does Earthquake Data Help With Disaster Preparedness?
Thanks to the study of plate tectonics, scientists know where earthquakes usually occur, even if they don’t know when precisely. For example countries along the “Ring of Fire”—a hotbed of earthquake and volcanic activity—witness hundreds of earthquakes a year, though most are not strong enough to cause any damage.
However, with deadly earthquakes, other factors, including epicenter depth, location near populous areas, and proximity to secondary events—tsunamis—can play a far bigger role in death tolls.
Disaster preparedness and swift government action can mitigate many secondary casualties as seen comparing the vastly different death tolls of the 2004 and 2011 tsunamis.


Maps
The Largest Earthquakes in the New York Area (1970-2024)
The earthquake that shook buildings across New York in April 2024 was the third-largest quake in the Northeast U.S. over the past 50 years.


The Largest Earthquakes in the New York Area
This was originally posted on our Voronoi app. Download the app for free on Apple or Android and discover incredible data-driven charts from a variety of trusted sources.
The 4.8 magnitude earthquake that shook buildings across New York on Friday, April 5th, 2024 was the third-largest quake in the U.S. Northeast area over the past 50 years.
In this map, we illustrate earthquakes with a magnitude of 4.0 or greater recorded in the Northeastern U.S. since 1970, according to the United States Geological Survey (USGS).
Shallow Quakes and Older Buildings
The earthquake that struck the U.S. Northeast in April 2024 was felt by millions of people from Washington, D.C., to north of Boston. It even caused a full ground stop at Newark Airport.
The quake, occurring just 5 km beneath the Earth’s surface, was considered shallow, which is what contributed to more intense shaking at the surface.
According to the USGS, rocks in the eastern U.S. are significantly older, denser, and harder than those on the western side, compressed by time. This makes them more efficient conduits for seismic energy. Additionally, buildings in the Northeast tend to be older and may not adhere to the latest earthquake codes.
Despite disrupting work and school life, the earthquake was considered minor, according to the Michigan Technological University magnitude scale:
| Magnitude | Earthquake Effects | Estimated Number Each Year |
|---|---|---|
| 2.5 or less | Usually not felt, but can be recorded by seismograph. | Millions |
| 2.5 to 5.4 | Often felt, but only causes minor damage. | 500,000 |
| 5.5 to 6.0 | Slight damage to buildings and other structures. | 350 |
| 6.1 to 6.9 | May cause a lot of damage in very populated areas. | 100 |
| 7.0 to 7.9 | Major earthquake. Serious damage. | 10-15 |
| 8.0 or greater | Great earthquake. Can totally destroy communities near the epicenter. | One every year or two |
The largest earthquake felt in the area over the past 50 years was a 5.3 magnitude quake that occurred in Au Sable Forks, New York, in 2002. It damaged houses and cracked roads in a remote corner of the Adirondack Mountains, but caused no injuries.
| Date | Magnitude | Location | State |
|---|---|---|---|
| April 20, 2002 | 5.3 | Au Sable Forks | New York |
| October 7, 1983 | 5.1 | Newcomb | New York |
| April 5, 2024 | 4.8 | Whitehouse Station | New Jersey |
| October 16, 2012 | 4.7 | Hollis Center | Maine |
| January 16, 1994 | 4.6 | Sinking Spring | Pennsylvania |
| January 19, 1982 | 4.5 | Sanbornton | New Hampshire |
| September 25, 1998 | 4.5 | Adamsville | Pennsylvania |
| June 9, 1975 | 4.2 | Altona | New York |
| May 29, 1983 | 4.2 | Peru | Maine |
| April 23, 1984 | 4.2 | Conestoga | Pennsylvania |
| January 16, 1994 | 4.2 | Sinking Spring | Pennsylvania |
| November 3, 1975 | 4 | Long Lake | New York |
| June 17, 1991 | 4 | Worcester | New York |
The largest earthquake in U.S. history, however, was the 1964 Good Friday quake in Alaska, measuring 9.2 magnitude and killing 131 people.

-

 Science1 week ago
Visualizing the Average Lifespans of Mammals
-

 Markets2 weeks ago
The Top 10 States by Real GDP Growth in 2023
-

 Demographics2 weeks ago
The Smallest Gender Wage Gaps in OECD Countries
-

 United States2 weeks ago
Where U.S. Inflation Hit the Hardest in March 2024
-

 Green2 weeks ago
Top Countries By Forest Growth Since 2001
-

 United States2 weeks ago
Ranked: The Largest U.S. Corporations by Number of Employees
-

 Maps2 weeks ago
The Largest Earthquakes in the New York Area (1970-2024)
-

 Green2 weeks ago
Ranked: The Countries With the Most Air Pollution in 2023