Green
Hotter Than Ever: 2023 Sets New Global Temperature Records


Charting Record-Breaking Monthly Global Temperatures
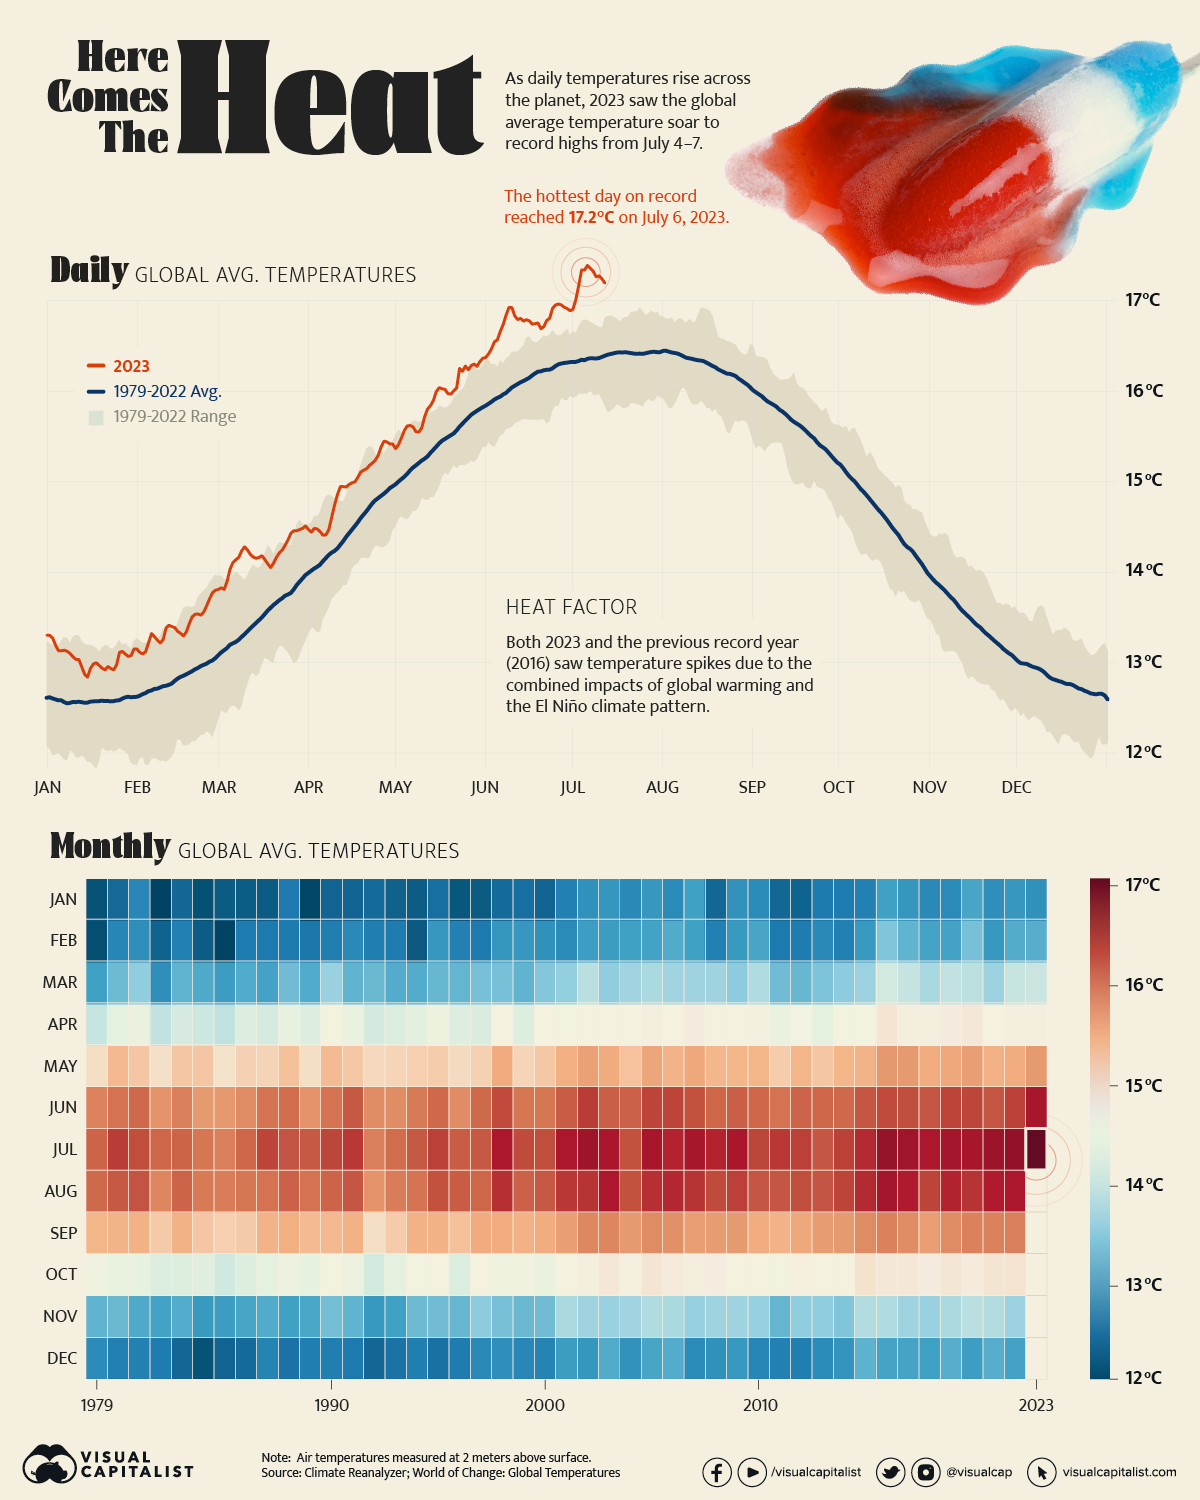
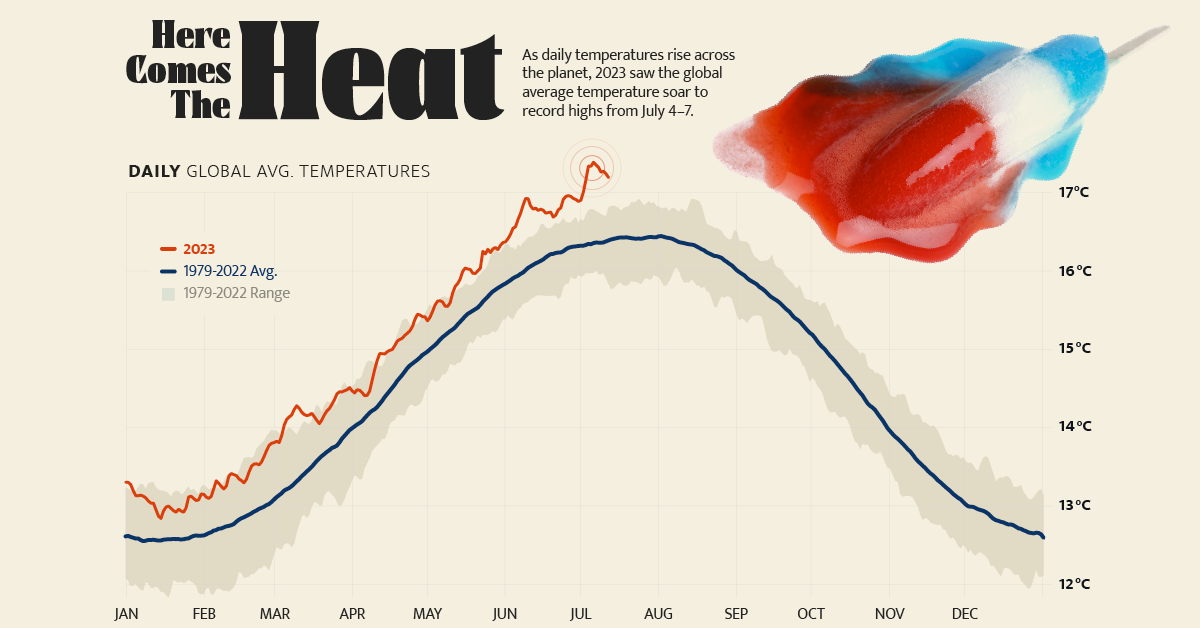
As local heat records are being broken across the planet, July 2023 also saw the global average temperature soar to an unprecedented 17.2°C (62.9°F).
In fact, according to the U.S. National Oceanic and Atmospheric Administration (NOAA), the four hottest days on record occurred from July 4 to July 7, 2023, breaking the previous record of 16.9°C (62.4°F) set in mid-August 2016.
The above graphic charts the average air temperature at 2 meters above the surface, since 1979, using data from Climate Reanalyzer.
What is Causing Record High Temperatures?
Temperature records were shattered in both 2023 and 2016 as a result of the dual impact of the El Niño climate phenomenon, which causes a significant rise in Pacific Ocean temperatures, and climate change.
Earth’s average global temperature has risen by at least 1.1°C (1.9°F) since 1880, and the pace has significantly increased in the last century alongside the burning of fossil fuels. The majority of the warming has occurred since 1975, with temperatures rising 0.15 to 0.20°C per decade.
According to the NOAA, six of the most recent months of July (typically the hottest month) were among the seven hottest months recorded by average global surface temperature:
| Rank | Hottest Months by Avg. Temp. | Celsius (°C) |
|---|---|---|
| 1 | July 2023* | 17.07°C |
| 2 | July 2022 | 16.75°C |
| 3 | July 2016 | 16.72°C |
| 4 | July 2021 | 16.70°C |
| 5 | July 2002 | 16.67°C |
| 6 | July 2017 | 16.66°C |
| 7 | July 2019 | 16.64°C |
*As of July 12, 2023
Although these figures show marginal increases in the world’s average temperatures, the effects are far more noticeable on a local scale.
In July 2023, temperatures in Texas surpassed those of Northern Africa, as they reached 43.3°C (110°F). Across the Pacific, cities around China used bomb shelters as cooling centers during a 10-day streak of days above 35°C (95°F).
“We are in uncharted territory and we can expect more records to fall as El Niño develops further and these impacts will extend into 2024,”
– Christopher Hewitt, World Meteorological Organization
How to Mitigate Climate Change?
Transitioning to renewable energy sources, reducing or capturing greenhouse gas emissions, and implementing sustainable practices are considered key steps towards slowing climate change.
According to NASA, the future will also require adaptation, reducing our risks from the harmful effects of climate change (such as sea-level rise, more intense extreme weather events, or food insecurity) as well as taking advantage of any potential positive opportunities associated with climate change (such as longer growing seasons and higher yields in some regions).


Green
The Carbon Footprint of Major Travel Methods
Going on a cruise ship and flying domestically are the most carbon-intensive travel methods.


The Carbon Footprint of Major Travel Methods
This was originally posted on our Voronoi app. Download the app for free on iOS or Android and discover incredible data-driven charts from a variety of trusted sources.
Did you know that transport accounts for nearly one-quarter of global energy-related carbon dioxide (CO₂) emissions?
This graphic illustrates the carbon footprints of major travel methods measured in grams of carbon dioxide equivalent (CO₂e) emitted per person to travel one kilometer. This includes both CO₂ and other greenhouse gases.
Data is sourced from Our World in Data, the UK Government’s Department for Energy Security and Net Zero, and The International Council on Clean Transportation, as of December 2022.
These figures should be interpreted as approximations, rather than exact numbers. There are many variables at play that determine the actual carbon footprint in any individual case, including vehicle type or model, occupancy, energy mix, and even weather.
Cruise Ships are the Most Carbon-Intensive Travel Method
According to these estimates, taking a cruise ship, flying domestically, and driving alone are some of the most carbon-intensive travel methods.
Cruise ships typically use heavy fuel oil, which is high in carbon content. The average cruise ship weighs between 70,000 to 180,000 metric tons, meaning they require large engines to get moving.
These massive vessels must also generate power for onboard amenities such as lighting, air conditioning, and entertainment systems.
Short-haul flights are also considered carbon-intensive due to the significant amount of fuel consumed during initial takeoff and climbing altitude, relative to a lower amount of cruising.
| Transportation method | CO₂ equivalent emissions per passenger km |
|---|---|
| Cruise Ship | 250 |
| Short-haul flight (i.e. within a U.S. state or European country) | 246 |
| Diesel car | 171 |
| Gas car | 170 |
| Medium-haul flight (i.e. international travel within Europe, or between U.S. states) | 151 |
| Long-haul flight (over 3,700 km, about the distance from LA to NY) | 147 |
| Motorbike | 113 |
| Bus (average) | 96 |
| Plug-in hybrid | 68 |
| Electric car | 47 |
| National rail | 35 |
| Tram | 28 |
| London Underground | 27 |
| Ferry (foot passenger) | 19 |
| Eurostar (International rail) | 4.5 |
Are EVs Greener?
Many experts agree that EVs produce a lower carbon footprint over time versus traditional internal combustion engine (ICE) vehicles.
However, the batteries in electric vehicles charge on the power that comes straight off the electrical grid—which in many places may be powered by fossil fuels. For that reason, the carbon footprint of an EV will depend largely on the blend of electricity sources used for charging.
There are also questions about how energy-intensive it is to build EVs compared to a comparable ICE vehicle.

-

 Science7 days ago
Visualizing the Average Lifespans of Mammals
-

 Markets2 weeks ago
The Top 10 States by Real GDP Growth in 2023
-

 Demographics2 weeks ago
The Smallest Gender Wage Gaps in OECD Countries
-

 United States2 weeks ago
Where U.S. Inflation Hit the Hardest in March 2024
-

 Green2 weeks ago
Top Countries By Forest Growth Since 2001
-

 United States2 weeks ago
Ranked: The Largest U.S. Corporations by Number of Employees
-

 Maps2 weeks ago
The Largest Earthquakes in the New York Area (1970-2024)
-

 Green2 weeks ago
Ranked: The Countries With the Most Air Pollution in 2023