Misc
Ranked: Median Student Debt for a U.S. College Degree
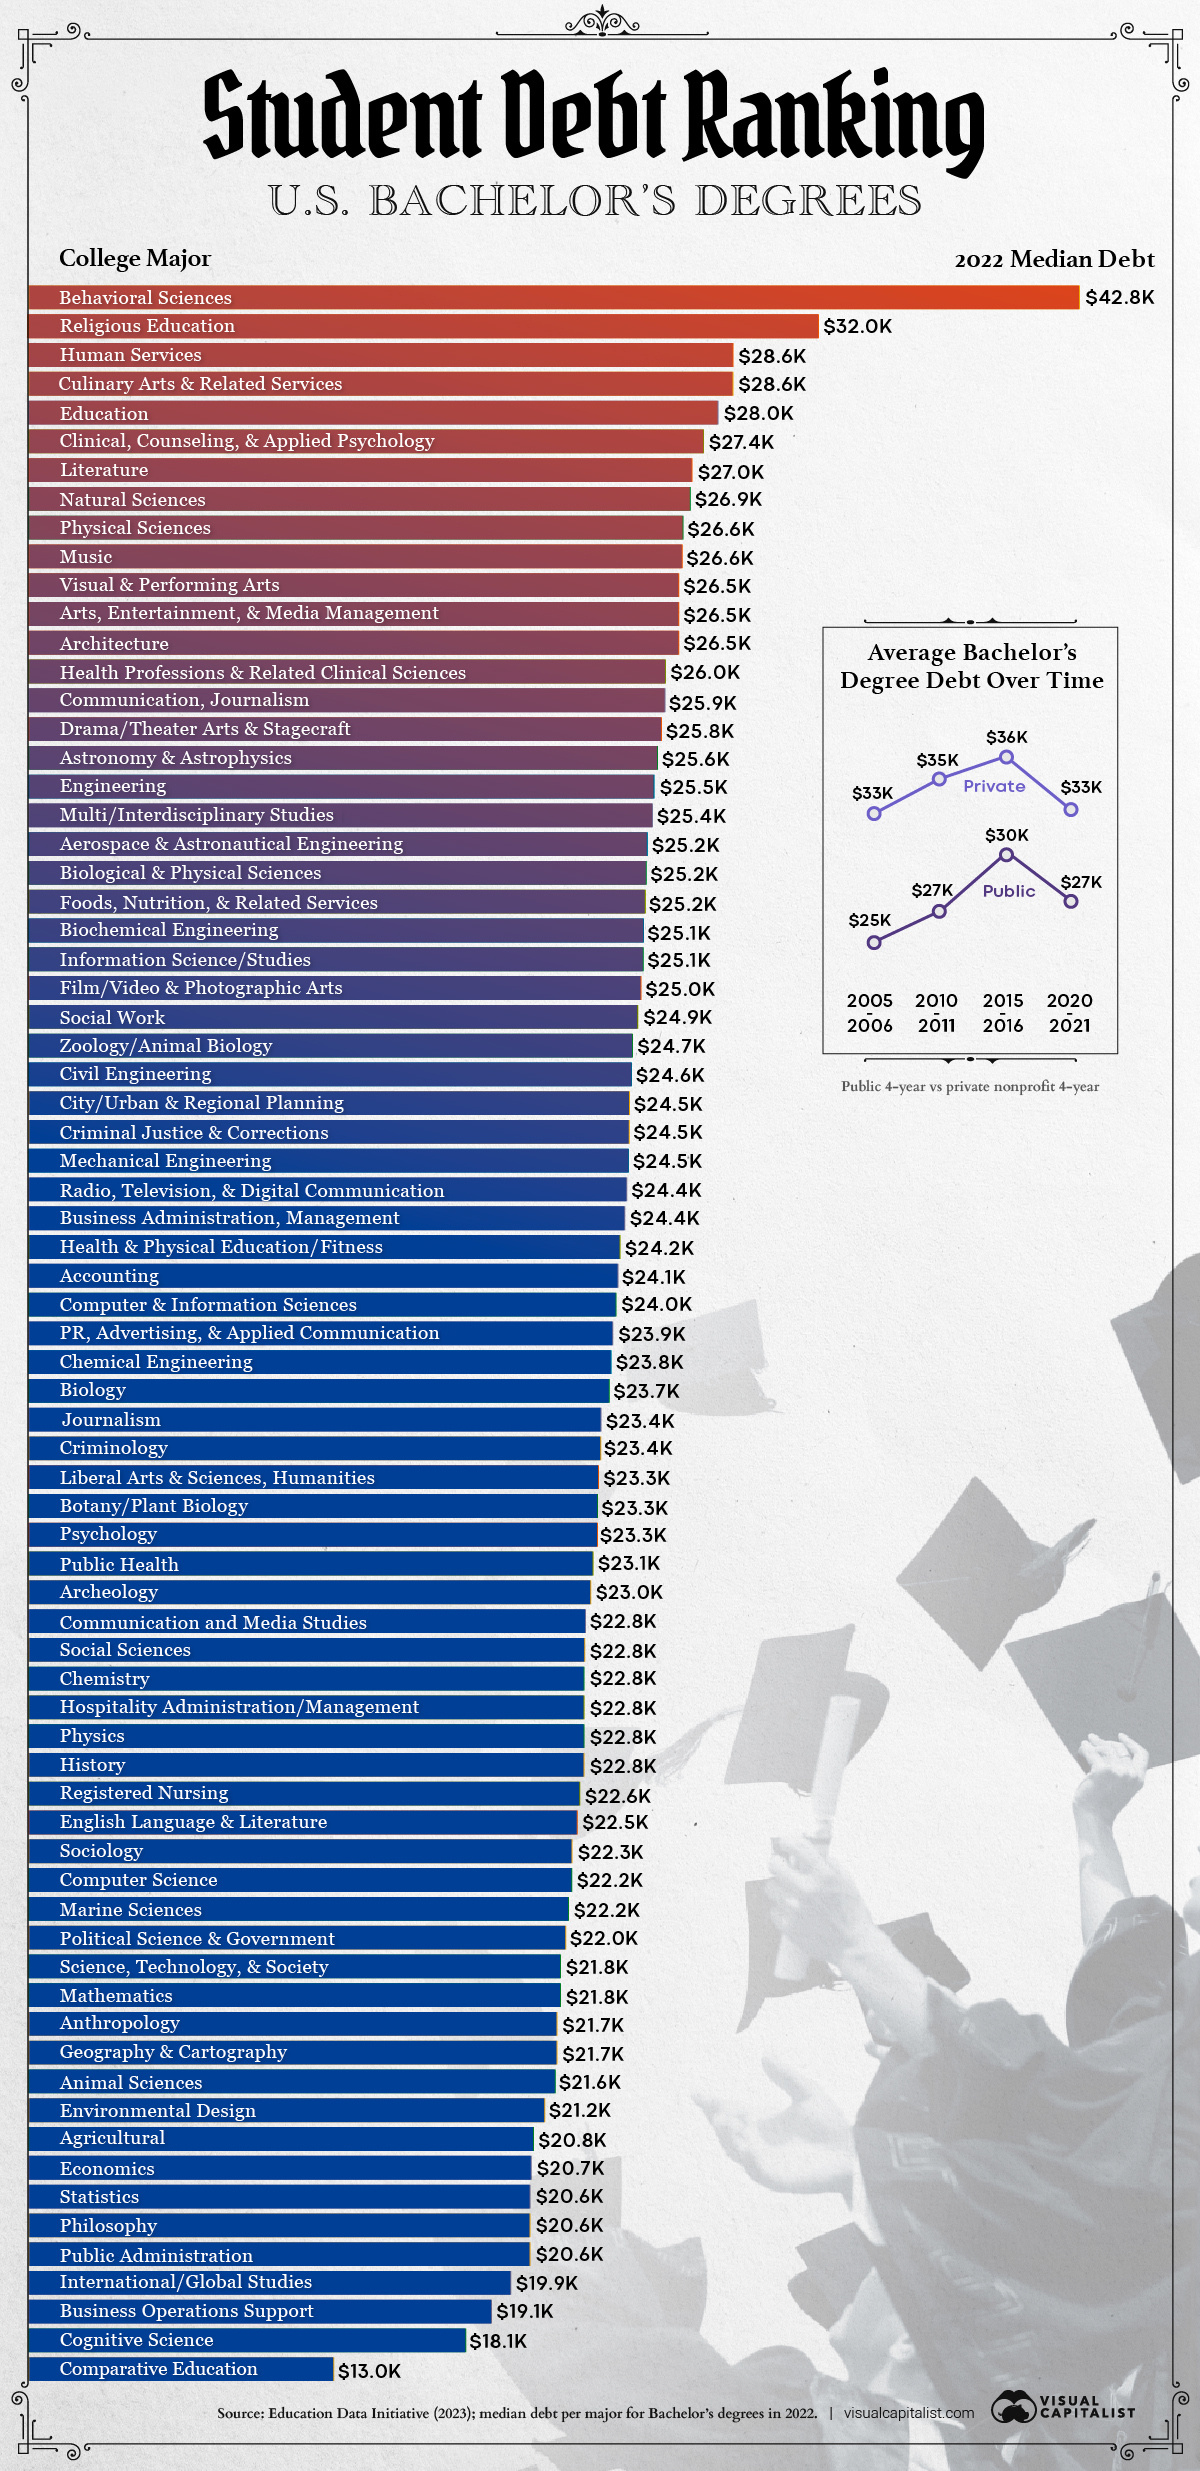
Student Debt Ranking: U.S. College Degrees
According to the Federal Reserve, student loans added up to $1.6 trillion in Q2 2023, making them the third largest category of U.S. household debt behind auto loans ($1.8 trillion) and mortgages ($12 trillion).
The current student debt figure represents a 40% increase from a decade ago, resulting in greater pressure for the federal government to do more to help debtors. For example, on Oct 4. 2023, the Biden administration announced an additional $9 billion in student debt cancellations, bringing the total relief amount to $127 billion.
With student debt becoming a broader social issue, we’ve visualized data from the Education Data Initiative to show you the median debt per major for a bachelor’s degree in the country.
Dataset and Highlights
The following table includes all of the data we used to create this graphic. Note that we’re showing median student debt, which differs from the mean average.
To understand how this works, imagine a list of every student’s debt for a given major. The median represents the middle value, meaning half of students owe less than that amount, while the other half owes more.
| Major | Field of Study | 2022 Median Debt (USD thousands) |
|---|---|---|
| Behavioral Sciences | Social Sciences | $42.8 |
| Religious Education | Arts and Humanities | $32.0 |
| Culinary Arts and Related Services | Arts and Humanities | $28.6 |
| Human Services | Social Sciences | $28.6 |
| Education | Other | $28.0 |
| Clinical, Counseling, and Applied Psychology | Health and Medicine | $27.4 |
| Literature | Arts and Humanities | $27.0 |
| Natural Sciences | Sciences | $26.9 |
| Physical Sciences | Sciences | $26.6 |
| Music | Arts and Humanities | $26.6 |
| Architecture | Arts and Humanities | $26.5 |
| Arts, Entertainment, and Media Management | Arts and Humanities | $26.5 |
| Visual and Performing Arts | Arts and Humanities | $26.5 |
| Health Professions and Related Clinical Sciences | Health and Medicine | $26.0 |
| Communication, Journalism, and Related Programs | Other | $25.9 |
| Drama/ Theater Arts and Stagecraft | Arts and Humanities | $25.8 |
| Astronomy and Astrophysics | Sciences | $25.6 |
| Engineering, General | Engineering | $25.5 |
| Multi-/Interdisciplinary Studies | Other | $25.4 |
| Aerospace, Aeronautical, and Astronautical Engineering | Engineering | $25.2 |
| Biological and Physical Sciences | Sciences | $25.2 |
| Foods, Nutrition, and Related Services | Health and Medicine | $25.2 |
| Biochemical Engineering | Engineering | $25.1 |
| Information Science/Studies | Sciences | $25.1 |
| Film/Video and Photographic Arts | Arts and Humanities | $25.0 |
| Social Work | Health and Medicine | $24.9 |
| Zoology/Animal Biology | Sciences | $24.7 |
| Civil Engineering | Engineering | $24.6 |
| City/Urban, Community, and Regional Planning | Social Sciences | $24.5 |
| Criminal Justice and Corrections | Social Sciences | $24.5 |
| Mechanical Engineering | Engineering | $24.5 |
| Radio, Television, and Digital Communication | Other | $24.4 |
| Business Administration, Management, and Operations | Other | $24.4 |
| Health and Physical Education/ Fitness | Health and Medicine | $24.2 |
| Accounting | Other | $24.1 |
| Computer & Information Sciences | Sciences | $24.0 |
| Public Relations, Advertising, and Applied Communication | Other | $23.9 |
| Chemical Engineering | Engineering | $23.8 |
| Biology | Sciences | $23.7 |
| Journalism | Other | $23.4 |
| Criminology | Social Sciences | $23.4 |
| Liberal Arts and Sciences, General Studies and Humanities | Social Sciences | $23.3 |
| Botany/Plant Biology | Sciences | $23.3 |
| Psychology | Social Sciences | $23.3 |
| Public Health | Health and Medicine | $23.1 |
| Archeology | Social Sciences | $23.0 |
| Communication and Media Studies | Other | $22.8 |
| Social Sciences | Social Sciences | $22.8 |
| Chemistry | Sciences | $22.8 |
| Hospitality Administration/Management | Health and Medicine | $22.8 |
| Physics | Sciences | $22.8 |
| History | Social Sciences | $22.8 |
| Registered Nursing, Nursing Administration, Nursing Research, and Clinical Nursing | Health and Medicine | $22.6 |
| English Language and Literature | Arts and Humanities | $22.5 |
| Sociology | Social Sciences | $22.3 |
| Computer Science | Sciences | $22.3 |
| Marine Sciences | Sciences | $22.2 |
| Political Science and Government | Social Sciences | $22.0 |
| Science, Technology, and Society | Sciences | $21.8 |
| Mathematics | Sciences | $21.8 |
| Geography and Cartography | Social Sciences | $21.7 |
| Anthropology | Social Sciences | $21.7 |
| Animal Sciences | Sciences | $21.6 |
| Environmental Design | Social Sciences | $21.2 |
| Agricultural | Sciences | $20.8 |
| Economics | Other | $20.7 |
| Statistics | Other | $20.6 |
| Public Administration | Social Sciences | $20.6 |
| Philosophy | Social Sciences | $20.6 |
| International/Global Studies | Other | $19.9 |
| Business Operations Support and Assistant Services | Other | $19.1 |
| Cognitive Science | Sciences | $18.1 |
| International and Comparative Education | Other | $13.0 |
From this dataset we can see that median debt for most Bachelor’s degrees is in the mid $20,000s range. Two outliers at the upper end are Behavioral Sciences ($42,800) and Religious Education ($32,000), while at the lower end we can see Comparative Education ($13,000) and Cognitive Science ($18,100).
Comparative education is a social science that involves the study of education systems, processes, and outcomes across different countries or cultures.
Looking at this data from a broader perspective, we can also see some trends emerge based on field of study. For starters, most Arts and Humanities degrees fall in the upper half of the ranking, while the bottom quarter of the ranking appears to be largely made up of Social Sciences, Sciences, and various business studies.
What About a Master’s Degree?
Education Data Initiative also includes median debt data for master’s degrees.
| Major | Field of Study | 2022 Median Debt (USD thousands) |
|---|---|---|
| Advanced/Graduate Dentistry and Oral Sciences | Health and Medicine | $158,155 |
| Visual and Performing Arts | Arts and Humanities | $63,830 |
| Radio, Television, and Digital Communication | Other | $55,554 |
| Social Sciences | Social Sciences | $54,554 |
| Philosophy | Social Sciences | $54,260 |
| Journalism | Other | $53,213 |
| Statistics | Other | $53,174 |
| Clinical, Counseling, and Applied Psychology | Health and Medicine | $51,888 |
| Registered Nursing, Nursing Administration, Nursing Research, and Clinical Nursing | Health and Medicine | $51,420 |
| Multi/Interdisciplinary Studies | Other | $48,693 |
| Public Relations, Advertising, and Applied Communication | Other | $48,366 |
| Sociology | Social Sciences | $46,871 |
| Health Professions and Related Clinical Sciences | Health and Medicine | $44,598 |
| English Language and Literature | Arts and Humanities | $44,301 |
| Political Science and Government | Social Sciences | $43,853 |
| Liberal Arts and Sciences, General Studies and Humanities | Social Sciences | $43,408 |
| Finance and Financial Management Services | Other | $43,408 |
| Psychology | Social Sciences | $43,408 |
| Business Administration, Management, and Operations | Other | $43,251 |
| Economics | Other | $43,053 |
| Literature | Arts and Humanities | $42,826 |
| Computer Engineering | Engineering | $42,647 |
| Public Administration | Social Sciences | $42,154 |
| Arts, Entertainment, and Media Management | Arts and Humanities | $41,238 |
| History | Social Sciences | $40,948 |
| Computer & Information Sciences | Sciences | $40,579 |
| Anthropology | Social Sciences | $40,428 |
| Biology | Sciences | $40,265 |
| Architecture | Arts and Humanities | $39,788 |
| Communication and Media Studies | Other | $39,270 |
| International/Global Studies | Other | $37,180 |
| Zoology/Animal Biology | Sciences | $37,056 |
| Hospitality Administration/Management | Other | $36,203 |
| Marketing | Other | $35,738 |
| Criminology | Social Sciences | $35,318 |
| Computer Science | Sciences | $35,301 |
| Engineering | Engineering | $33,235 |
| Health and Physical Education/Fitness | Health and Medicine | $32,372 |
| Agriculture | Sciences | $30,676 |
| Geography and Cartography | Social Sciences | $30,657 |
| Education | Other | $29,434 |
| Chemistry | Sciences | $28,912 |
| Accounting | Other | $28,212 |
| Mechanical Engineering | Engineering | $26,775 |
| Civil Engineering | Engineering | $26,180 |
| International Agriculture | Sciences | $23,275 |
While obtaining a master’s typically results in a greater amount of student debt, it can actually depend on your major. For instance, the median debt for a master’s in Computer Science is $35,300, which is $7,500 lower than a bachelor’s in Behavioral Science.
The biggest outlier from this list is Graduate Dentistry and Oral Sciences, with a median debt of $158,155. While this may sound like a lot, it should be compared to the average salary of a U.S. dentist, which according to Indeed is $225,400 per year.


Misc
Visualizing the Most Common Pets in the U.S.
Lions, tigers, and bears, oh my!—these animals do not feature on this list of popular American household pets.


Visualizing The Most Common Pets in the U.S.
This was originally posted on our Voronoi app. Download the app for free on iOS or Android and discover incredible data-driven charts from a variety of trusted sources.
In this graphic, we visualized the most common American household pets, based on 2023-2024 data from the American Pet Products Association (accessed via Forbes Advisor).
Figures represent the number of households that own each pet type, rather than the actual number of each animal. The “small animal” category includes hamsters, gerbils, rabbits, guinea pigs, chinchillas, mice, rats, and ferrets.
What is the Most Popular American Household Pet?
Based on this data, dogs—one of the first domesticated animals—are the most common pets in the United States. In fact, around 65 million households own a dog, and spend an average of $900 a year on their care.
| Rank | Species | Households |
|---|---|---|
| 1 | 🐶 Dog | 65M |
| 2 | 🐱 Cat | 47M |
| 3 | 🐟 Freshwater Fish | 11M |
| 4 | 🐰 Small Animals | 7M |
| 5 | 🐦 Bird | 6M |
| 6 | 🦎 Reptile | 6M |
| 7 | 🐴 Horse | 2M |
| 8 | 🐠 Saltwater Fish | 2M |
Note: Households can own multiple pets, and are counted for all relevant categories.
Cats rank second, at 47 million households, and these smaller felines are a little less expensive to own at $700/year according to Forbes estimates.
But aside from these two juggernauts, there are plenty of other common pet types found in households across the country.
Freshwater fish can be found in 11 million households, along with small animals—rabbits, hamsters, guinea pigs—in 7 million. Meanwhile, nearly 6 million homes have birds or reptiles.
Pet Ownership is on the Rise in America
Forbes found that 66% of all American households (numbering 87 million) own at least one pet, up from 56% in 1988. One third of these (29 million) own multiple pets.
A combination of factors is driving this increase: rising incomes, delayed childbirth, and of course the impact of the pandemic which nearly cleared out animal shelters across the globe.
America’s loneliness epidemic may also be a factor. Fledgling research has shown that single-individual households with pets recorded lower rates of loneliness during the pandemic than those without a pet.

-

 Sports1 week ago
The Highest Earning Athletes in Seven Professional Sports
-

 Countries2 weeks ago
Population Projections: The World’s 6 Largest Countries in 2075
-

 Markets2 weeks ago
The Top 10 States by Real GDP Growth in 2023
-

 Demographics2 weeks ago
The Smallest Gender Wage Gaps in OECD Countries
-

 United States2 weeks ago
Where U.S. Inflation Hit the Hardest in March 2024
-

 Green2 weeks ago
Top Countries By Forest Growth Since 2001
-

 United States2 weeks ago
Ranked: The Largest U.S. Corporations by Number of Employees
-

 Maps2 weeks ago
The Largest Earthquakes in the New York Area (1970-2024)