Markets
Charted: U.S. Consumer Debt Approaches $16 Trillion


Charted: U.S. Consumer Debt Approaches $16 Trillion
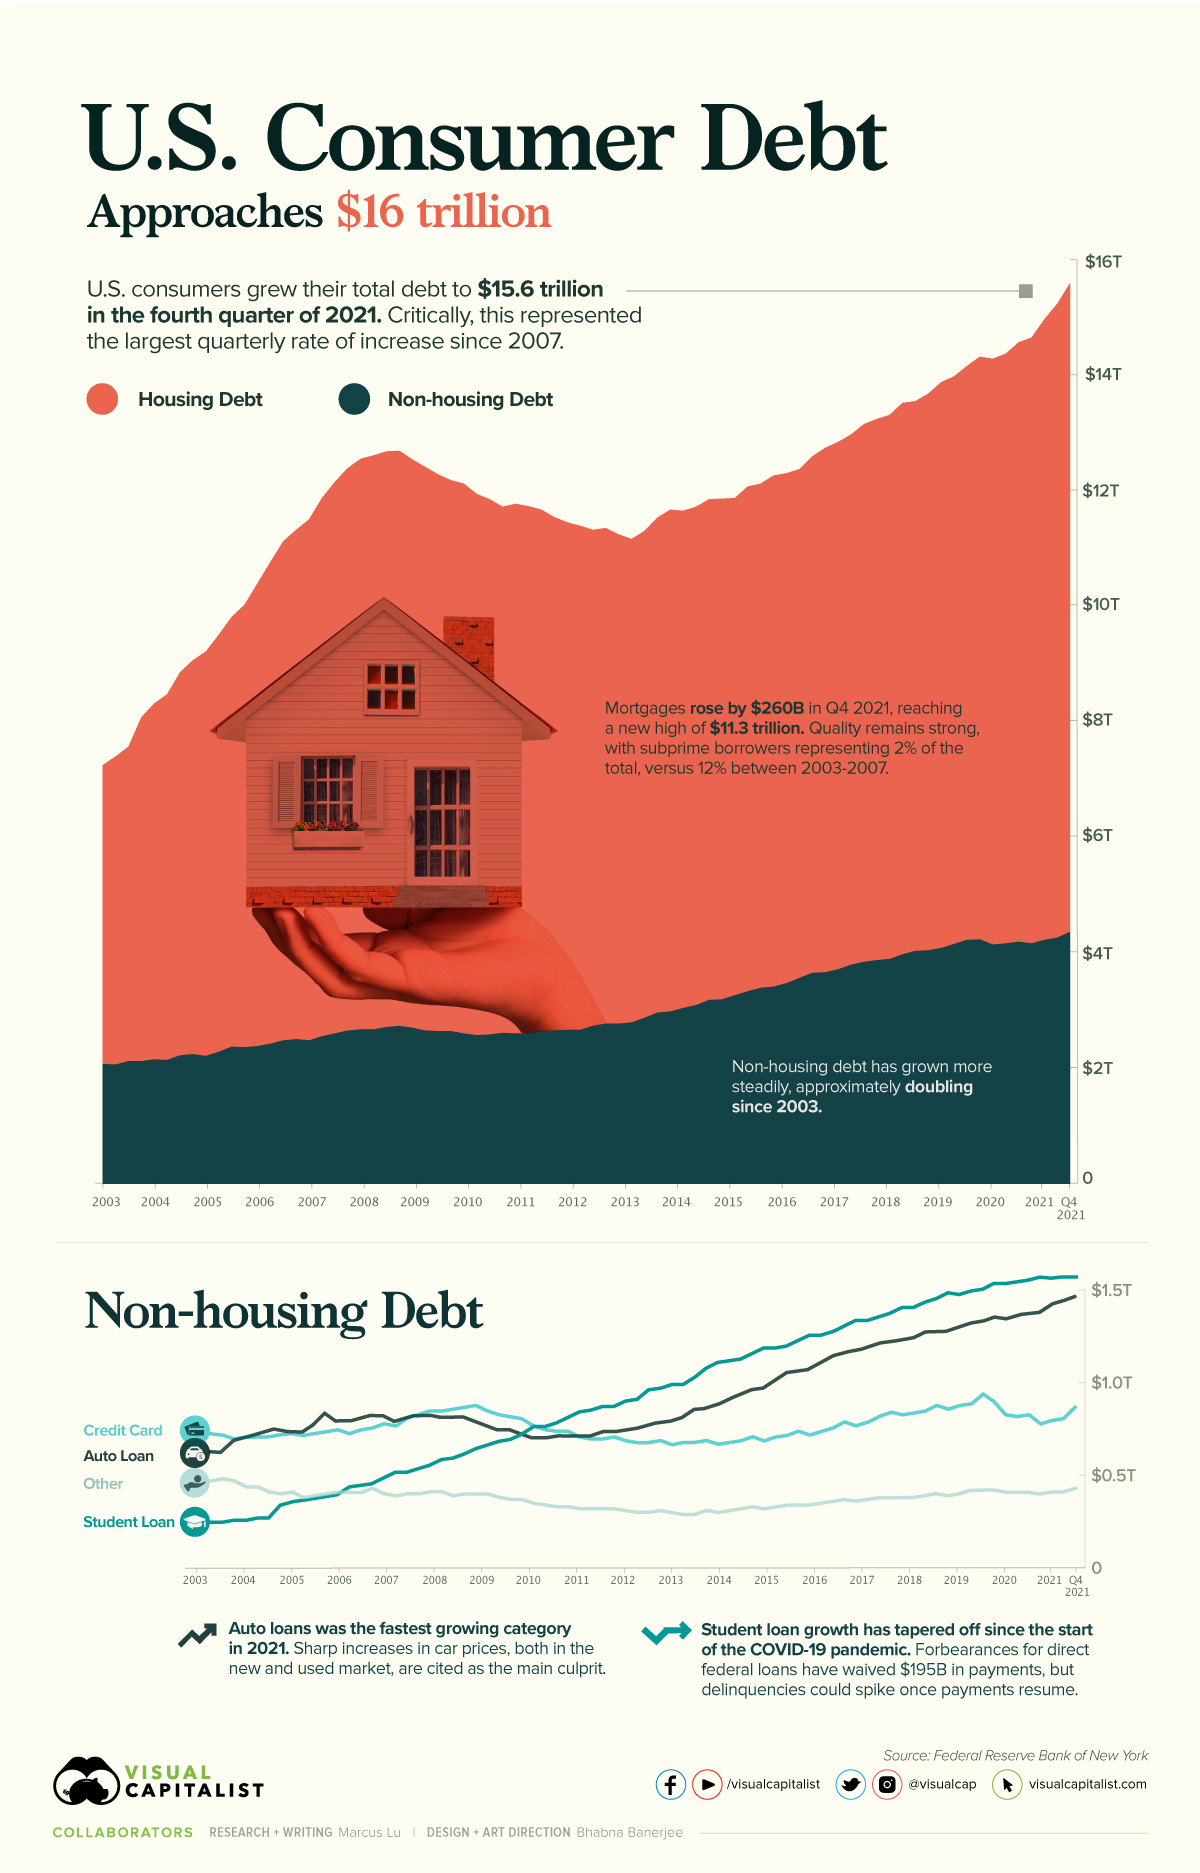
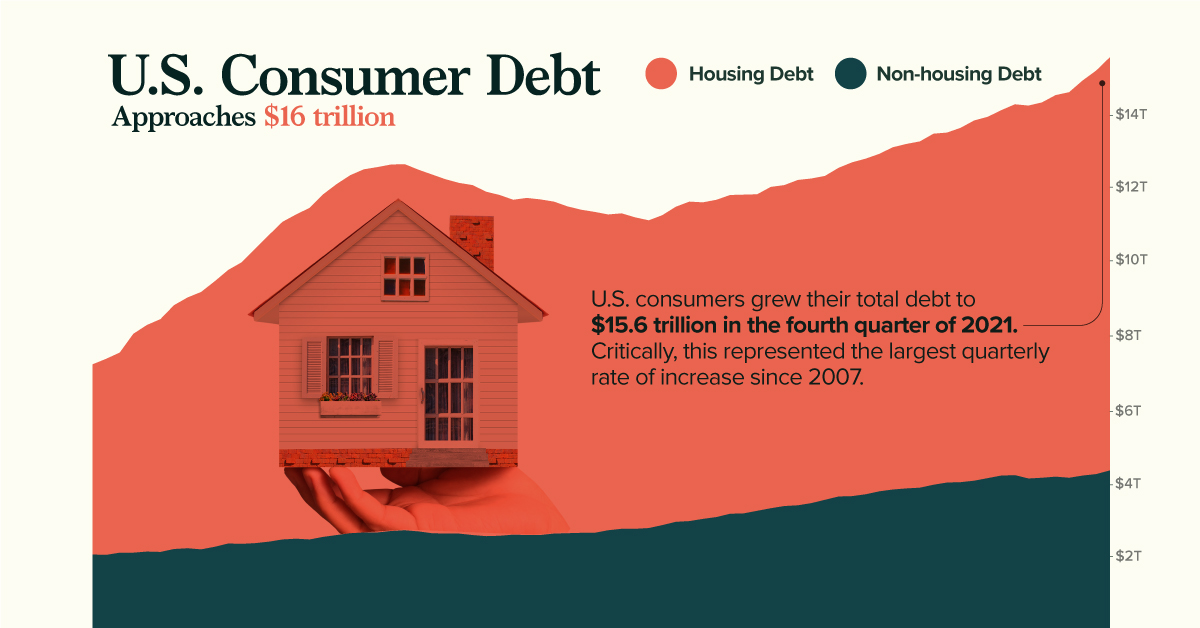
According to the Federal Reserve (Fed), U.S. consumer debt is approaching a record-breaking $16 trillion. Critically, the rate of increase in consumer debt for the fourth quarter of 2021 was also the highest seen since 2007.
This graphic provides context into the consumer debt situation using data from the end of 2021.
Housing Vs. Non-Housing Debt
The following table includes the data used in the above graphic. Housing debt covers mortgages, while non-housing debt covers auto loans, student loans, and credit card balances.
| Date | Housing Debt (USD trillions) | Non-Housing Debt (USD trillions) | Total Consumer Debt (USD trillions) |
|---|---|---|---|
| Q1 2003 | 5.18 | 2.05 | 7.23 |
| Q2 2003 | 5.34 | 2.04 | 7.38 |
| Q3 2003 | 5.45 | 2.10 | 7.55 |
| Q4 2003 | 5.96 | 2.10 | 8.06 |
| Q1 2004 | 6.17 | 2.13 | 8.30 |
| Q2 2004 | 6.34 | 2.12 | 8.46 |
| Q3 2004 | 6.64 | 2.20 | 8.84 |
| Q4 2004 | 6.83 | 2.22 | 9.05 |
| Q1 2005 | 7.01 | 2.19 | 9.20 |
| Q2 2005 | 7.23 | 2.26 | 9.49 |
| Q3 2005 | 7.45 | 2.35 | 9.80 |
| Q4 2005 | 7.67 | 2.34 | 10.01 |
| Q1 2006 | 8.02 | 2.36 | 10.38 |
| Q2 2006 | 8.35 | 2.40 | 10.75 |
| Q3 2006 | 8.65 | 2.46 | 11.11 |
| Q4 2006 | 8.83 | 2.48 | 11.31 |
| Q1 2007 | 9.03 | 2.46 | 11.49 |
| Q2 2007 | 9.33 | 2.53 | 11.86 |
| Q3 2007 | 9.56 | 2.58 | 12.14 |
| Q4 2007 | 9.75 | 2.63 | 12.38 |
| Q1 2008 | 9.89 | 2.65 | 12.54 |
| Q2 2008 | 9.95 | 2.65 | 12.60 |
| Q3 2008 | 9.98 | 2.69 | 12.67 |
| Q4 2008 | 9.97 | 2.71 | 12.68 |
| Q1 2009 | 9.85 | 2.68 | 12.53 |
| Q2 2009 | 9.77 | 2.63 | 12.40 |
| Q3 2009 | 9.65 | 2.62 | 12.27 |
| Q4 2009 | 9.55 | 2.62 | 12.17 |
| Q1 2010 | 9.53 | 2.58 | 12.11 |
| Q2 2010 | 9.38 | 2.55 | 11.93 |
| Q3 2010 | 9.28 | 2.56 | 11.84 |
| Q4 2010 | 9.12 | 2.59 | 11.71 |
| Q1 2011 | 9.18 | 2.58 | 11.76 |
| Q2 2011 | 9.14 | 2.58 | 11.72 |
| Q3 2011 | 9.04 | 2.62 | 11.66 |
| Q4 2011 | 8.90 | 2.63 | 11.53 |
| Q1 2012 | 8.80 | 2.64 | 11.44 |
| Q2 2012 | 8.74 | 2.64 | 11.38 |
| Q3 2012 | 8.60 | 2.71 | 11.31 |
| Q4 2012 | 8.59 | 2.75 | 11.34 |
| Q1 2013 | 8.48 | 2.75 | 11.23 |
| Q2 2013 | 8.38 | 2.77 | 11.15 |
| Q3 2013 | 8.44 | 2.85 | 11.29 |
| Q4 2013 | 8.58 | 2.94 | 11.52 |
| Q1 2014 | 8.70 | 2.96 | 11.66 |
| Q2 2014 | 8.62 | 3.02 | 11.64 |
| Q3 2014 | 8.64 | 3.07 | 11.71 |
| Q4 2014 | 8.68 | 3.16 | 11.84 |
| Q1 2015 | 8.68 | 3.17 | 11.85 |
| Q2 2015 | 8.62 | 3.24 | 11.86 |
| Q3 2015 | 8.75 | 3.31 | 12.06 |
| Q4 2015 | 8.74 | 3.37 | 12.11 |
| Q1 2016 | 8.86 | 3.39 | 12.25 |
| Q2 2016 | 8.84 | 3.45 | 12.29 |
| Q3 2016 | 8.82 | 3.54 | 12.36 |
| Q4 2016 | 8.95 | 3.63 | 12.58 |
| Q1 2017 | 9.09 | 3.64 | 12.73 |
| Q2 2017 | 9.14 | 3.69 | 12.83 |
| Q3 2017 | 9.19 | 3.77 | 12.96 |
| Q4 2017 | 9.32 | 3.82 | 13.14 |
| Q1 2018 | 9.38 | 3.85 | 13.23 |
| Q2 2018 | 9.43 | 3.87 | 13.30 |
| Q3 2018 | 9.56 | 3.95 | 13.51 |
| Q4 2018 | 9.53 | 4.01 | 13.54 |
| Q1 2019 | 9.65 | 4.02 | 13.67 |
| Q2 2019 | 9.81 | 4.06 | 13.87 |
| Q3 2019 | 9.84 | 4.13 | 13.97 |
| Q4 2019 | 9.95 | 4.20 | 14.15 |
| Q1 2020 | 10.10 | 4.21 | 14.31 |
| Q2 2020 | 10.15 | 4.12 | 14.27 |
| Q3 2020 | 10.22 | 4.14 | 14.36 |
| Q4 2020 | 10.39 | 4.17 | 14.56 |
| Q1 2021 | 10.50 | 4.14 | 14.64 |
| Q2 2021 | 10.76 | 4.20 | 14.96 |
| Q3 2021 | 10.99 | 4.24 | 15.23 |
| Q4 2021 | 11.25 | 4.34 | 15.59 |
Source: Federal Reserve
Trends in Housing Debt
Home prices have experienced upward pressure since the beginning of the COVID-19 pandemic. This is evidenced by the Case-Shiller U.S. National Home Price Index, which has increased by 34% since the start of the pandemic.
Driving this growth are various pandemic-related impacts. For example, the cost of materials such as lumber have seen enormous spikes. We’ve covered this story in a previous graphic, which showed how many homes could be built with $50,000 worth of lumber. In most cases, these higher costs are passed on to the consumer.
Another key factor here is mortgage rates, which fell to all-time lows in 2020. When rates are low, consumers are able to borrow in larger quantities. This increases the demand for homes, which in turn inflates prices.
Ultimately, higher home prices translate to more mortgage debt being incurred by families.
No Need to Worry, Though
Economists believe that today’s housing debt isn’t a cause for concern. This is because the quality of borrowers is much stronger than it was between 2003 and 2007, in the years leading up to the financial crisis and subsequent housing crash.
In the chart below, subprime borrowers (those with a credit score of 620 and below) are represented by the red-shaded bars:
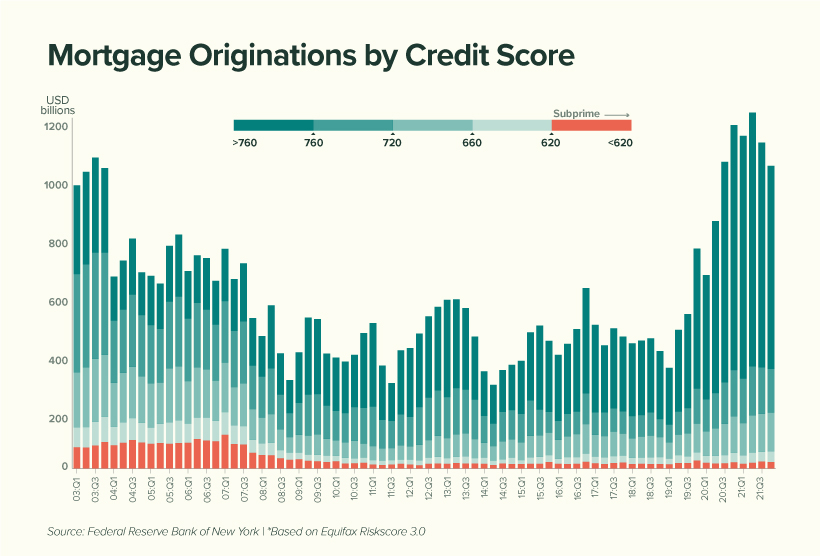
We can see that subprime borrowers represent very little (2%) of today’s total originations compared to the period between 2003 to 2007 (12%). This suggests that American homeowners are, on average, less likely to default on their mortgage.
Economists have also noted a decline in the household debt service ratio, which measures the percentage of disposable income that goes towards a mortgage. This is shown in the table below, along with the average 30-year fixed mortgage rate.
| Year | Mortgage Payments as a % of Disposable Income | Average 30-Year Fixed Mortgage Rate |
|---|---|---|
| 2000 | 12.0% | 8.2% |
| 2004 | 12.2% | 5.4% |
| 2008 | 12.8% | 5.8% |
| 2012 | 9.8% | 3.9% |
| 2016 | 9.9% | 3.7% |
| 2020 | 9.4% | 3.5% |
| 2021 | 9.3% | 3.2% |
Source: Federal Reserve
While it’s true that Americans are less burdened by their mortgages, we must acknowledge the decrease in mortgage rates that took place over the same period.
With the Fed now increasing rates to calm inflation, Americans could see their mortgages begin to eat up a larger chunk of their paycheck. In fact, mortgage rates have already risen for seven consecutive weeks.
Trends in Non-Housing Consumer Debt
The key stories in non-housing consumer debt are student loans and auto loans.
The former category of debt has grown substantially over the past two decades, with growth tapering off during the pandemic. This can be attributed to COVID relief measures which have temporarily lowered the interest rate on direct federal student loans to 0%.
Additionally, these loans were placed into forbearance, meaning 37 million borrowers have not been required to make payments. As of April 2022, the value of these waived payments has reached $195 billion.
Over the course of the pandemic, very few direct federal borrowers have made voluntary payments to reduce their loan principal. When payments eventually resume, and the 0% interest rate is reverted, economists believe that delinquencies could rise significantly.
Auto loans, on the other hand, are following a similar trajectory as mortgages. Both new and used car prices have risen due to the global chip shortage, which is hampering production across the entire industry.
To put this in numbers, the average price of a new car has climbed from $35,600 in 2019, to over $47,000 today. Over a similar timeframe, the average price of a used car has grown from $19,800, to over $28,000.


Markets
The European Stock Market: Attractive Valuations Offer Opportunities
On average, the European stock market has valuations that are nearly 50% lower than U.S. valuations. But how can you access the market?


European Stock Market: Attractive Valuations Offer Opportunities
Europe is known for some established brands, from L’Oréal to Louis Vuitton. However, the European stock market offers additional opportunities that may be lesser known.
The above infographic, sponsored by STOXX, outlines why investors may want to consider European stocks.
Attractive Valuations
Compared to most North American and Asian markets, European stocks offer lower or comparable valuations.
| Index | Price-to-Earnings Ratio | Price-to-Book Ratio |
|---|---|---|
| EURO STOXX 50 | 14.9 | 2.2 |
| STOXX Europe 600 | 14.4 | 2 |
| U.S. | 25.9 | 4.7 |
| Canada | 16.1 | 1.8 |
| Japan | 15.4 | 1.6 |
| Asia Pacific ex. China | 17.1 | 1.8 |
Data as of February 29, 2024. See graphic for full index names. Ratios based on trailing 12 month financials. The price to earnings ratio excludes companies with negative earnings.
On average, European valuations are nearly 50% lower than U.S. valuations, potentially offering an affordable entry point for investors.
Research also shows that lower price ratios have historically led to higher long-term returns.
Market Movements Not Closely Connected
Over the last decade, the European stock market had low-to-moderate correlation with North American and Asian equities.
The below chart shows correlations from February 2014 to February 2024. A value closer to zero indicates low correlation, while a value of one would indicate that two regions are moving in perfect unison.
| EURO STOXX 50 | STOXX EUROPE 600 | U.S. | Canada | Japan | Asia Pacific ex. China |
|
|---|---|---|---|---|---|---|
| EURO STOXX 50 | 1.00 | 0.97 | 0.55 | 0.67 | 0.24 | 0.43 |
| STOXX EUROPE 600 | 1.00 | 0.56 | 0.71 | 0.28 | 0.48 | |
| U.S. | 1.00 | 0.73 | 0.12 | 0.25 | ||
| Canada | 1.00 | 0.22 | 0.40 | |||
| Japan | 1.00 | 0.88 | ||||
| Asia Pacific ex. China | 1.00 |
Data is based on daily USD returns.
European equities had relatively independent market movements from North American and Asian markets. One contributing factor could be the differing sector weights in each market. For instance, technology makes up a quarter of the U.S. market, but health care and industrials dominate the broader European market.
Ultimately, European equities can enhance portfolio diversification and have the potential to mitigate risk for investors.
Tracking the Market
For investors interested in European equities, STOXX offers a variety of flagship indices:
| Index | Description | Market Cap |
|---|---|---|
| STOXX Europe 600 | Pan-regional, broad market | €10.5T |
| STOXX Developed Europe | Pan-regional, broad-market | €9.9T |
| STOXX Europe 600 ESG-X | Pan-regional, broad market, sustainability focus | €9.7T |
| STOXX Europe 50 | Pan-regional, blue-chip | €5.1T |
| EURO STOXX 50 | Eurozone, blue-chip | €3.5T |
Data is as of February 29, 2024. Market cap is free float, which represents the shares that are readily available for public trading on stock exchanges.
The EURO STOXX 50 tracks the Eurozone’s biggest and most traded companies. It also underlies one of the world’s largest ranges of ETFs and mutual funds. As of November 2023, there were €27.3 billion in ETFs and €23.5B in mutual fund assets under management tracking the index.
“For the past 25 years, the EURO STOXX 50 has served as an accurate, reliable and tradable representation of the Eurozone equity market.”
— Axel Lomholt, General Manager at STOXX
Partnering with STOXX to Track the European Stock Market
Are you interested in European equities? STOXX can be a valuable partner:
- Comprehensive, liquid and investable ecosystem
- European heritage, global reach
- Highly sophisticated customization capabilities
- Open architecture approach to using data
- Close partnerships with clients
- Part of ISS STOXX and Deutsche Börse Group
With a full suite of indices, STOXX can help you benchmark against the European stock market.
Learn how STOXX’s European indices offer liquid and effective market access.

-

 Economy2 days ago
Economic Growth Forecasts for G7 and BRICS Countries in 2024
The IMF has released its economic growth forecasts for 2024. How do the G7 and BRICS countries compare?
-

 Markets2 weeks ago
U.S. Debt Interest Payments Reach $1 Trillion
U.S. debt interest payments have surged past the $1 trillion dollar mark, amid high interest rates and an ever-expanding debt burden.
-

 United States2 weeks ago
Ranked: The Largest U.S. Corporations by Number of Employees
We visualized the top U.S. companies by employees, revealing the massive scale of retailers like Walmart, Target, and Home Depot.
-

 Markets2 weeks ago
The Top 10 States by Real GDP Growth in 2023
This graphic shows the states with the highest real GDP growth rate in 2023, largely propelled by the oil and gas boom.
-

 Markets2 weeks ago
Ranked: The World’s Top Flight Routes, by Revenue
In this graphic, we show the highest earning flight routes globally as air travel continued to rebound in 2023.
-

 Markets3 weeks ago
Ranked: The Most Valuable Housing Markets in America
The U.S. residential real estate market is worth a staggering $47.5 trillion. Here are the most valuable housing markets in the country.


-

 Debt1 week ago
How Debt-to-GDP Ratios Have Changed Since 2000
-
Markets2 weeks ago
Ranked: The World’s Top Flight Routes, by Revenue
-

 Demographics2 weeks ago
Population Projections: The World’s 6 Largest Countries in 2075
-
Markets2 weeks ago
The Top 10 States by Real GDP Growth in 2023
-

 Demographics2 weeks ago
The Smallest Gender Wage Gaps in OECD Countries
-

 United States2 weeks ago
Where U.S. Inflation Hit the Hardest in March 2024
-

 Green2 weeks ago
Top Countries By Forest Growth Since 2001
-
United States2 weeks ago
Ranked: The Largest U.S. Corporations by Number of Employees