Energy
The Periodic Table of Endangered Elements
Article/Editing:
Click to view a larger version of the graphic.
The Periodic Table of Endangered Elements
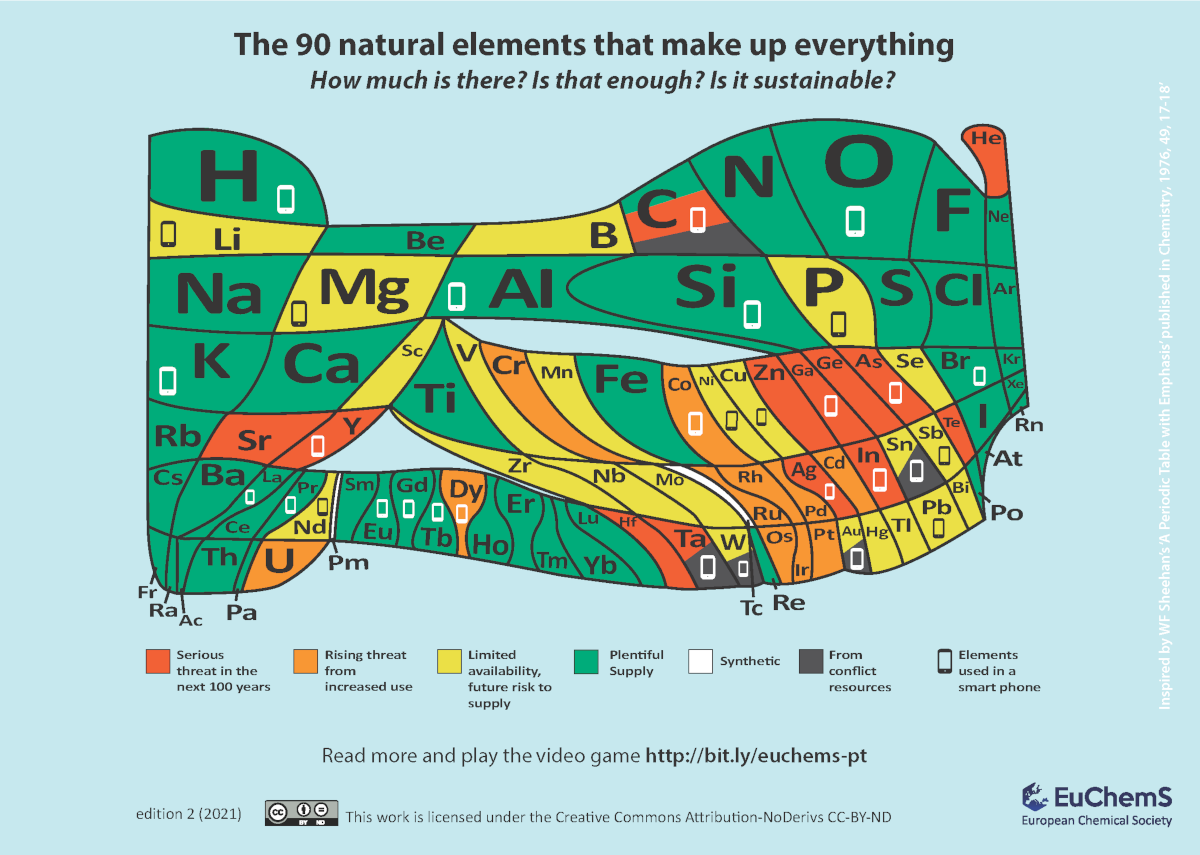
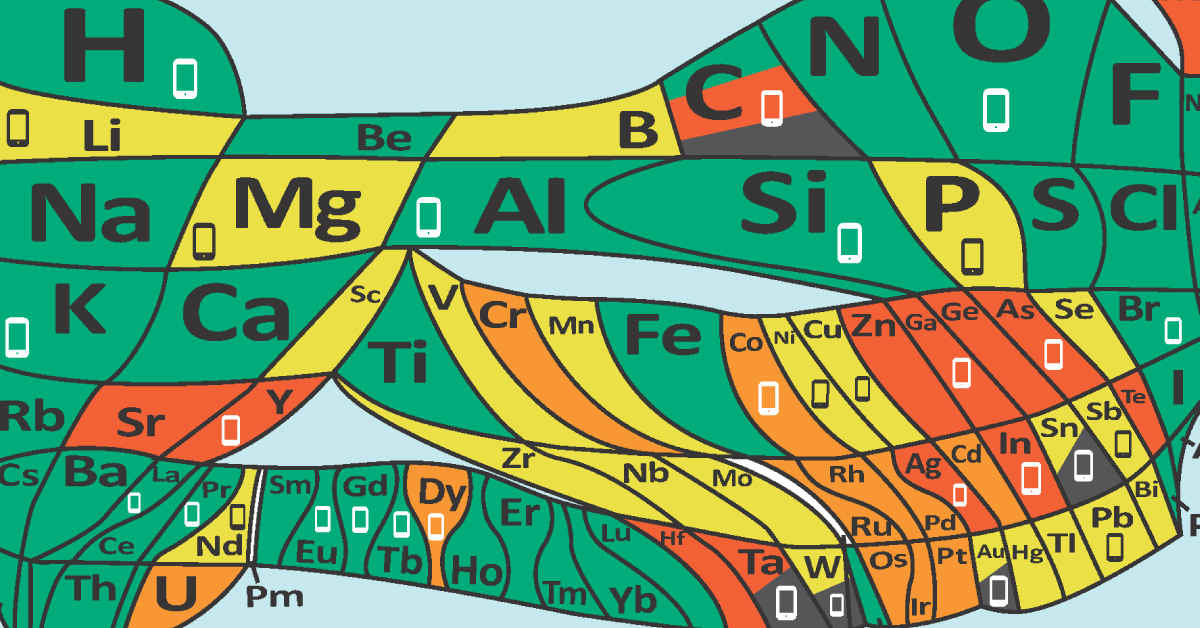
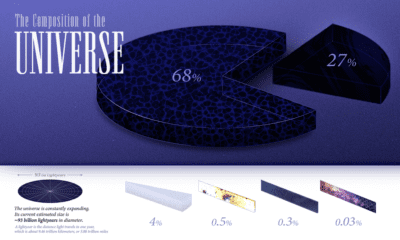
The building blocks for everything on Earth are made from 90 different naturally occurring elements.
This visualization made by the European Chemical Society (EuChemS), shows a periodic table of these 90 different elements, highlighting which ones are in abundance and which ones are in serious threat as of 2021.
On the graphic, the area of each element relates to its number of atoms on a logarithmic scale. The color-coding shows whether there’s enough of each element, or whether the element is becoming scarce, based on current consumption levels.
| Element | Full Name | Status |
|---|---|---|
| Ac | Actinium | Plentiful supply |
| Ag | Silver | Serious threat |
| AI | Aluminum | Plentiful supply |
| Ar | Argon | Plentiful supply |
| As | Arsenic | Serious threat |
| At | Astatine | Plentiful supply |
| Au | Gold | Limited availability |
| B | Boron | Limited availability |
| Ba | Barium | Plentiful supply |
| Be | Beryllium | Plentiful supply |
| Bi | Bismuth | Limited availability |
| Br | Bromine | Plentiful supply |
| C | Carbon | Plentiful supply / serious threat |
| Ca | Calcium | Plentiful supply |
| Cd | Cadmium | Rising threat |
| Ce | Cerium | Plentiful supply |
| CI | Chlorine | Plentiful supply |
| Co | Cobalt | Rising threat |
| Cr | Chromium | Rising threat |
| Cs | Cesium | Plentiful supply |
| Cu | Copper | Rising threat |
| Dy | Dysprosium | Rising threat |
| Er | Erbium | Plentiful supply |
| Eu | Europium | Plentiful supply |
| F | Flourine | Plentiful supply |
| Fe | Iron | Plentiful supply |
| Fr | Francium | Plentiful supply |
| Ga | Gallium | Serious threat |
| Gd | Gadolinium | Plentiful supply |
| Ge | Germanium | Serious threat |
| H | Hydrogen | Plentiful supply |
| He | Helium | Serious threat |
| Hf | Hafnium | Serious threat |
| Hg | Mercury | Limited availability |
| Ho | Holmium | Plentiful supply |
| I | Iodine | Plentiful supply |
| In | Indium | Serious threat |
| Ir | Iridium | Rising threat |
| K | Potassium | Plentiful supply |
| Kr | Krypton | Plentiful supply |
| La | Lanthanum | Plentiful supply |
| Li | Lithium | Limited availability |
| Lu | Lutetium | Plentiful supply |
| Mg | Magnesium | Limited availability |
| Mn | Manganese | Limited availability |
| Mo | Molybdenum | Limited availability |
| N | Nitrogen | Plentiful supply |
| Na | Sodium | Plentiful supply |
| Nb | Niobium | Limited availability |
| Nd | Neodymium | Limited availability |
| Ne | Neon | Plentify supply |
| Ni | Nickel | Limited availability |
| O | Oxygen | Plentiful supply |
| Os | Osmium | Rising threat |
| P | Phosphorus | Limited availability |
| Pa | Protactinium | Plentiful supply |
| Pb | Lead | Limited availability |
| Pd | Palladium | Rising threat |
| Po | Polonium | Plentiful supply |
| Pr | Praseodymium | Plentiful supply |
| Pt | Platinum | Rising threat |
| Ra | Radium | Plentiful supply |
| Rb | Rubidium | Plentiful supply |
| Re | Rhenium | Plentiful supply |
| Rh | Rhodium | Rising threat |
| Rn | Radon | Plentify supply |
| Ru | Ruthenium | Rising threat |
| Sb | Antimony | Limited availability |
| Sc | Scandium | Limited availability |
| Se | Selenium | Limited availability |
| Si | Silicon | Plentiful supply |
| S | Sulfur | Plentiful supply |
| Sm | Samarium | Plentiful supply |
| Sn | Tin | Limited availability |
| Sr | Strontium | Serious threat |
| Ta | Tantalum | Serious threat |
| Tb | Terbium | Plentiful supply |
| Te | Tellurium | Serious threat |
| Ti | Titanium | Plentiful supply |
| TI | Thalium | Limited availability |
| Tm | Thulium | Plentiful supply |
| V | Vanadium | Limited availability |
| W | Tungsten | Limited availability |
| Xe | Xenon | Plentiful supply |
| Y | Yttrium | Serious threat |
| Yb | Ytterbium | Plentiful supply |
| Zn | Zinc | Serious threat |
| Zr | Zirconium | Limited availability |
| Th | Thorium | Plentiful supply |
| U | Uranium | Rising threat |
While these elements don’t technically run out and instead transform (except for helium, which rises and escapes from Earth’s atmosphere), some are being used up exceptionally fast, to the point where they may soon become extremely scarce.
One element worth pointing out on the graphic is carbon, which is three different colors: green, red, and dark gray.
- Green, because carbon is in abundance (to a fault) in the form of carbon dioxide
- Red, because it will soon cause a number of cataphoric problems if consumption habits don’t change
- Gray because carbon-based fuels often come from conflict countries
For more elements-related content, check out our channel dedicated to raw materials and the megatrends that drive them, VC Elements.

This article was published as a part of Visual Capitalist's Creator Program, which features data-driven visuals from some of our favorite Creators around the world.


Lithium
Ranked: The Top 10 EV Battery Manufacturers in 2023
Asia dominates this ranking of the world’s largest EV battery manufacturers in 2023.


The Top 10 EV Battery Manufacturers in 2023
This was originally posted on our Voronoi app. Download the app for free on iOS or Android and discover incredible data-driven charts from a variety of trusted sources.
Despite efforts from the U.S. and EU to secure local domestic supply, all major EV battery manufacturers remain based in Asia.
In this graphic we rank the top 10 EV battery manufacturers by total battery deployment (measured in megawatt-hours) in 2023. The data is from EV Volumes.
Chinese Dominance
Contemporary Amperex Technology Co. Limited (CATL) has swiftly risen in less than a decade to claim the title of the largest global battery group.
The Chinese company now has a 34% share of the market and supplies batteries to a range of made-in-China vehicles, including the Tesla Model Y, SAIC’s MG4/Mulan, and various Li Auto models.
| Company | Country | 2023 Production (megawatt-hour) | Share of Total Production |
|---|---|---|---|
| CATL | 🇨🇳 China | 242,700 | 34% |
| BYD | 🇨🇳 China | 115,917 | 16% |
| LG Energy Solution | 🇰🇷 Korea | 108,487 | 15% |
| Panasonic | 🇯🇵 Japan | 56,560 | 8% |
| SK On | 🇰🇷 Korea | 40,711 | 6% |
| Samsung SDI | 🇰🇷 Korea | 35,703 | 5% |
| CALB | 🇨🇳 China | 23,493 | 3% |
| Farasis Energy | 🇨🇳 China | 16,527 | 2% |
| Envision AESC | 🇨🇳 China | 8,342 | 1% |
| Sunwoda | 🇨🇳 China | 6,979 | 1% |
| Other | - | 56,040 | 8% |
In 2023, BYD surpassed LG Energy Solution to claim second place. This was driven by demand from its own models and growth in third-party deals, including providing batteries for the made-in-Germany Tesla Model Y, Toyota bZ3, Changan UNI-V, Venucia V-Online, as well as several Haval and FAW models.
The top three battery makers (CATL, BYD, LG) collectively account for two-thirds (66%) of total battery deployment.
Once a leader in the EV battery business, Panasonic now holds the fourth position with an 8% market share, down from 9% last year. With its main client, Tesla, now sourcing batteries from multiple suppliers, the Japanese battery maker seems to be losing its competitive edge in the industry.
Overall, the global EV battery market size is projected to grow from $49 billion in 2022 to $98 billion by 2029, according to Fortune Business Insights.

-

 Debt1 week ago
How Debt-to-GDP Ratios Have Changed Since 2000
-

 Markets2 weeks ago
Ranked: The World’s Top Flight Routes, by Revenue
-

 Countries2 weeks ago
Population Projections: The World’s 6 Largest Countries in 2075
-

 Markets2 weeks ago
The Top 10 States by Real GDP Growth in 2023
-

 Demographics2 weeks ago
The Smallest Gender Wage Gaps in OECD Countries
-

 United States2 weeks ago
Where U.S. Inflation Hit the Hardest in March 2024
-

 Green2 weeks ago
Top Countries By Forest Growth Since 2001
-

 United States2 weeks ago
Ranked: The Largest U.S. Corporations by Number of Employees