Green
Explained: The Relationship Between Climate Change and Wildfires
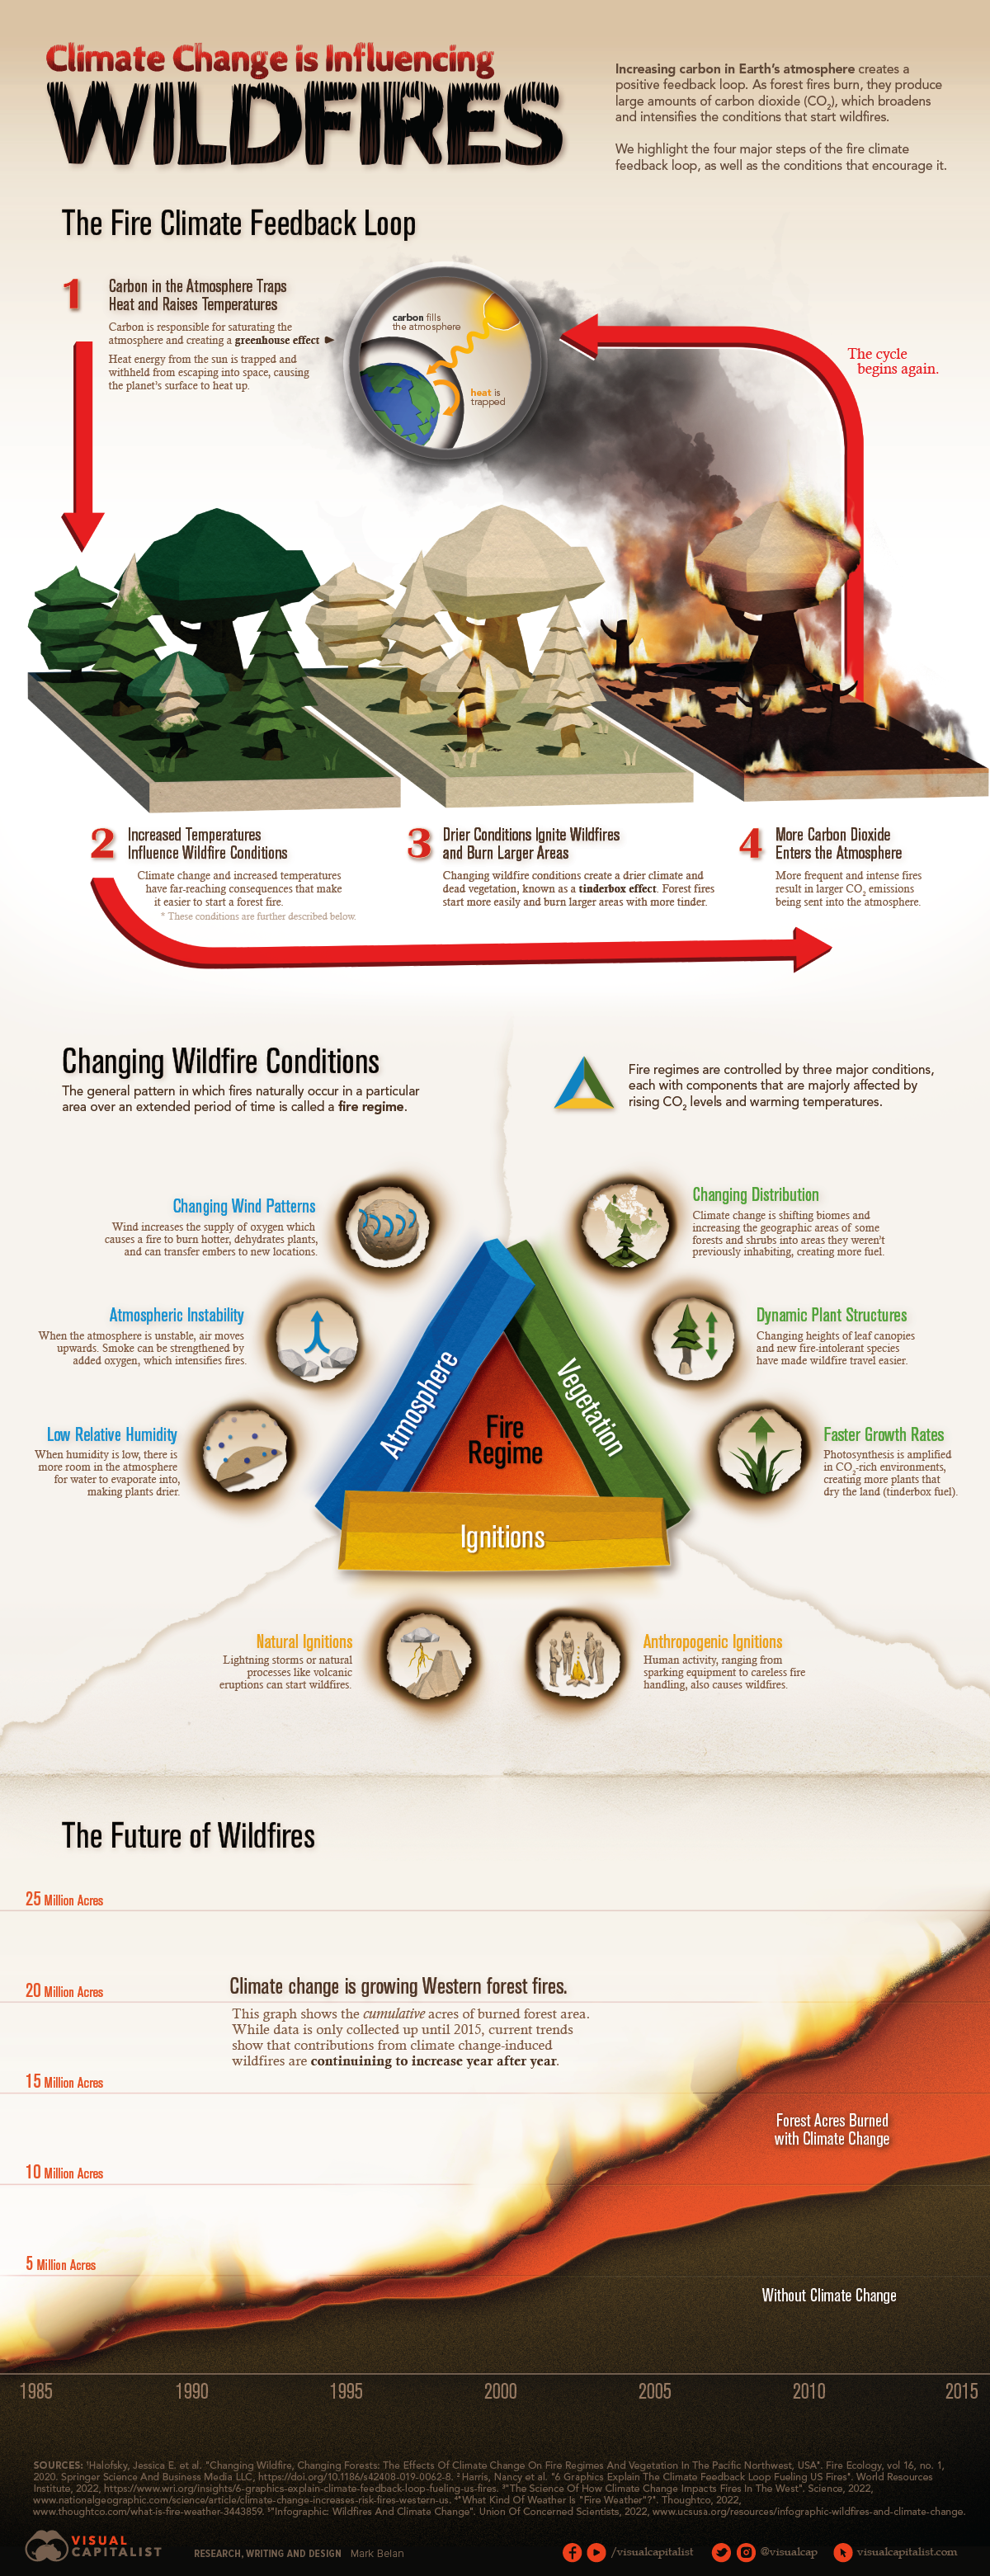


How Climate Change is Influencing Wildfires
Each year, thousands of wildfires burn through millions of acres of land around the world.
We’ve already seen the mass devastation that wildfires can bring, especially in places like Australia, Serbia, and California. But new research by the UN indicates that things might get even worse by the end of the century. By 2100, the frequency of wildfires could increase by up to 50%.
What’s causing this influx of wildfires around the world? Below, we dig into how climate change is impacting wildfires—and how in turn, wildfires are impacting climate change.
Climate Conditions That Support Wildfires
Before diving in, it’s worth going over the basics of wildfires, and how they get started in the first place. An area’s vulnerability to wildfires, also known as its fire regime, depends on three major conditions: its atmosphere, vegetation, and ignitions.
① Atmosphere
Atmosphere plays a big part in how sensitive an area is to wildfires. For instance, wind can increase oxygen supply in an area, which would help fuel a wildfire, and may even transfer embers to new locations.
② Vegetation
Vegetation is also a huge factor in whether or not an area is vulnerable to wildfires. A region with drier vegetation may catch fire more easily, and an area with more forest or shrubs provides more fuel for potential blazes.
③ Ignitions
An area that’s close to volcanic activity, or prone to lightning storms may be more susceptible to wildfires. However, human activity like campfires or faulty equipment can also trigger fires, so popular areas for camping or logging may be at higher risk as well.
While these conditions vary depending on the location, in general, fire regimes are being impacted by climate change, which is causing an influx in the duration and intensity of wildfires around the world.
The Fire Climate Feedback Loop
Since the 1850s, global surface temperatures have risen by about 1.0°C (1.8°F).
These increased surface temperatures have had far-reaching impacts on our climate—in the Northern Hemisphere, warmer temperatures have led to less snow, earlier arrival of spring, and ultimately longer, drier fire seasons.
These longer fire seasons have led to an influx of wildfires. But here’s the kicker—wildfires emit tons of carbon. In 2021, wildfires around the world emitted an estimated 1.76 billion tonnes of carbon into the atmosphere, which for context, is more than double the annual emissions from the entire country of Germany.
This carbon gets trapped in our atmosphere and contributes to rising surface temperatures. In other words, more carbon creates more wildfires—and more wildfires create more carbon.
Extreme Weather Events Are Rising In General
It’s not just wildfires that are growing in frequency and intensity because of climate change—droughts, heatwaves, and floods are also becoming more common around the world.
This year, temperatures reached all-time highs across Europe, which wrecked havoc across the continent, impacted infrastructure, and even took lives.
Experts warn that this may become the new normal. To help mitigate risk, governments, policymakers, and companies need to band together to create safeguards and establish proper preventative measures.


Green
The Carbon Footprint of Major Travel Methods
Going on a cruise ship and flying domestically are the most carbon-intensive travel methods.


The Carbon Footprint of Major Travel Methods
This was originally posted on our Voronoi app. Download the app for free on iOS or Android and discover incredible data-driven charts from a variety of trusted sources.
Did you know that transport accounts for nearly one-quarter of global energy-related carbon dioxide (CO₂) emissions?
This graphic illustrates the carbon footprints of major travel methods measured in grams of carbon dioxide equivalent (CO₂e) emitted per person to travel one kilometer. This includes both CO₂ and other greenhouse gases.
Data is sourced from Our World in Data, the UK Government’s Department for Energy Security and Net Zero, and The International Council on Clean Transportation, as of December 2022.
These figures should be interpreted as approximations, rather than exact numbers. There are many variables at play that determine the actual carbon footprint in any individual case, including vehicle type or model, occupancy, energy mix, and even weather.
Cruise Ships are the Most Carbon-Intensive Travel Method
According to these estimates, taking a cruise ship, flying domestically, and driving alone are some of the most carbon-intensive travel methods.
Cruise ships typically use heavy fuel oil, which is high in carbon content. The average cruise ship weighs between 70,000 to 180,000 metric tons, meaning they require large engines to get moving.
These massive vessels must also generate power for onboard amenities such as lighting, air conditioning, and entertainment systems.
Short-haul flights are also considered carbon-intensive due to the significant amount of fuel consumed during initial takeoff and climbing altitude, relative to a lower amount of cruising.
| Transportation method | CO₂ equivalent emissions per passenger km |
|---|---|
| Cruise Ship | 250 |
| Short-haul flight (i.e. within a U.S. state or European country) | 246 |
| Diesel car | 171 |
| Gas car | 170 |
| Medium-haul flight (i.e. international travel within Europe, or between U.S. states) | 151 |
| Long-haul flight (over 3,700 km, about the distance from LA to NY) | 147 |
| Motorbike | 113 |
| Bus (average) | 96 |
| Plug-in hybrid | 68 |
| Electric car | 47 |
| National rail | 35 |
| Tram | 28 |
| London Underground | 27 |
| Ferry (foot passenger) | 19 |
| Eurostar (International rail) | 4.5 |
Are EVs Greener?
Many experts agree that EVs produce a lower carbon footprint over time versus traditional internal combustion engine (ICE) vehicles.
However, the batteries in electric vehicles charge on the power that comes straight off the electrical grid—which in many places may be powered by fossil fuels. For that reason, the carbon footprint of an EV will depend largely on the blend of electricity sources used for charging.
There are also questions about how energy-intensive it is to build EVs compared to a comparable ICE vehicle.

-

 Debt1 week ago
How Debt-to-GDP Ratios Have Changed Since 2000
-

 Markets2 weeks ago
Ranked: The World’s Top Flight Routes, by Revenue
-

 Countries2 weeks ago
Population Projections: The World’s 6 Largest Countries in 2075
-

 Markets2 weeks ago
The Top 10 States by Real GDP Growth in 2023
-

 Demographics2 weeks ago
The Smallest Gender Wage Gaps in OECD Countries
-

 United States2 weeks ago
Where U.S. Inflation Hit the Hardest in March 2024
-

 Green2 weeks ago
Top Countries By Forest Growth Since 2001
-

 United States2 weeks ago
Ranked: The Largest U.S. Corporations by Number of Employees