Datastream
The Accelerating Frequency of Extreme Weather


The Briefing
- We’re already seeing the impact of climate change—today, droughts, heatwaves, and extreme rainstorms are 2x more frequent than they were a century ago
- In less than a decade, Earth’s climate is expected to warm another 0.5°C
- If this happens, heatwaves will be 4.1x more frequent than they were in the 1850-1900s
The Accelerating Frequency of Extreme Weather
The world is already witnessing the effects of climate change.
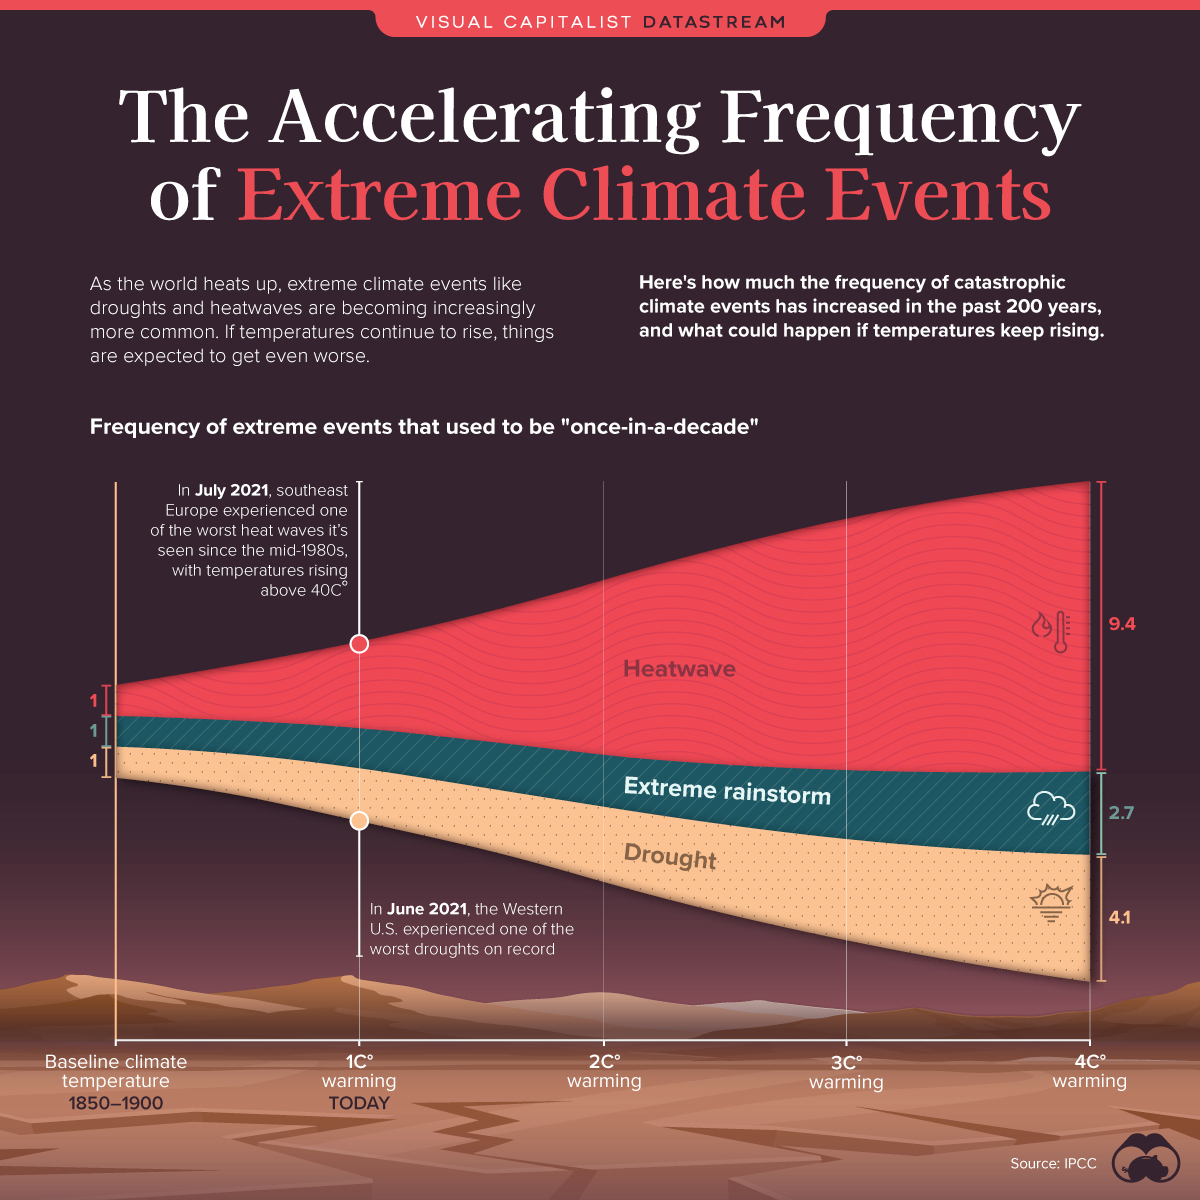
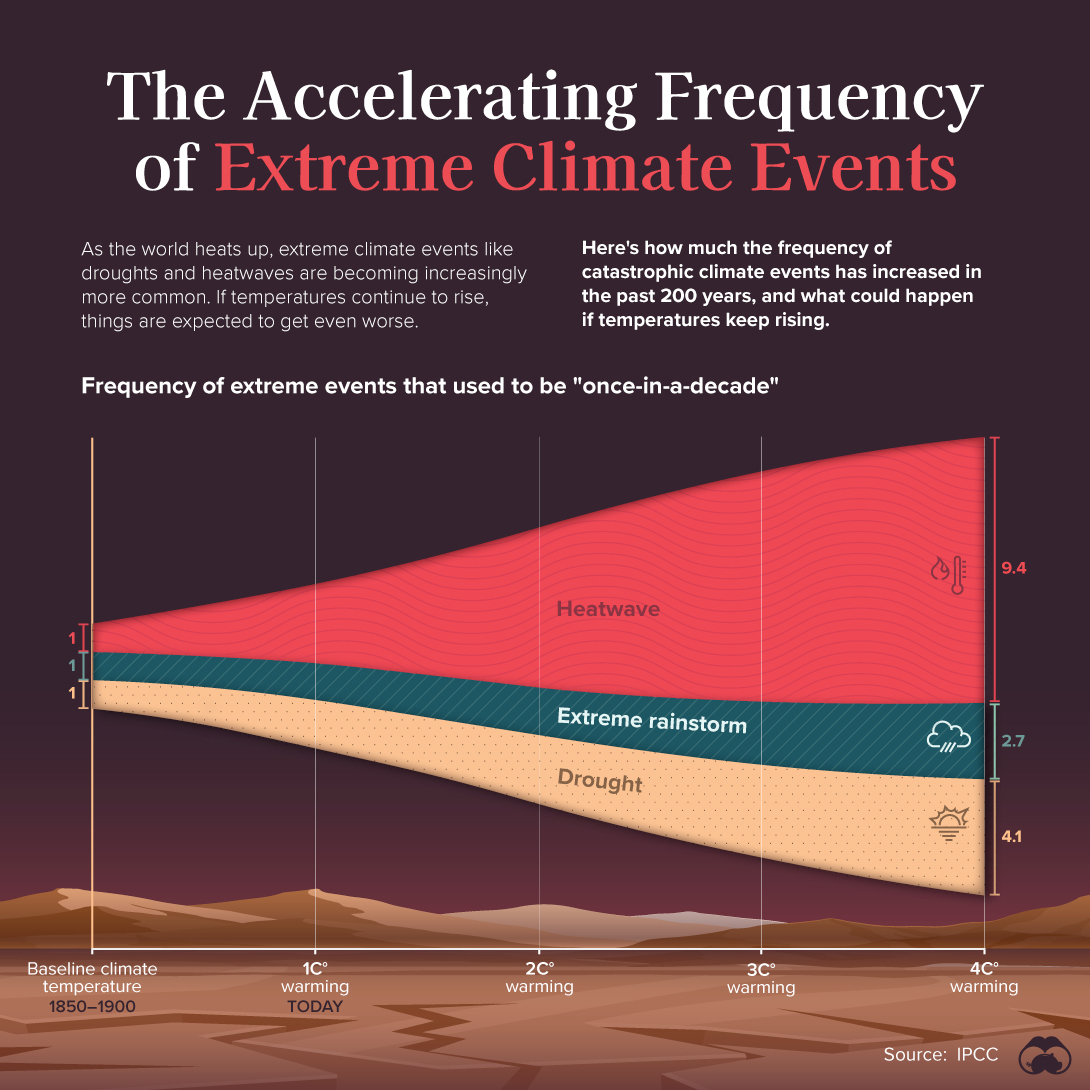
A few months ago, the western U.S. experienced one of the worst droughts it’s seen in the last 20 years. At the same time, southern Europe roasted in an extreme heatwave, with temperatures reaching 45°C in some parts.
But things are only expected to get worse in the near future. Here’s a look at how much extreme climate events have changed over the last 200 years, and what’s to come if global temperatures keep rising.
A Century of Warming
The global surface temperature has increased by about 1°C since the 1850s. And according to the IPCC, this warming has been indisputably caused by human influence.
As the global temperatures have risen, the frequency of extreme weather events have increased along with it. Heatwaves, droughts and extreme rainstorms used to happen once in a decade on average, but now:
- Heatwaves are 2.8x more frequent
- Droughts are 1.7x more frequent
- Extreme rainstorms are 1.3x more frequent
By 2030, the global surface temperature is expected to rise 1.5°C above the Earth’s baseline temperature, which means that:
- Heatwaves would be 4.1x more frequent
- Droughts would be 2x more frequent
- Extreme rainstorms would be 1.5x more frequent
The Ripple Effects of Extreme Weather
Extreme weather events have far-reaching impacts on communities, especially when they cause critical system failures.
Mass infrastructure breakdowns during Hurricane Ida this year caused widespread power outages in the state of Louisiana that lasted for several days. In 2020, wildfires in Syria devastated hundreds of villages and injured dozens of civilians with skin burns and breathing complications.
As extreme weather events continue to increase in frequency, and communities become increasingly more at risk, sound infrastructure is becoming more important than ever.
Where does this data come from?
Source: IPCC
Details: The data used in this graphic is from the IPCC’s Sixth Assessment Report, which provides a high-level summary of the state of the climate, how it’s changing, and the role of human influence.


Datastream
Can You Calculate Your Daily Carbon Footprint?
Discover how the average person’s carbon footprint impacts the environment and learn how carbon credits can offset your carbon footprint.


The Briefing
- A person’s carbon footprint is substantial, with activities such as food consumption creating as much as 4,500 g of CO₂ emissions daily.
- By purchasing carbon credits from Carbon Streaming Corporation, you can offset your own emissions and fund positive climate action.
Your Everyday Carbon Footprint
While many large businesses and countries have committed to net-zero goals, it is essential to acknowledge that your everyday activities also contribute to global emissions.
In this graphic, sponsored by Carbon Streaming Corporation, we will explore how the choices we make and the products we use have a profound impact on our carbon footprint.
Carbon Emissions by Activity
Here are some of the daily activities and products of the average person and their carbon footprint, according to Clever Carbon.
| Household Activities & Products | CO2 Emissions (g) |
|---|---|
| 💡 Standard Light Bulb (100 watts, four hours) | 172 g |
| 📱 Mobile Phone Use (195 minutes per day)* | 189 g |
| 👕 Washing Machine (0.63 kWh) | 275 g |
| 🔥 Electric Oven (1.56 kWh) | 675 g |
| ♨️ Tumble Dryer (2.5 kWh) | 1,000 g |
| 🧻 Toilet Roll (2 ply) | 1,300 g |
| 🚿 Hot Shower (10 mins) | 2,000 g |
| 🚙 Daily Commute (one hour, by car) | 3,360 g |
| 🍽️ Average Daily Food Consumption (three meals of 600 calories) | 4,500 g |
| *Phone use based on yearly use of 69kg per the source, Reboxed | |
Your choice of transportation plays a crucial role in determining your carbon footprint. For instance, a 15 km daily commute to work on public transport generates an average of 1,464 g of CO₂ emissions. Compared to 3,360 g—twice the volume for a journey the same length by car.
By opting for more sustainable modes of transport, such as cycling, walking, or public transportation, you can significantly reduce your carbon footprint.
Addressing Your Carbon Footprint
One way to compensate for your emissions is by purchasing high-quality carbon credits.
Carbon credits are used to help fund projects that avoid, reduce or remove CO₂ emissions. This includes nature-based solutions such as reforestation and improved forest management, or technology-based solutions such as the production of biochar and carbon capture and storage (CCS).
While carbon credits offer a potential solution for individuals to help reduce global emissions, public awareness remains a significant challenge. A BCG-Patch survey revealed that only 34% of U.S. consumers are familiar with carbon credits, and only 3% have purchased them in the past.
About Carbon Streaming
By financing the creation or expansion of carbon projects, Carbon Streaming Corporation secures the rights to future carbon credits generated by these sustainable projects. You can then purchase these carbon credits to help fund climate solutions around the world and compensate for your own emissions.
Ready to get involved?
>> Learn more about purchasing carbon credits at Carbon Streaming

-

 Education1 week ago
How Hard Is It to Get Into an Ivy League School?
-

 Technology2 weeks ago
Ranked: Semiconductor Companies by Industry Revenue Share
-

 Markets2 weeks ago
Ranked: The World’s Top Flight Routes, by Revenue
-

 Demographics2 weeks ago
Population Projections: The World’s 6 Largest Countries in 2075
-

 Markets2 weeks ago
The Top 10 States by Real GDP Growth in 2023
-

 Demographics2 weeks ago
The Smallest Gender Wage Gaps in OECD Countries
-

 Economy2 weeks ago
Where U.S. Inflation Hit the Hardest in March 2024
-

 Green2 weeks ago
Top Countries By Forest Growth Since 2001