Energy
Visualizing the Power Consumption of Bitcoin Mining
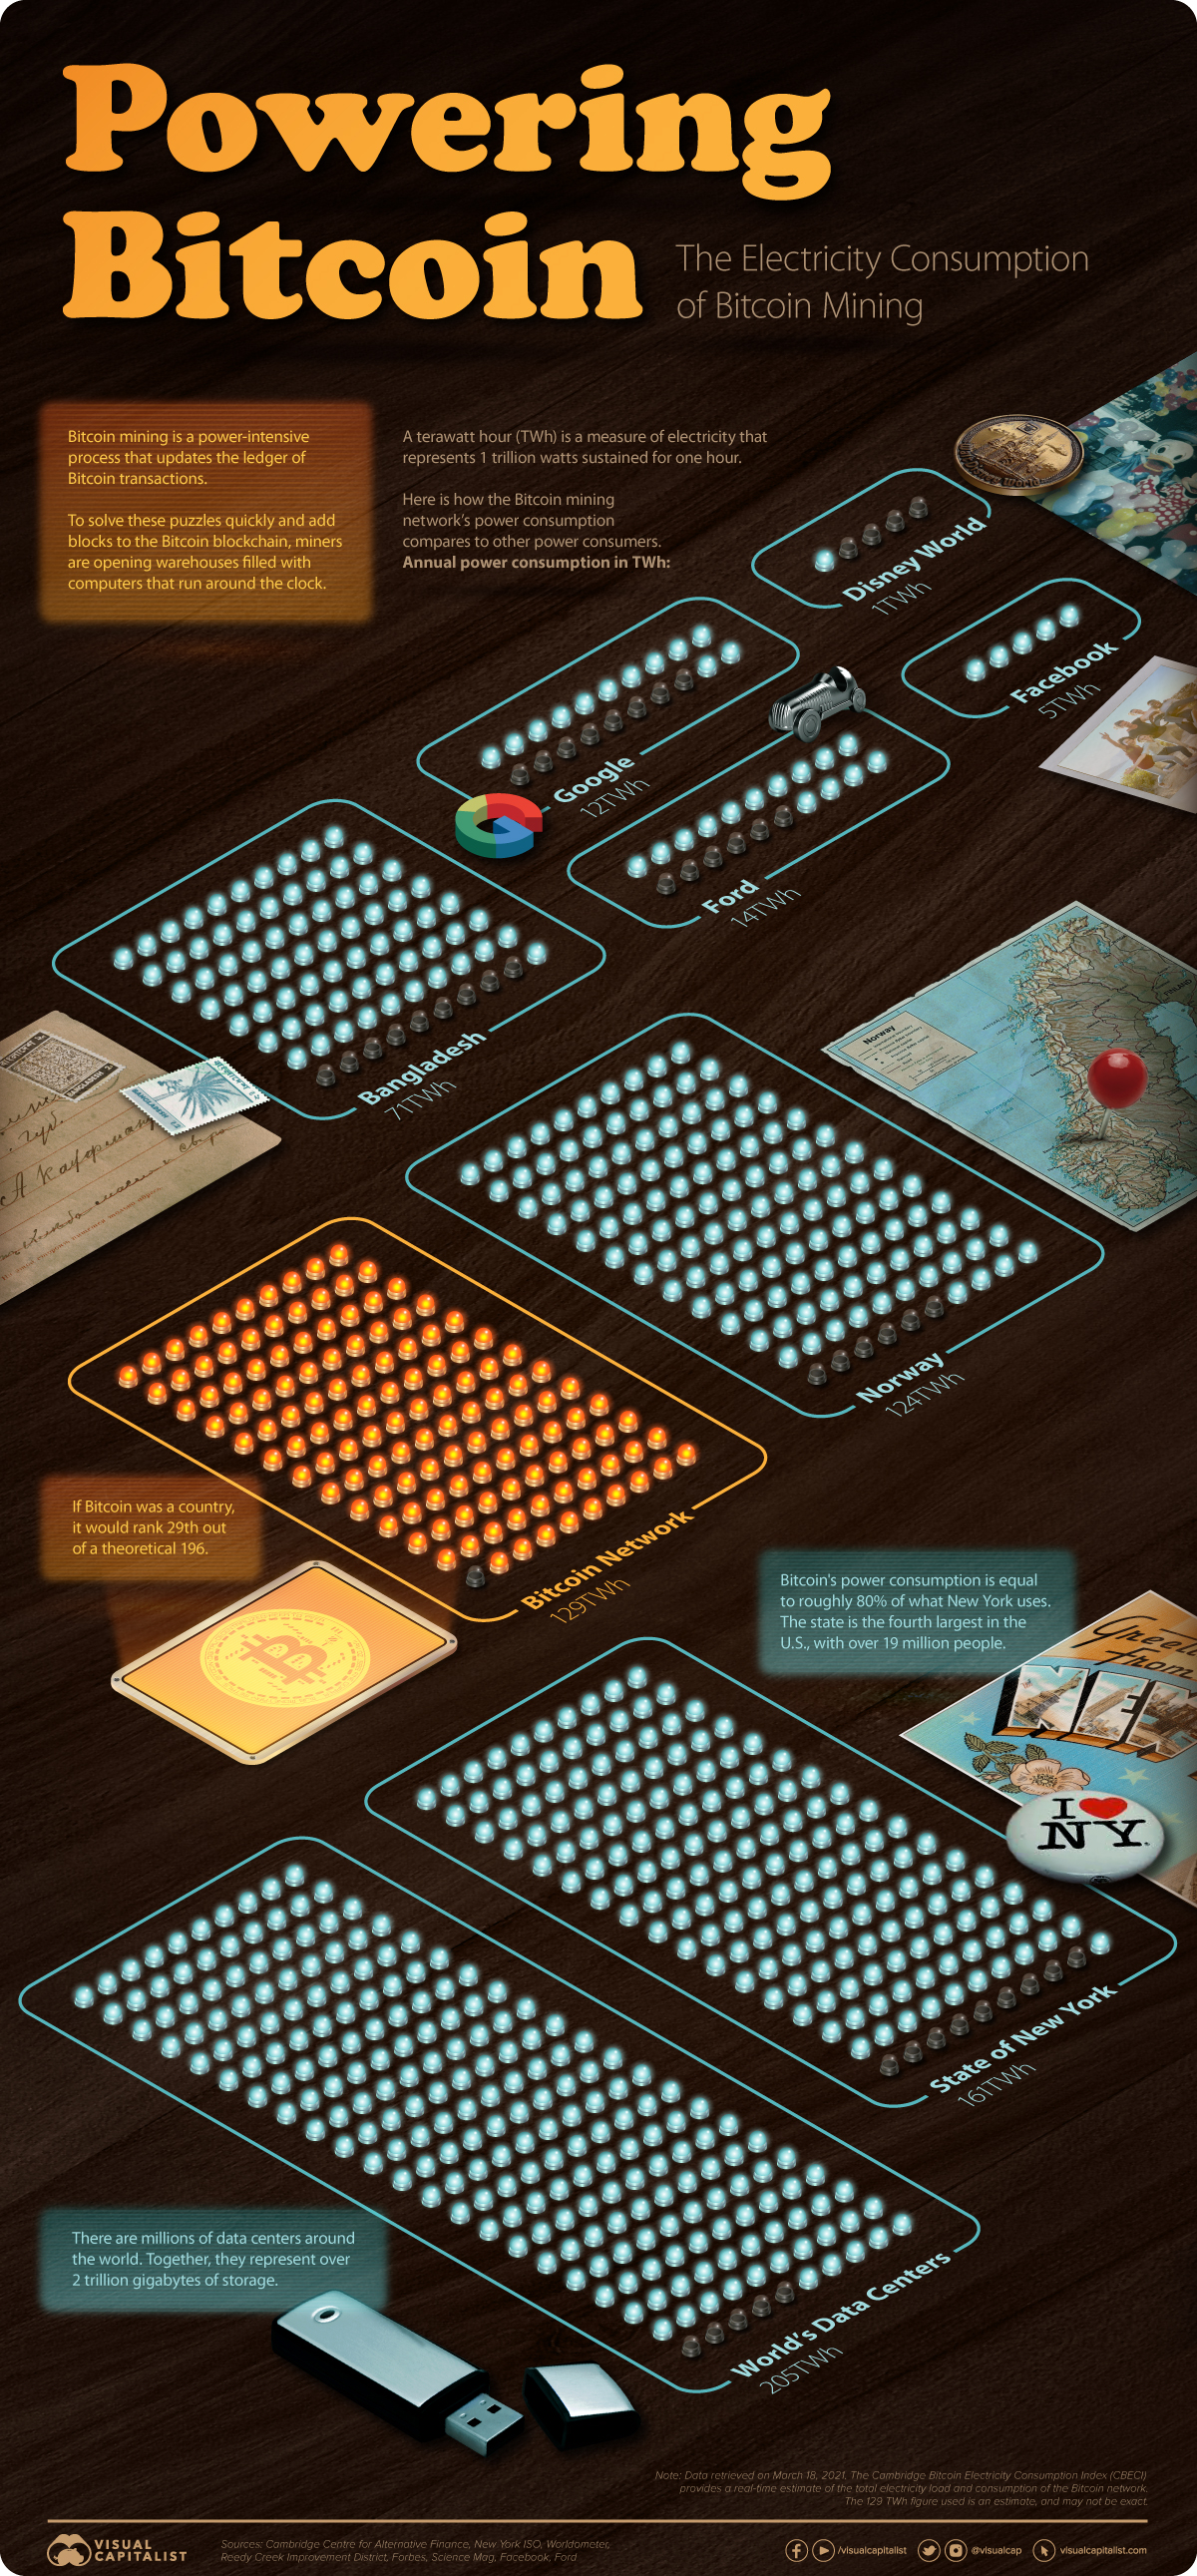


Visualizing the Power Consumption of Bitcoin Mining
Cryptocurrencies have been some of the most talked-about assets in recent months, with bitcoin and ether prices reaching record highs. These gains were driven by a flurry of announcements, including increased adoption by businesses and institutions.
Lesser known, however, is just how much electricity is required to power the Bitcoin network. To put this into perspective, we’ve used data from the University of Cambridge’s Bitcoin Electricity Consumption Index (CBECI) to compare Bitcoin’s power consumption with a variety of countries and companies.
Why Does Bitcoin Mining Require So Much Power?
When people mine bitcoins, what they’re really doing is updating the ledger of Bitcoin transactions, also known as the blockchain. This requires them to solve numerical puzzles which have a 64-digit hexadecimal solution known as a hash.
Miners may be rewarded with bitcoins, but only if they arrive at the solution before others. It is for this reason that Bitcoin mining facilities—warehouses filled with computers—have been popping up around the world.
These facilities enable miners to scale up their hashrate, also known as the number of hashes produced each second. A higher hashrate requires greater amounts of electricity, and in some cases can even overload local infrastructure.
Putting Bitcoin’s Power Consumption Into Perspective
On March 18, 2021, the annual power consumption of the Bitcoin network was estimated to be 129 terawatt-hours (TWh). Here’s how this number compares to a selection of countries, companies, and more.
| Name | Population | Annual Electricity Consumption (TWh) |
|---|---|---|
| China | 1,443M | 6,543 |
| United States | 330.2M | 3,989 |
| All of the world’s data centers | - | 205 |
| State of New York | 19.3M | 161 |
| Bitcoin network | - | 129 |
| Norway | 5.4M | 124 |
| Bangladesh | 165.7M | 70 |
| - | 12 | |
| - | 5 | |
| Walt Disney World Resort (Florida) | - | 1 |
Note: A terawatt hour (TWh) is a measure of electricity that represents 1 trillion watts sustained for one hour.
Source: Cambridge Centre for Alternative Finance, Science Mag, New York ISO, Forbes, Facebook, Reedy Creek Improvement District, Worldometer
If Bitcoin were a country, it would rank 29th out of a theoretical 196, narrowly exceeding Norway’s consumption of 124 TWh. When compared to larger countries like the U.S. (3,989 TWh) and China (6,543 TWh), the cryptocurrency’s energy consumption is relatively light.
For further comparison, the Bitcoin network consumes 1,708% more electricity than Google, but 39% less than all of the world’s data centers—together, these represent over 2 trillion gigabytes of storage.
Where Does This Energy Come From?
In a 2020 report by the University of Cambridge, researchers found that 76% of cryptominers rely on some degree of renewable energy to power their operations. There’s still room for improvement, though, as renewables account for just 39% of cryptomining’s total energy consumption.
Here’s how the share of cryptominers that use each energy type vary across four global regions.
| Energy Source | Asia-Pacific | Europe | Latin America and the Caribbean | North America |
|---|---|---|---|---|
| Hydroelectric | 65% | 60% | 67% | 61% |
| Natural gas | 38% | 33% | 17% | 44% |
| Coal | 65% | 2% | 0% | 28% |
| Wind | 23% | 7% | 0% | 22% |
| Oil | 12% | 7% | 33% | 22% |
| Nuclear | 12% | 7% | 0% | 22% |
| Solar | 12% | 13% | 17% | 17% |
| Geothermal | 8% | 0% | 0% | 6% |
Source: University of Cambridge
Editor’s note: Numbers in each column are not meant to add to 100%
Hydroelectric energy is the most common source globally, and it gets used by at least 60% of cryptominers across all four regions. Other types of clean energy such as wind and solar appear to be less popular.
Coal energy plays a significant role in the Asia-Pacific region, and was the only source to match hydroelectricity in terms of usage. This can be largely attributed to China, which is currently the world’s largest consumer of coal.
Researchers from the University of Cambridge noted that they weren’t surprised by these findings, as the Chinese government’s strategy to ensure energy self-sufficiency has led to an oversupply of both hydroelectric and coal power plants.
Towards a Greener Crypto Future
As cryptocurrencies move further into the mainstream, it’s likely that governments and other regulators will turn their attention to the industry’s carbon footprint. This isn’t necessarily a bad thing, however.
Mike Colyer, CEO of Foundry, a blockchain financing provider, believes that cryptomining can support the global transition to renewable energy. More specifically, he believes that clustering cryptomining facilities near renewable energy projects can mitigate a common issue: an oversupply of electricity.
“It allows for a faster payback on solar projects or wind projects… because they would [otherwise] produce too much energy for the grid in that area”
– Mike Colyer, CEO, Foundry
This type of thinking appears to be taking hold in China as well. In April 2020, Ya’an, a city located in China’s Sichuan province, issued a public guidance encouraging blockchain firms to take advantage of its excess hydroelectricity.


Energy
Charted: 4 Reasons Why Lithium Could Be the Next Gold Rush
Visual Capitalist has partnered with EnergyX to show why drops in prices and growing demand may make now the right time to invest in lithium.


4 Reasons Why You Should Invest in Lithium
Lithium’s importance in powering EVs makes it a linchpin of the clean energy transition and one of the world’s most precious minerals.
In this graphic, Visual Capitalist partnered with EnergyX to explore why now may be the time to invest in lithium.
1. Lithium Prices Have Dropped
One of the most critical aspects of evaluating an investment is ensuring that the asset’s value is higher than its price would indicate. Lithium is integral to powering EVs, and, prices have fallen fast over the last year:
| Date | LiOH·H₂O* | Li₂CO₃** |
|---|---|---|
| Feb 2023 | $76 | $71 |
| March 2023 | $71 | $61 |
| Apr 2023 | $43 | $33 |
| May 2023 | $43 | $33 |
| June 2023 | $47 | $45 |
| July 2023 | $44 | $40 |
| Aug 2023 | $35 | $35 |
| Sept 2023 | $28 | $27 |
| Oct 2023 | $24 | $23 |
| Nov 2023 | $21 | $21 |
| Dec 2023 | $17 | $16 |
| Jan 2024 | $14 | $15 |
| Feb 2024 | $13 | $14 |
Note: Monthly spot prices were taken as close to the 14th of each month as possible.
*Lithium hydroxide monohydrate MB-LI-0033
**Lithium carbonate MB-LI-0029
2. Lithium-Ion Battery Prices Are Also Falling
The drop in lithium prices is just one reason to invest in the metal. Increasing economies of scale, coupled with low commodity prices, have caused the cost of lithium-ion batteries to drop significantly as well.
In fact, BNEF reports that between 2013 and 2023, the price of a Li-ion battery dropped by 82%.
| Year | Price per KWh |
|---|---|
| 2023 | $139 |
| 2022 | $161 |
| 2021 | $150 |
| 2020 | $160 |
| 2019 | $183 |
| 2018 | $211 |
| 2017 | $258 |
| 2016 | $345 |
| 2015 | $448 |
| 2014 | $692 |
| 2013 | $780 |

3. EV Adoption is Sustainable
One of the best reasons to invest in lithium is that EVs, one of the main drivers behind the demand for lithium, have reached a price point similar to that of traditional vehicle.
According to the Kelly Blue Book, Tesla’s average transaction price dropped by 25% between 2022 and 2023, bringing it in line with many other major manufacturers and showing that EVs are a realistic transport option from a consumer price perspective.
| Manufacturer | September 2022 | September 2023 |
|---|---|---|
| BMW | $69,000 | $72,000 |
| Ford | $54,000 | $56,000 |
| Volkswagon | $54,000 | $56,000 |
| General Motors | $52,000 | $53,000 |
| Tesla | $68,000 | $51,000 |
4. Electricity Demand in Transport is Growing
As EVs become an accessible transport option, there’s an investment opportunity in lithium. But possibly the best reason to invest in lithium is that the IEA reports global demand for the electricity in transport could grow dramatically by 2030:
| Transport Type | 2022 | 2025 | 2030 |
|---|---|---|---|
| Buses 🚌 | 23,000 GWh | 50,000 GWh | 130,000 GWh |
| Cars 🚙 | 65,000 GWh | 200,000 GWh | 570,000 GWh |
| Trucks 🛻 | 4,000 GWh | 15,000 GWh | 94,000 GWh |
| Vans 🚐 | 6,000 GWh | 16,000 GWh | 72,000 GWh |
The Lithium Investment Opportunity
Lithium presents a potentially classic investment opportunity. Lithium and battery prices have dropped significantly, and recently, EVs have reached a price point similar to other vehicles. By 2030, the demand for clean energy, especially in transport, will grow dramatically.
With prices dropping and demand skyrocketing, now is the time to invest in lithium.
EnergyX is poised to exploit lithium demand with cutting-edge lithium extraction technology capable of extracting 300% more lithium than current processes.

-

 Lithium4 days ago
Ranked: The Top 10 EV Battery Manufacturers in 2023
Asia dominates this ranking of the world’s largest EV battery manufacturers in 2023.
-

 Energy1 week ago
The World’s Biggest Nuclear Energy Producers
China has grown its nuclear capacity over the last decade, now ranking second on the list of top nuclear energy producers.
-

 Energy1 month ago
The World’s Biggest Oil Producers in 2023
Just three countries accounted for 40% of global oil production last year.
-

 Energy1 month ago
How Much Does the U.S. Depend on Russian Uranium?
Currently, Russia is the largest foreign supplier of nuclear power fuel to the U.S.
-

 Uranium2 months ago
Charted: Global Uranium Reserves, by Country
We visualize the distribution of the world’s uranium reserves by country, with 3 countries accounting for more than half of total reserves.
-

 Energy3 months ago
Visualizing the Rise of the U.S. as Top Crude Oil Producer
Over the last decade, the United States has established itself as the world’s top producer of crude oil, surpassing Saudi Arabia and Russia.

-

 Education1 week ago
How Hard Is It to Get Into an Ivy League School?
-

 Technology2 weeks ago
Ranked: Semiconductor Companies by Industry Revenue Share
-

 Markets2 weeks ago
Ranked: The World’s Top Flight Routes, by Revenue
-

 Demographics2 weeks ago
Population Projections: The World’s 6 Largest Countries in 2075
-

 Markets2 weeks ago
The Top 10 States by Real GDP Growth in 2023
-

 Demographics2 weeks ago
The Smallest Gender Wage Gaps in OECD Countries
-

 Economy2 weeks ago
Where U.S. Inflation Hit the Hardest in March 2024
-

 Environment2 weeks ago
Top Countries By Forest Growth Since 2001