Green
UN Sustainable Development Goals: How Companies Stack Up
The UN SDGs: How Companies Stack Up
Environmental, social, and governance (ESG) investing witnessed a breakthrough year in 2020 with the most fund inflows on record.
Importantly, for companies that are judged according to ESG metrics, one way to track their progress is through their alignment to the UN Sustainable Development Goals (SDGs).
Established in 2012, the UN SDGs are a blueprint for creating a more sustainable future by 2030 that have been adopted by 193 countries worldwide.
As investors and stakeholders pay closer attention to sustainability concerns, this graphic from MSCI breaks down how companies stack up according to their alignment to the UN SDGs.
How Were Companies Measured?
To track companies net contribution to the UN SDGs, companies were scored by their positive or negative contribution to each of the 17 goals.
The 17 UN SDGs are designed to achieve three primary objectives by 2030:
- Protect the planet
- End poverty
- Create prosperity and peace for all
Specifically, the framework centers on a discussion paper that was developed in partnership with the OECD in 2018. Company policies, operations, products and services, and practices are analyzed according to reported and publicly available information.
Tracking the Alignment of Companies
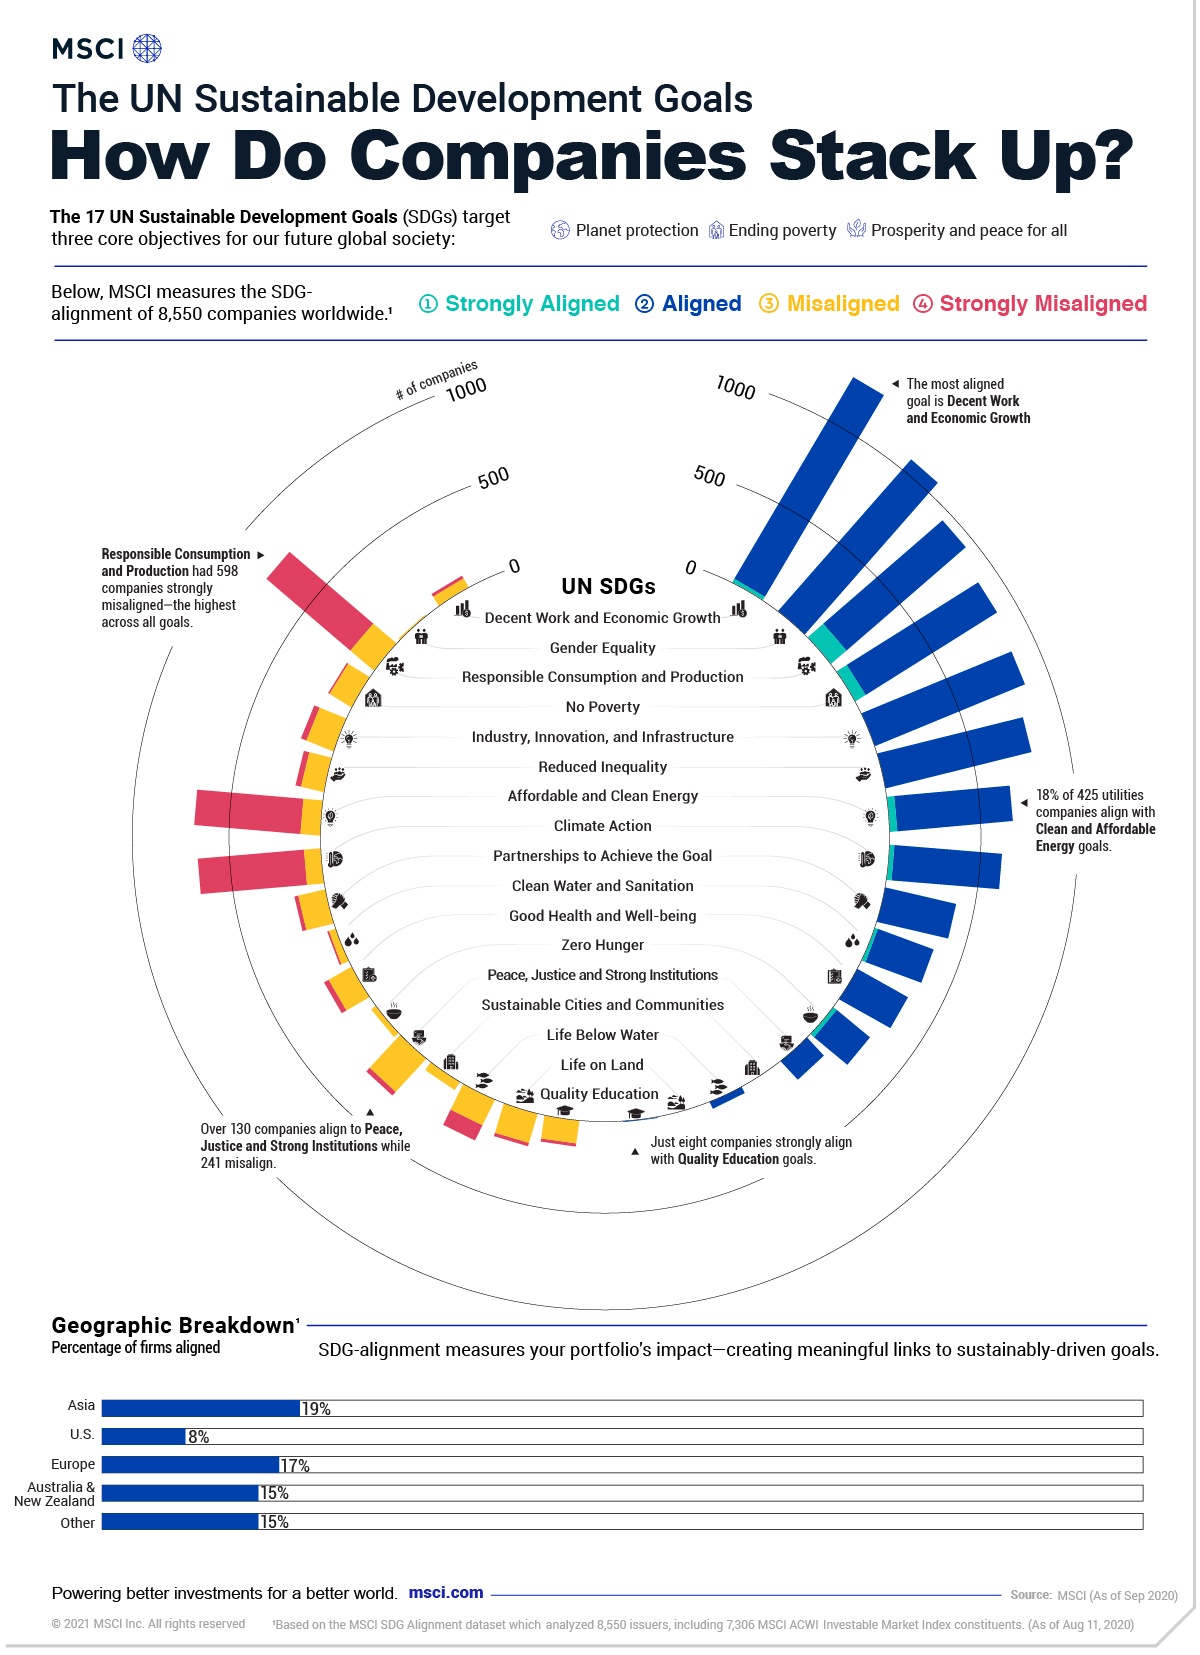
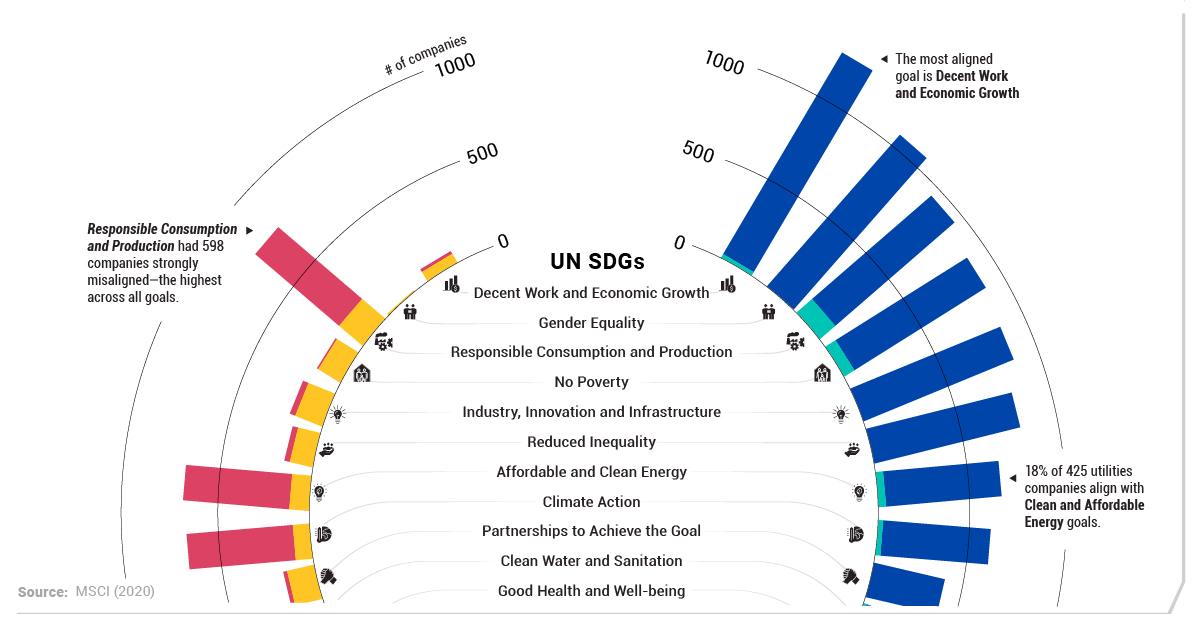
Across a universe of 8,550 companies in the MSCI All Country World Index, constituents were measured from strongly aligned to strongly misaligned to the UN SDGs.
| Sustainable Development Goal | Strongly Aligned | Aligned | Misaligned | Strongly Misaligned |
|
|---|---|---|---|---|---|
| 1 | No Poverty | 0 | 892 | 155 | 32 |
| 2 | Zero Hunger | 24 | 234 | 30 | 0 |
| 3 | Good Health and Well-being | 0 | 315 | 141 | 29 |
| 4 | Quality Education | 8 | 31 | 52 | 0 |
| 5 | Gender Equality | 0 | 1092 | 9 | 0 |
| 6 | Clean Water and Sanitation | 17 | 325 | 36 | 10 |
| 7 | Affordable and Clean Energy | 43 | 639 | 109 | 587 |
| 8 | Decent Work and Economic Growth | 25 | 1269 | 52 | 17 |
| 9 | Industry, Innovation, and Infrastructure | 68 | 844 | 137 | 9 |
| 10 | Reduced Inequality | 0 | 828 | 127 | 31 |
| 11 | Sustainable Cities and Communities | 0 | 0 | 167 | 19 |
| 12 | Responsible Consumption and Production | 115 | 855 | 150 | 598 |
| 13 | Climate Action | 27 | 594 | 95 | 587 |
| 14 | Life Below Water | 0 | 36 | 151 | 92 |
| 15 | Life on Land | 0 | 0 | 128 | 17 |
| 16 | Peace and Justice Strong Institutions | 0 | 135 | 241 | 27 |
| 17 | Partnerships to Achieve the Goal | 0 | 401 | 152 | 22 |
Source: MSCI ESG Research LLC as of August 11, 2020
Broadly speaking, companies fell mostly in the middle—roughly 38% were aligned while almost 55% were misaligned or neutral. Meanwhile, just 0.2% of companies were strongly aligned to the UN SDGs.
Overall, one of the most strongly aligned goals was Responsible Production and Consumption, with 115 companies meeting this criteria. Specifically, these include companies that are building sustainable infrastructure, energy efficiency, or creating green jobs.
Interestingly, the worst performing goal was also Responsible Production and Consumption, with over five times as many companies (598) strongly misaligned. Along with this goal, both Climate Action and Affordable and Clean Energy each had over 500 companies strongly misaligned.
UN SDGs: A Sector Focus
Unsurprisingly, SDG-alignment varied widely according to company sectors.
Educational companies, for instance, represented the highest level of alignment to Gender Equality. Meanwhile, 18% of 425 utilities companies assessed ended up aligning with Clean and Affordable Energy goals.
As one would expect, the energy sector lagged behind. In 2020, fossil fuels were a key source of revenue for 91% of the companies in the energy business. In fact, just three companies derived over 50% of their revenues from green alternatives: REX American Resources, Renewable Energy Group, and Verbio.
A Call to Action?
Despite the growing wave of interest in ESG investing, the reality is that progress to meet the UN SDGs has been slower going than expected.
However, a greater number of individuals, stakeholders, and activists are sounding the alarm. Today, over 3,000 signatories representing trillions in assets under management have committed to the UN Principles of Responsible Investment, which has established six key actions for ESG investing. Now, many companies are required to report their ESG disclosures in Europe.
Along with these key markers of progress, investors can move the dial by tracking a company’s alignment to sustainable development goals.


Green
The Carbon Footprint of Major Travel Methods
Going on a cruise ship and flying domestically are the most carbon-intensive travel methods.


The Carbon Footprint of Major Travel Methods
This was originally posted on our Voronoi app. Download the app for free on iOS or Android and discover incredible data-driven charts from a variety of trusted sources.
Did you know that transport accounts for nearly one-quarter of global energy-related carbon dioxide (CO₂) emissions?
This graphic illustrates the carbon footprints of major travel methods measured in grams of carbon dioxide equivalent (CO₂e) emitted per person to travel one kilometer. This includes both CO₂ and other greenhouse gases.
Data is sourced from Our World in Data, the UK Government’s Department for Energy Security and Net Zero, and The International Council on Clean Transportation, as of December 2022.
These figures should be interpreted as approximations, rather than exact numbers. There are many variables at play that determine the actual carbon footprint in any individual case, including vehicle type or model, occupancy, energy mix, and even weather.
Cruise Ships are the Most Carbon-Intensive Travel Method
According to these estimates, taking a cruise ship, flying domestically, and driving alone are some of the most carbon-intensive travel methods.
Cruise ships typically use heavy fuel oil, which is high in carbon content. The average cruise ship weighs between 70,000 to 180,000 metric tons, meaning they require large engines to get moving.
These massive vessels must also generate power for onboard amenities such as lighting, air conditioning, and entertainment systems.
Short-haul flights are also considered carbon-intensive due to the significant amount of fuel consumed during initial takeoff and climbing altitude, relative to a lower amount of cruising.
| Transportation method | CO₂ equivalent emissions per passenger km |
|---|---|
| Cruise Ship | 250 |
| Short-haul flight (i.e. within a U.S. state or European country) | 246 |
| Diesel car | 171 |
| Gas car | 170 |
| Medium-haul flight (i.e. international travel within Europe, or between U.S. states) | 151 |
| Long-haul flight (over 3,700 km, about the distance from LA to NY) | 147 |
| Motorbike | 113 |
| Bus (average) | 96 |
| Plug-in hybrid | 68 |
| Electric car | 47 |
| National rail | 35 |
| Tram | 28 |
| London Underground | 27 |
| Ferry (foot passenger) | 19 |
| Eurostar (International rail) | 4.5 |
Are EVs Greener?
Many experts agree that EVs produce a lower carbon footprint over time versus traditional internal combustion engine (ICE) vehicles.
However, the batteries in electric vehicles charge on the power that comes straight off the electrical grid—which in many places may be powered by fossil fuels. For that reason, the carbon footprint of an EV will depend largely on the blend of electricity sources used for charging.
There are also questions about how energy-intensive it is to build EVs compared to a comparable ICE vehicle.

-

 Brands6 days ago
How Tech Logos Have Evolved Over Time
-

 Demographics2 weeks ago
The Smallest Gender Wage Gaps in OECD Countries
-

 Economy2 weeks ago
Where U.S. Inflation Hit the Hardest in March 2024
-

 Green2 weeks ago
Top Countries By Forest Growth Since 2001
-

 United States2 weeks ago
Ranked: The Largest U.S. Corporations by Number of Employees
-

 Maps2 weeks ago
The Largest Earthquakes in the New York Area (1970-2024)
-

 Green2 weeks ago
Ranked: The Countries With the Most Air Pollution in 2023
-

 Green2 weeks ago
Ranking the Top 15 Countries by Carbon Tax Revenue