Investor Education
ESG Investing: Finding Your Motivation
ESG Investing: Finding Your Motivation
Environmental, social, and governance (ESG) factors are a set of criteria that can be used to rate companies alongside traditional financial metrics.
Awareness around this practice has risen substantially in recent years, but how can investors determine if it’s a good fit for their portfolio?
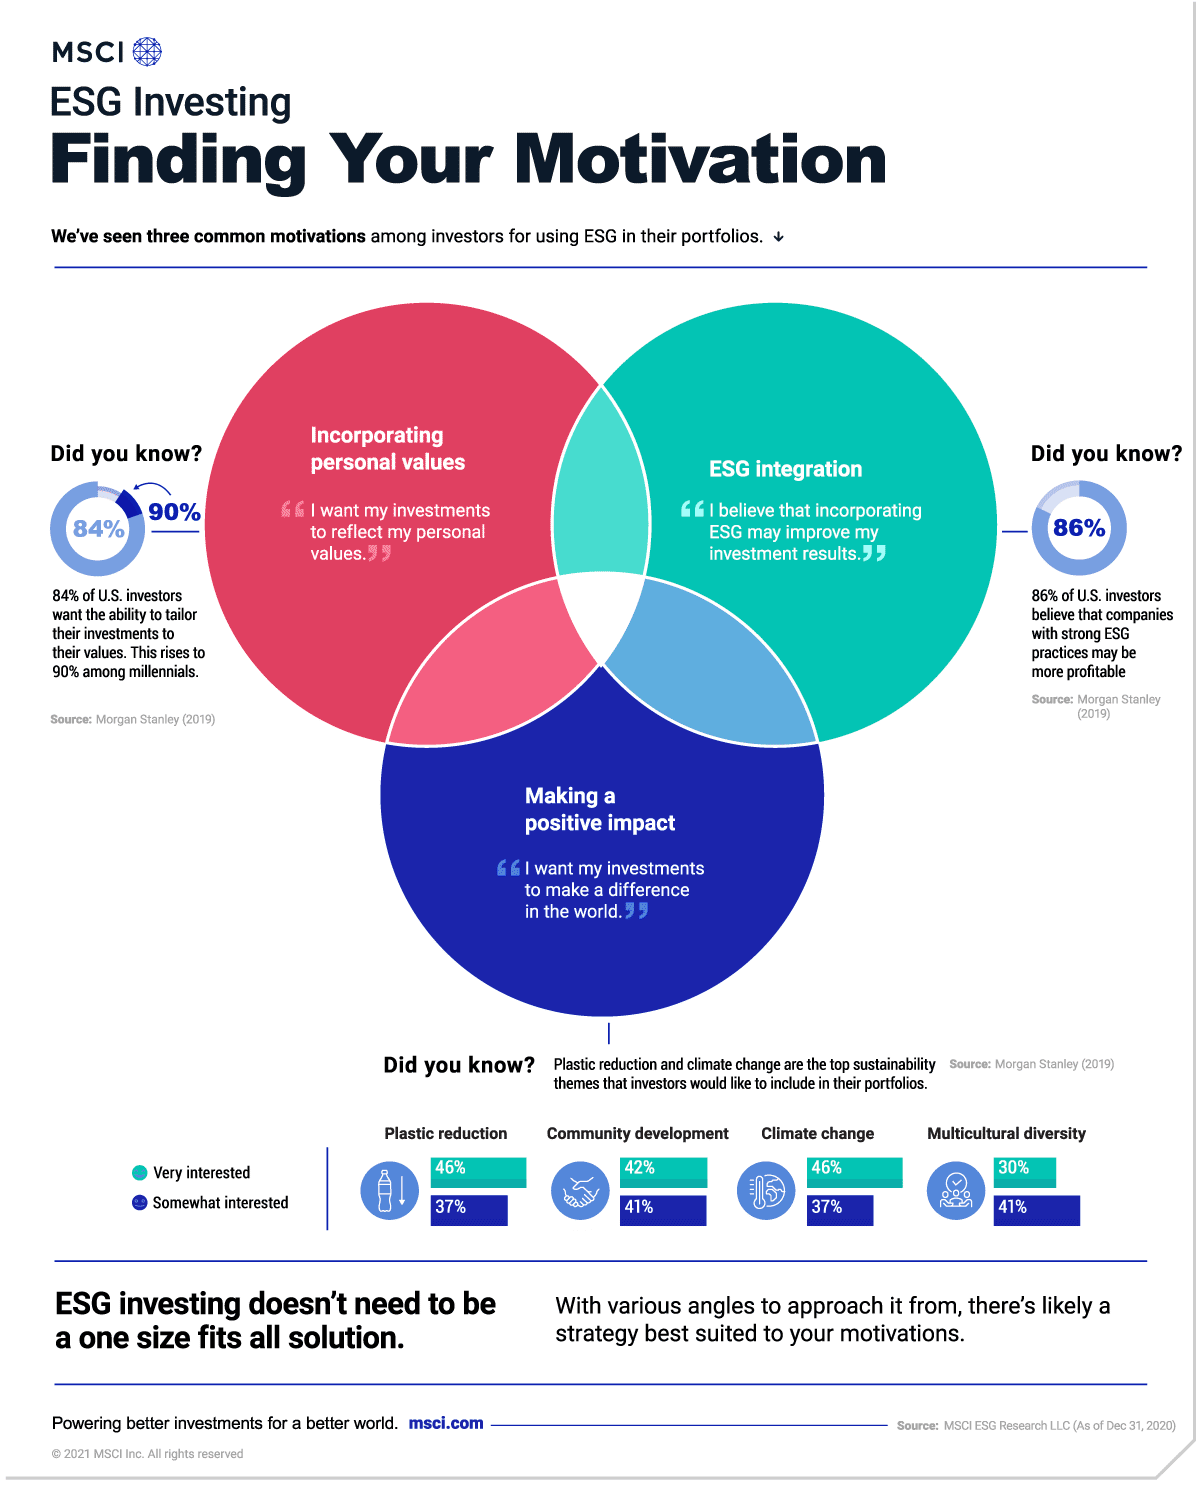
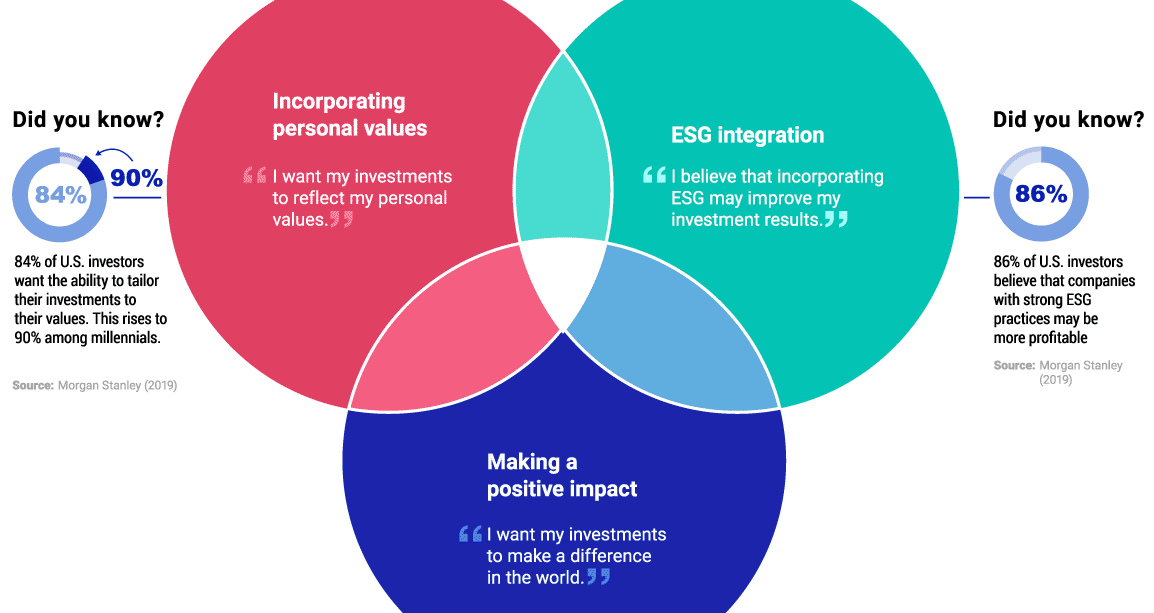
To answer this question, MSCI has identified three common motivations for using ESG in one’s portfolio, which have been outlined in the graphic above.
The Three Motivators
According to this research, the three primary motivations for ESG investing are defined as ESG integration, incorporating personal values, and making a positive impact.
These goals are not mutually exclusive, though, and an investor may relate to more than just one.
#1: ESG Integration
This motivation refers to investors who believe that using ESG can improve their portfolio’s long-term results. One way this can be achieved is by investing in companies that have the strongest environmental, social, and governance practices within their industry.
These companies are referred to as “ESG leaders”, while companies at the opposite end of the scale are known as “ESG laggards”. From a social perspective, an ESG leader could be a firm that promotes diversity and inclusion, while an ESG laggard could be a company with a history of labor strikes.
To show how ESG integration may lead to better long-term results, we’ve compared the performance of the MSCI ACWI ESG Leaders Index with its standard counterpart, the MSCI ACWI Index, which represents the full opportunity set of large- and mid-cap stocks across developed and emerging markets.
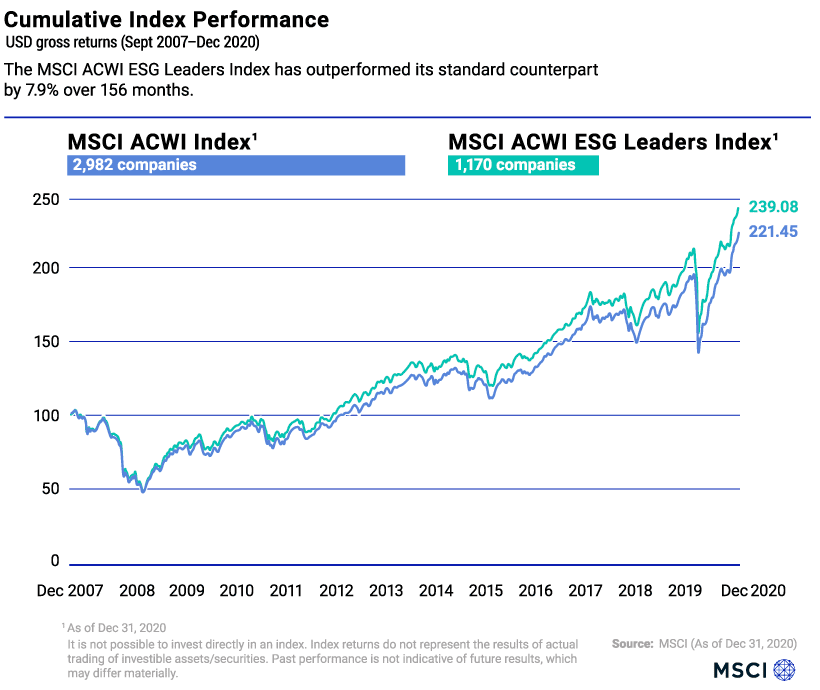
The MSCI ACWI ESG Leaders Index targets companies that have the highest ESG rated performance in each sector of its standard counterpart. The result is an index with a smaller number of underlying companies (1,170 versus 2,982), and a relative outperformance of 7.9% over 156 months.
#2: Incorporating Personal Values
ESG investing is also a powerful tool for investors who wish to align their financial decisions with their personal values. This can be achieved through the use of negative screens, which identify and exclude companies that have exposure to specific ESG issues.
To see how this works, we’ve illustrated the differences between the MSCI World ESG Screened Index and its standard counterpart, the MSCI World Index.
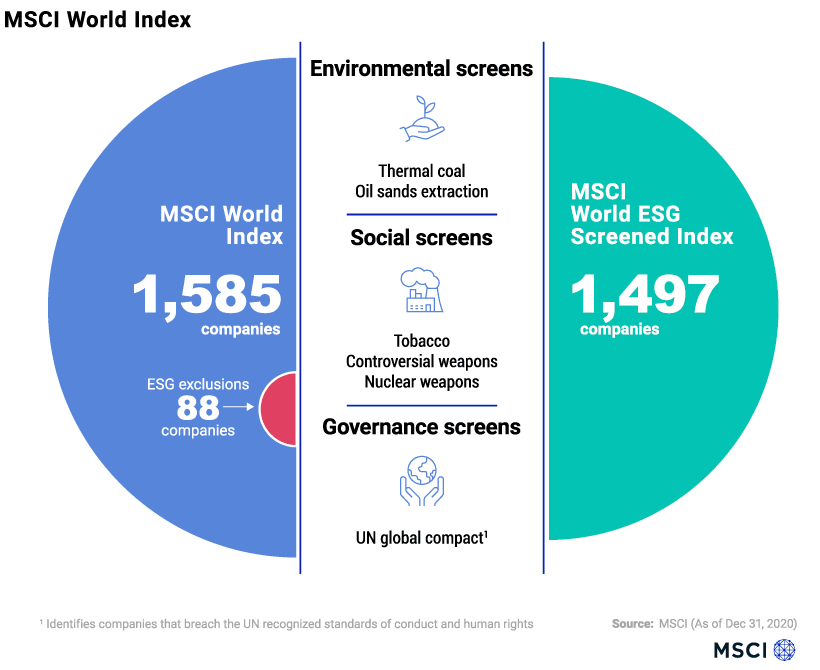
The MSCI World ESG Screened Index excludes companies that are associated with controversial weapons, tobacco, fossil fuels, and those that are not in compliance with the UN Global Compact. The UN Global Compact is a corporate sustainability initiative that focuses on issues such as human rights and corruption.
#3: Making a Positive Impact
The third motivation for using ESG is the desire to make a positive impact through one’s investments. Also known as impact investing, this practice enables investors to merge financial gains with environmental or social progress.
Investors have a variety of tools to help them in this regard, such as the MSCI Women’s Leadership Index, which tracks companies that exhibit a commitment towards gender diversity. Green bonds, bonds that are issued to raise money for environmental projects, are another option for investors looking to drive positive change.
ESG Investing For All
With various angles to approach it from, ESG investing is likely to appeal to a majority of investors. In fact, a 2019 survey found that 84% of U.S. investors want the ability to tailor their investments to their values. Likewise, 86% of them believe that companies with strong ESG practices may be more profitable.
Results like these underscore the high demand that U.S. investors have for ESG investing—between 2018 and 2020, ESG-related assets grew 42% to reach $17 trillion, and now represent 33% of total U.S. assets under management.


Investor Education
How MSCI Builds Thematic Indexes: A Step-by-Step Guide
From developing an index objective to choosing relevant stocks, this graphic breaks down how MSCI builds thematic indexes using examples.


How MSCI Builds Thematic Indexes: A Step-by-Step Guide
Have you ever wondered how MSCI builds its thematic indexes?
To capture long-term, structural trends that could drive business performance in the future, the company follows a systematic approach. This graphic from MSCI breaks down each step in the process used to create its thematic indexes.
Step 1: Develop an Index Objective
MSCI first builds a broad statement of what the theme aims to capture based on extensive research and insights from industry experts.
Steps 2 and 3: List Sub-Themes, Generate Keyword List
Together with experts, MSCI creates a list of sub-themes or “seedwords” to identify aligned business activities.
The team then assembles a collection of suitable documents describing the theme. Natural language processing efficiently analyzes word frequency and relevance to generate a more detailed set of keywords contextually similar to the seedwords.
Step 4: Find Relevant Companies
By analyzing financial reports, MSCI picks companies relevant to the theme using two methods:
- Direct approach: Revenue from a company’s business segment is considered 100% relevant if the segment name matches a theme keyword. Standard Industrial Classification (SIC) codes from these directly-matched segments make up the eligible SIC code list used in the indirect approach.
- Indirect approach: If a segment name doesn’t match theme keywords, MSCI will:
- Analyze the density of theme keywords mentioned in the company’s description. A minimum of two unique keywords is required.
- The keyword density determines a “discount factor” to reflect lower certainty in theme alignment.
- Revenue from business segments with an eligible SIC code, regardless of how they are named, is scaled down by the discount factor.
The total percentage of revenue applicable to the theme from both approaches determines a company’s relevance score.
Step 5: Select the Stocks
Finally, MSCI narrows down the stocks that will be included:
- Global parent universe: The ACWI Investable Market Index (IMI) is the starting point for standard thematic indexes.
- Relevance filter: The universe is filtered for companies with a relevance score of at least 25%.
- False positive control: Eligible companies that are mapped to un-related GICS sub-industries are removed.
Companies with higher relevance scores and market caps have a higher weighting in the index, with the maximum weighting for any one issuer capped at 5%. The final selected stocks span various sectors.
MSCI Thematic Indexes: Regularly Updated and Rules-Based
Once an index is built, it is reviewed semi-annually and updated based on:
- Changes to the parent index
- Changes at individual companies
- Theme developments based on expert input
Theme keywords are reviewed yearly in May. Overall, MSCI’s thematic index construction process is objective, scalable, and flexible. The process can be customized based on the theme(s) you want to capture.
Learn more about MSCI’s thematic indexes.

-

 Investor Education6 months ago
The 20 Most Common Investing Mistakes, in One Chart
Here are the most common investing mistakes to avoid, from emotionally-driven investing to paying too much in fees.
-

 Stocks10 months ago
Visualizing BlackRock’s Top Equity Holdings
BlackRock is the world’s largest asset manager, with over $9 trillion in holdings. Here are the company’s top equity holdings.
-

 Investor Education11 months ago
10-Year Annualized Forecasts for Major Asset Classes
This infographic visualizes 10-year annualized forecasts for both equities and fixed income using data from Vanguard.
-

 Investor Education1 year ago
Visualizing 90 Years of Stock and Bond Portfolio Performance
How have investment returns for different portfolio allocations of stocks and bonds compared over the last 90 years?
-

 Debt2 years ago
Countries with the Highest Default Risk in 2022
In this infographic, we examine new data that ranks the top 25 countries by their default risk.
-

 Markets2 years ago
The Best Months for Stock Market Gains
This infographic analyzes over 30 years of stock market performance to identify the best and worst months for gains.

-

 Energy1 week ago
The World’s Biggest Nuclear Energy Producers
-

 Money2 weeks ago
Which States Have the Highest Minimum Wage in America?
-

 Technology2 weeks ago
Ranked: Semiconductor Companies by Industry Revenue Share
-

 Markets2 weeks ago
Ranked: The World’s Top Flight Routes, by Revenue
-

 Countries2 weeks ago
Population Projections: The World’s 6 Largest Countries in 2075
-

 Markets2 weeks ago
The Top 10 States by Real GDP Growth in 2023
-

 Demographics2 weeks ago
The Smallest Gender Wage Gaps in OECD Countries
-

 United States2 weeks ago
Where U.S. Inflation Hit the Hardest in March 2024