Markets
World Beer Index 2021: What’s the Beer Price in Your Country?
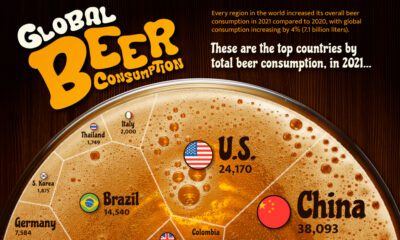
What’s the Beer Price in Your Country?
Although fewer people have been able to grab a beer at the pub during this pandemic, the global desire for beer prevails. For example, sales of the Corona beer actually shot up in the past year, despite—or perhaps because of—associations with the coronavirus.
This World Beer Index from Expensivity compares the average price of a bottle of beer in 58 countries in a detailed map. Additionally, we show which countries spend the most on beer per capita, and just how much beer people really drink.
Pricey Pints: The Average Beer Price
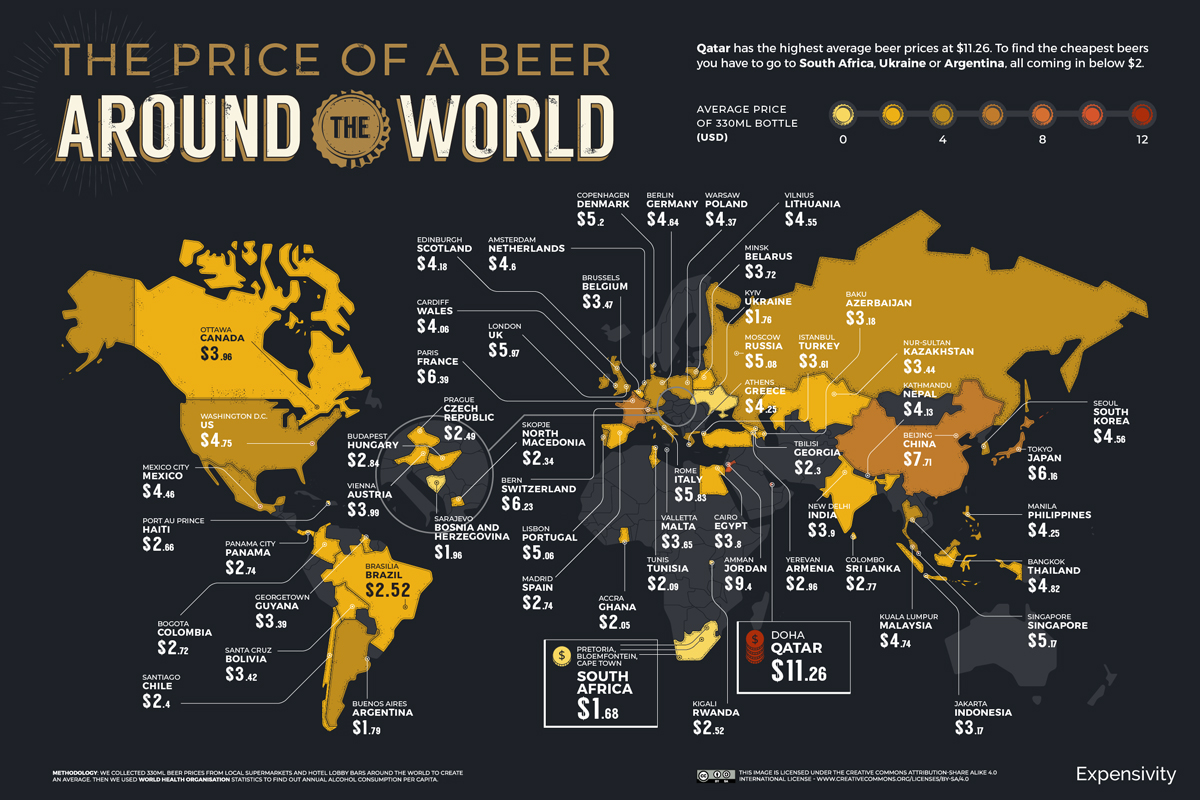
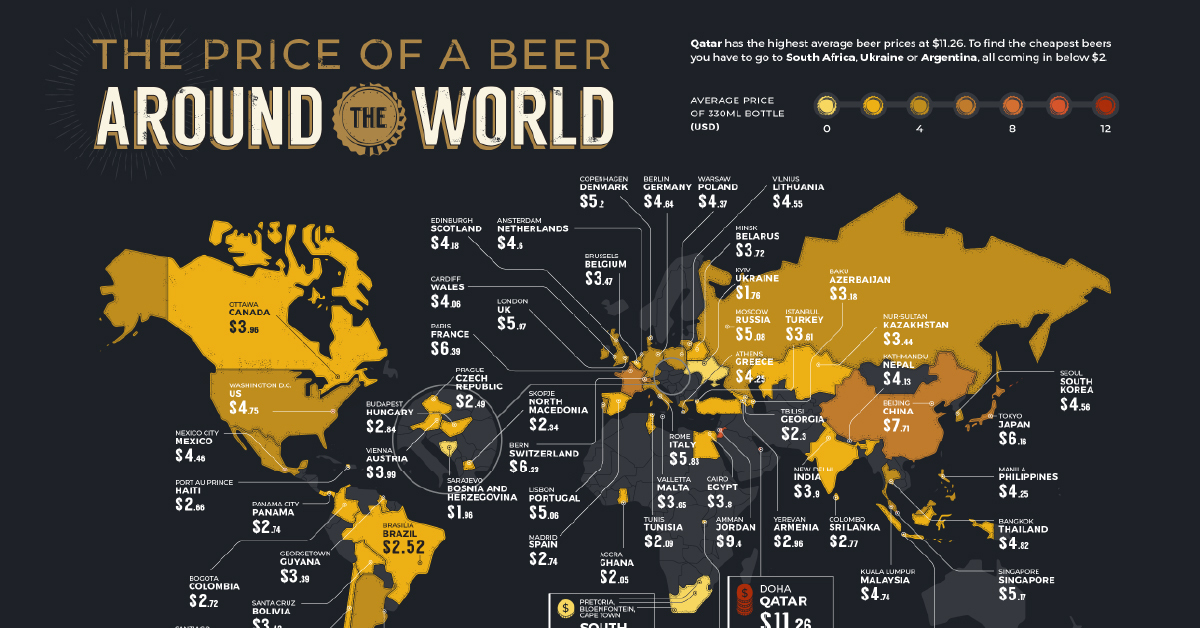
Researchers calculated the average price of a typical bottle of beer (330ml, just shy of a pint) from well known brands via online stores and statistics database Numbeo. In addition, local beer prices were pulled from hotel and bar menus, and average values converted to USD.
In Qatar, you’d have to shell out $11.26 for a single beer, which would surely make for a really expensive night out on the town. In part, this is because in 2019, the Muslim-majority country introduced a 100% excise tax on top the previous sales price of all alcohol imports.
These steep prices are aimed at tourists—and with Qatar hosting the 2022 men’s soccer World Cup, there’ll be thousands of visitors in the country looking for a cold one at any price.
| Rank | Country | Capital City | Average Price of a Beer |
|---|---|---|---|
| 1 | South Africa | Pretoria, Bloemfontein, Cape Town | $1.68 |
| 2 | Ukraine | Kyiv | $1.76 |
| 3 | Argentina | Buenos Aires | $1.79 |
| 4 | Bosnia And Herzegovina | Sarajevo | $1.96 |
| 5 | Ghana | Accra | $2.05 |
| 6 | Tunisia | Tunis | $2.09 |
| 7 | Georgia | Tbilisi | $2.30 |
| 8 | North Macedonia | Skopje | $2.34 |
| 9 | Chile | Santiago | $2.40 |
| 10 | Czech Republic (Czechia) | Prague | $2.49 |
| 11 | Rwanda | Kigali | $2.52 |
| 12 | Brazil | Brasilia | $2.52 |
| 13 | Haiti | Port Au Prince | $2.66 |
| 14 | Colombia | Bogota | $2.72 |
| 15 | Spain | Madrid | $2.74 |
| 16 | Panama | Panama City | $2.74 |
| 17 | Sri Lanka | Colombo | $2.77 |
| 18 | Hungary | Budapest | $2.84 |
| 19 | Armenia | Yerevan | $2.96 |
| 20 | Indonesia | Jakarta | $3.17 |
| 21 | Azerbaijan | Baku | $3.18 |
| 22 | Guyana | Georgetown | $3.39 |
| 23 | Bolivia | Santa Cruz | $3.42 |
| 24 | Kazakhstan | Nur-Sultan | $3.44 |
| 25 | Belgium | Brussels | $3.47 |
| 26 | Turkey | Istanbul | $3.61 |
| 27 | Malta | Valletta | $3.65 |
| 28 | Belarus | Minsk | $3.72 |
| 29 | Egypt | Cairo | $3.80 |
| 30 | India | New Delhi | $3.90 |
| 31 | Canada | Ottawa | $3.96 |
| 32 | Austria | Vienna | $3.99 |
| 33 | Wales | Cardiff | $4.06 |
| 34 | Nepal | Kathmandu | $4.13 |
| 35 | Scotland | Edinburgh | $4.18 |
| 36 | Greece | Athens | $4.25 |
| 37 | Philippines | Manila | $4.25 |
| 38 | Poland | Warsaw | $4.37 |
| 39 | Mexico | Mexcio City | $4.46 |
| 40 | Lithuania | Vilnius | $4.55 |
| 41 | South Korea | Seoul | $4.56 |
| 42 | Netherlands | Amsterdam | $4.60 |
| 43 | Germany | Berlin | $4.64 |
| 44 | Malaysia | Kuala Lumpur | $4.74 |
| 45 | United States | Washington D.C. | $4.75 |
| 46 | Thailand | Bangkok | $4.82 |
| 47 | Portugal | Lisbon | $5.06 |
| 48 | Russia | Moscow | $5.08 |
| 49 | Singapore | Singapore | $5.17 |
| 50 | Denmark | Copenhagen | $5.20 |
| 51 | Italy | Rome | $5.83 |
| 52 | England | London | $5.97 |
| 53 | Japan | Tokyo | $6.16 |
| 54 | Switzerland | Bern | $6.23 |
| 55 | France | Paris | $6.39 |
| 56 | China | Beijing | $7.71 |
| 57 | Jordan | Amman | $9.40 |
| 58 | Qatar | Doha | $11.26 |
At just $1.68 per bottle, South Africa has the lowest average beer price thanks at least partially to cultural norms of buying in bulk.
Cashing In: The Per Capita Spend on Beer
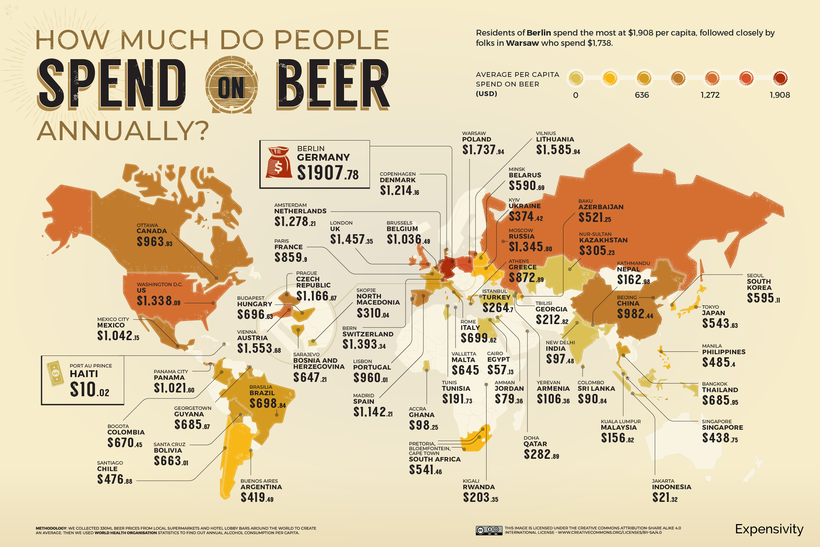
The price of a single beer is one thing, but which countries spend the most on beer itself? Germany unsurprisingly tops the list here with nearly $2,000 of expenditures per capita, bolstered by its strong beer culture and annual Oktoberfest celebration.
Germany also prides itself on the purity of its beer—the vast majority of brewers follow the Reinheitsgebot, centuries-old purity laws that broadly state that beer may contain only three ingredients: water, barley, and hops.
View the high resolution of this infographic by clicking here.
Following closely behind is Poland, which spends $1,738 per capita. Meanwhile, the U.S. ranks eighth in the world for the highest spending on beer per capita at $1,554—beer is also the country’s most popular alcoholic beverage.
Getting Boozy: How Much Beer Do People Drink?
Using data from the World Health Organization, the visualization below also digs into how much beer is consumed around the world per capita.
The Czech Republic emerges on top in this regard, with 468 beers on average in a year—that works out to 1.3 beers per day. Spain and Germany are next with 417 and 411 beers, respectively.

View the high resolution of this infographic by clicking here.
On the flip side, people in Haiti only drink about four beers yearly. This may be because they prefer something a little stronger—97% of alcohol consumption in the nation comes from spirits such as rum.
Beer has been around for over 7,000 years. No matter the beer price in your country, it’s worth raising a glass to the timelessness of this humble beverage.


Markets
The European Stock Market: Attractive Valuations Offer Opportunities
On average, the European stock market has valuations that are nearly 50% lower than U.S. valuations. But how can you access the market?


European Stock Market: Attractive Valuations Offer Opportunities
Europe is known for some established brands, from L’Oréal to Louis Vuitton. However, the European stock market offers additional opportunities that may be lesser known.
The above infographic, sponsored by STOXX, outlines why investors may want to consider European stocks.
Attractive Valuations
Compared to most North American and Asian markets, European stocks offer lower or comparable valuations.
| Index | Price-to-Earnings Ratio | Price-to-Book Ratio |
|---|---|---|
| EURO STOXX 50 | 14.9 | 2.2 |
| STOXX Europe 600 | 14.4 | 2 |
| U.S. | 25.9 | 4.7 |
| Canada | 16.1 | 1.8 |
| Japan | 15.4 | 1.6 |
| Asia Pacific ex. China | 17.1 | 1.8 |
Data as of February 29, 2024. See graphic for full index names. Ratios based on trailing 12 month financials. The price to earnings ratio excludes companies with negative earnings.
On average, European valuations are nearly 50% lower than U.S. valuations, potentially offering an affordable entry point for investors.
Research also shows that lower price ratios have historically led to higher long-term returns.
Market Movements Not Closely Connected
Over the last decade, the European stock market had low-to-moderate correlation with North American and Asian equities.
The below chart shows correlations from February 2014 to February 2024. A value closer to zero indicates low correlation, while a value of one would indicate that two regions are moving in perfect unison.
| EURO STOXX 50 | STOXX EUROPE 600 | U.S. | Canada | Japan | Asia Pacific ex. China |
|
|---|---|---|---|---|---|---|
| EURO STOXX 50 | 1.00 | 0.97 | 0.55 | 0.67 | 0.24 | 0.43 |
| STOXX EUROPE 600 | 1.00 | 0.56 | 0.71 | 0.28 | 0.48 | |
| U.S. | 1.00 | 0.73 | 0.12 | 0.25 | ||
| Canada | 1.00 | 0.22 | 0.40 | |||
| Japan | 1.00 | 0.88 | ||||
| Asia Pacific ex. China | 1.00 |
Data is based on daily USD returns.
European equities had relatively independent market movements from North American and Asian markets. One contributing factor could be the differing sector weights in each market. For instance, technology makes up a quarter of the U.S. market, but health care and industrials dominate the broader European market.
Ultimately, European equities can enhance portfolio diversification and have the potential to mitigate risk for investors.
Tracking the Market
For investors interested in European equities, STOXX offers a variety of flagship indices:
| Index | Description | Market Cap |
|---|---|---|
| STOXX Europe 600 | Pan-regional, broad market | €10.5T |
| STOXX Developed Europe | Pan-regional, broad-market | €9.9T |
| STOXX Europe 600 ESG-X | Pan-regional, broad market, sustainability focus | €9.7T |
| STOXX Europe 50 | Pan-regional, blue-chip | €5.1T |
| EURO STOXX 50 | Eurozone, blue-chip | €3.5T |
Data is as of February 29, 2024. Market cap is free float, which represents the shares that are readily available for public trading on stock exchanges.
The EURO STOXX 50 tracks the Eurozone’s biggest and most traded companies. It also underlies one of the world’s largest ranges of ETFs and mutual funds. As of November 2023, there were €27.3 billion in ETFs and €23.5B in mutual fund assets under management tracking the index.
“For the past 25 years, the EURO STOXX 50 has served as an accurate, reliable and tradable representation of the Eurozone equity market.”
— Axel Lomholt, General Manager at STOXX
Partnering with STOXX to Track the European Stock Market
Are you interested in European equities? STOXX can be a valuable partner:
- Comprehensive, liquid and investable ecosystem
- European heritage, global reach
- Highly sophisticated customization capabilities
- Open architecture approach to using data
- Close partnerships with clients
- Part of ISS STOXX and Deutsche Börse Group
With a full suite of indices, STOXX can help you benchmark against the European stock market.
Learn how STOXX’s European indices offer liquid and effective market access.

-

 Economy3 days ago
Economic Growth Forecasts for G7 and BRICS Countries in 2024
The IMF has released its economic growth forecasts for 2024. How do the G7 and BRICS countries compare?
-

 Markets2 weeks ago
U.S. Debt Interest Payments Reach $1 Trillion
U.S. debt interest payments have surged past the $1 trillion dollar mark, amid high interest rates and an ever-expanding debt burden.
-

 United States2 weeks ago
Ranked: The Largest U.S. Corporations by Number of Employees
We visualized the top U.S. companies by employees, revealing the massive scale of retailers like Walmart, Target, and Home Depot.
-

 Markets2 weeks ago
The Top 10 States by Real GDP Growth in 2023
This graphic shows the states with the highest real GDP growth rate in 2023, largely propelled by the oil and gas boom.
-

 Markets2 weeks ago
Ranked: The World’s Top Flight Routes, by Revenue
In this graphic, we show the highest earning flight routes globally as air travel continued to rebound in 2023.
-

 Markets3 weeks ago
Ranked: The Most Valuable Housing Markets in America
The U.S. residential real estate market is worth a staggering $47.5 trillion. Here are the most valuable housing markets in the country.


-

 Debt1 week ago
How Debt-to-GDP Ratios Have Changed Since 2000
-
Markets2 weeks ago
Ranked: The World’s Top Flight Routes, by Revenue
-

 Countries2 weeks ago
Population Projections: The World’s 6 Largest Countries in 2075
-
Markets2 weeks ago
The Top 10 States by Real GDP Growth in 2023
-

 Demographics2 weeks ago
The Smallest Gender Wage Gaps in OECD Countries
-

 United States2 weeks ago
Where U.S. Inflation Hit the Hardest in March 2024
-

 Green2 weeks ago
Top Countries By Forest Growth Since 2001
-
United States2 weeks ago
Ranked: The Largest U.S. Corporations by Number of Employees