Connect with us

Misc

Slices of the Pie: Mapping Territorial Claims in Antarctica

Published

on

View the full-size version of this infographic.

antarctic territorial claims map

Slices of the Pie: Mapping Territorial Claims in Antarctica

For the 55% of the world’s population who reside in cities, land is viewed as a precious commodityโ€”every square foot has a value attached to it. As the global population continues to rise toward the eight billion mark, it can seem like humans have laid claim to every available corner of the earth.

While this is mostly true, there is one place on the planet that is vast, empty, and even partially unclaimed: Antarctica.

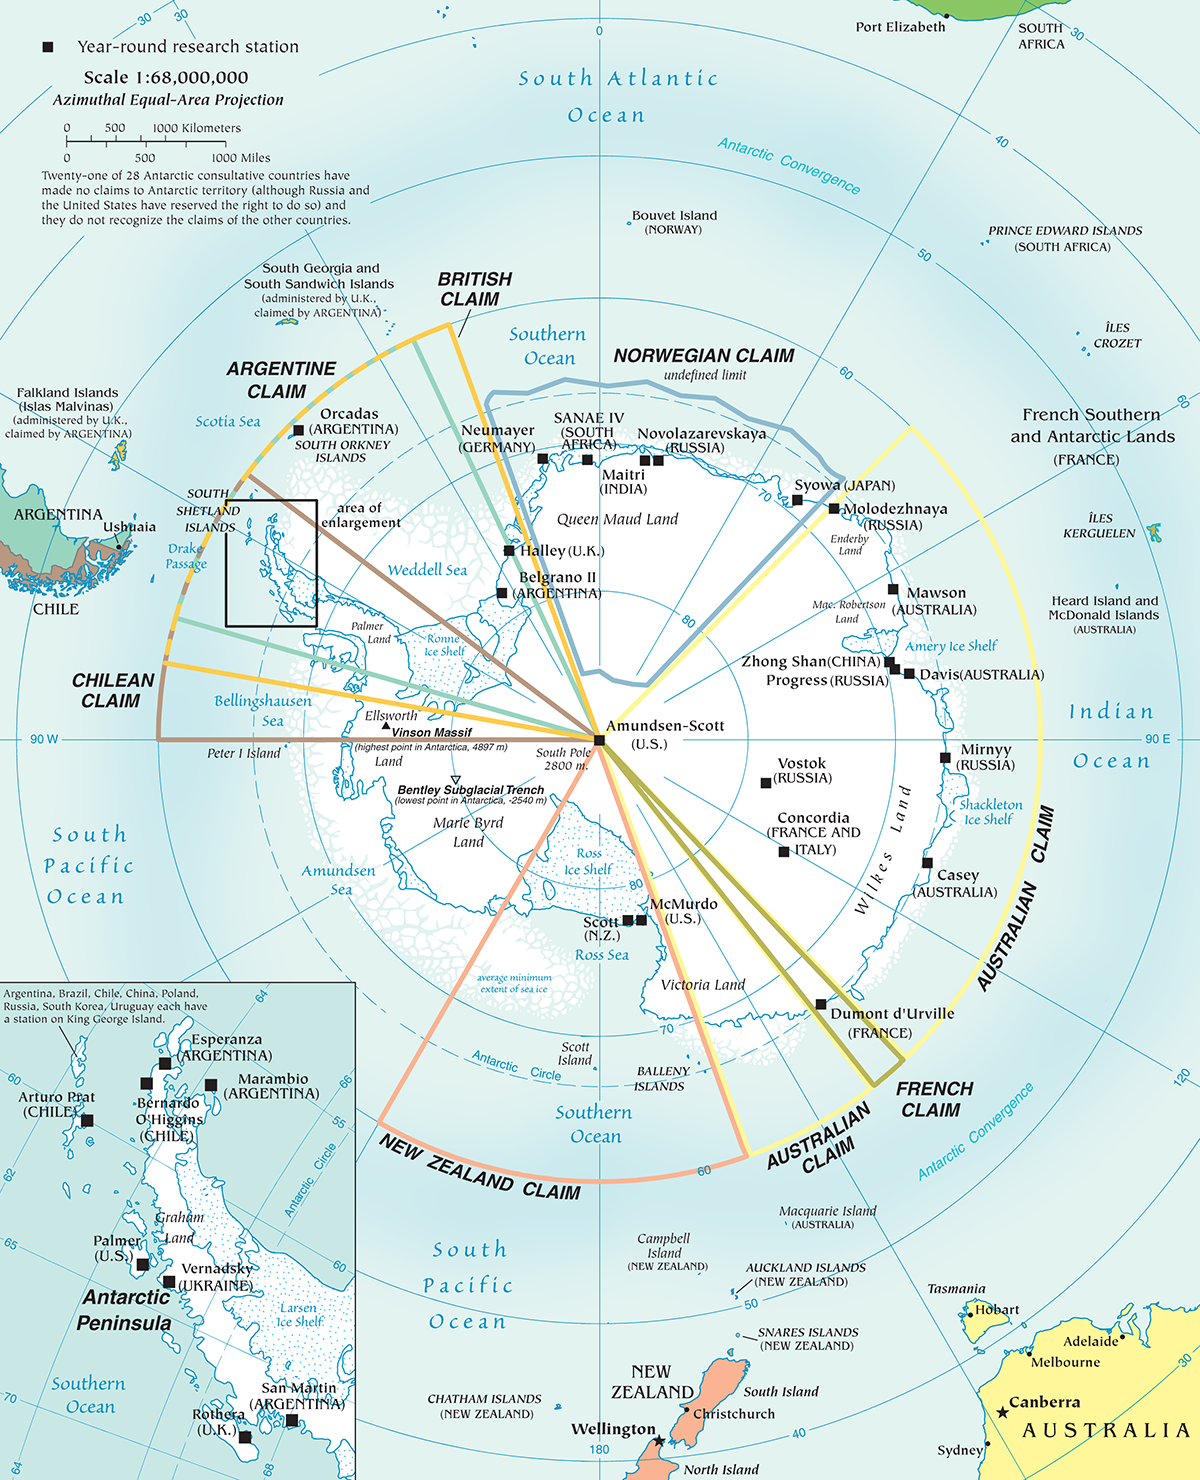
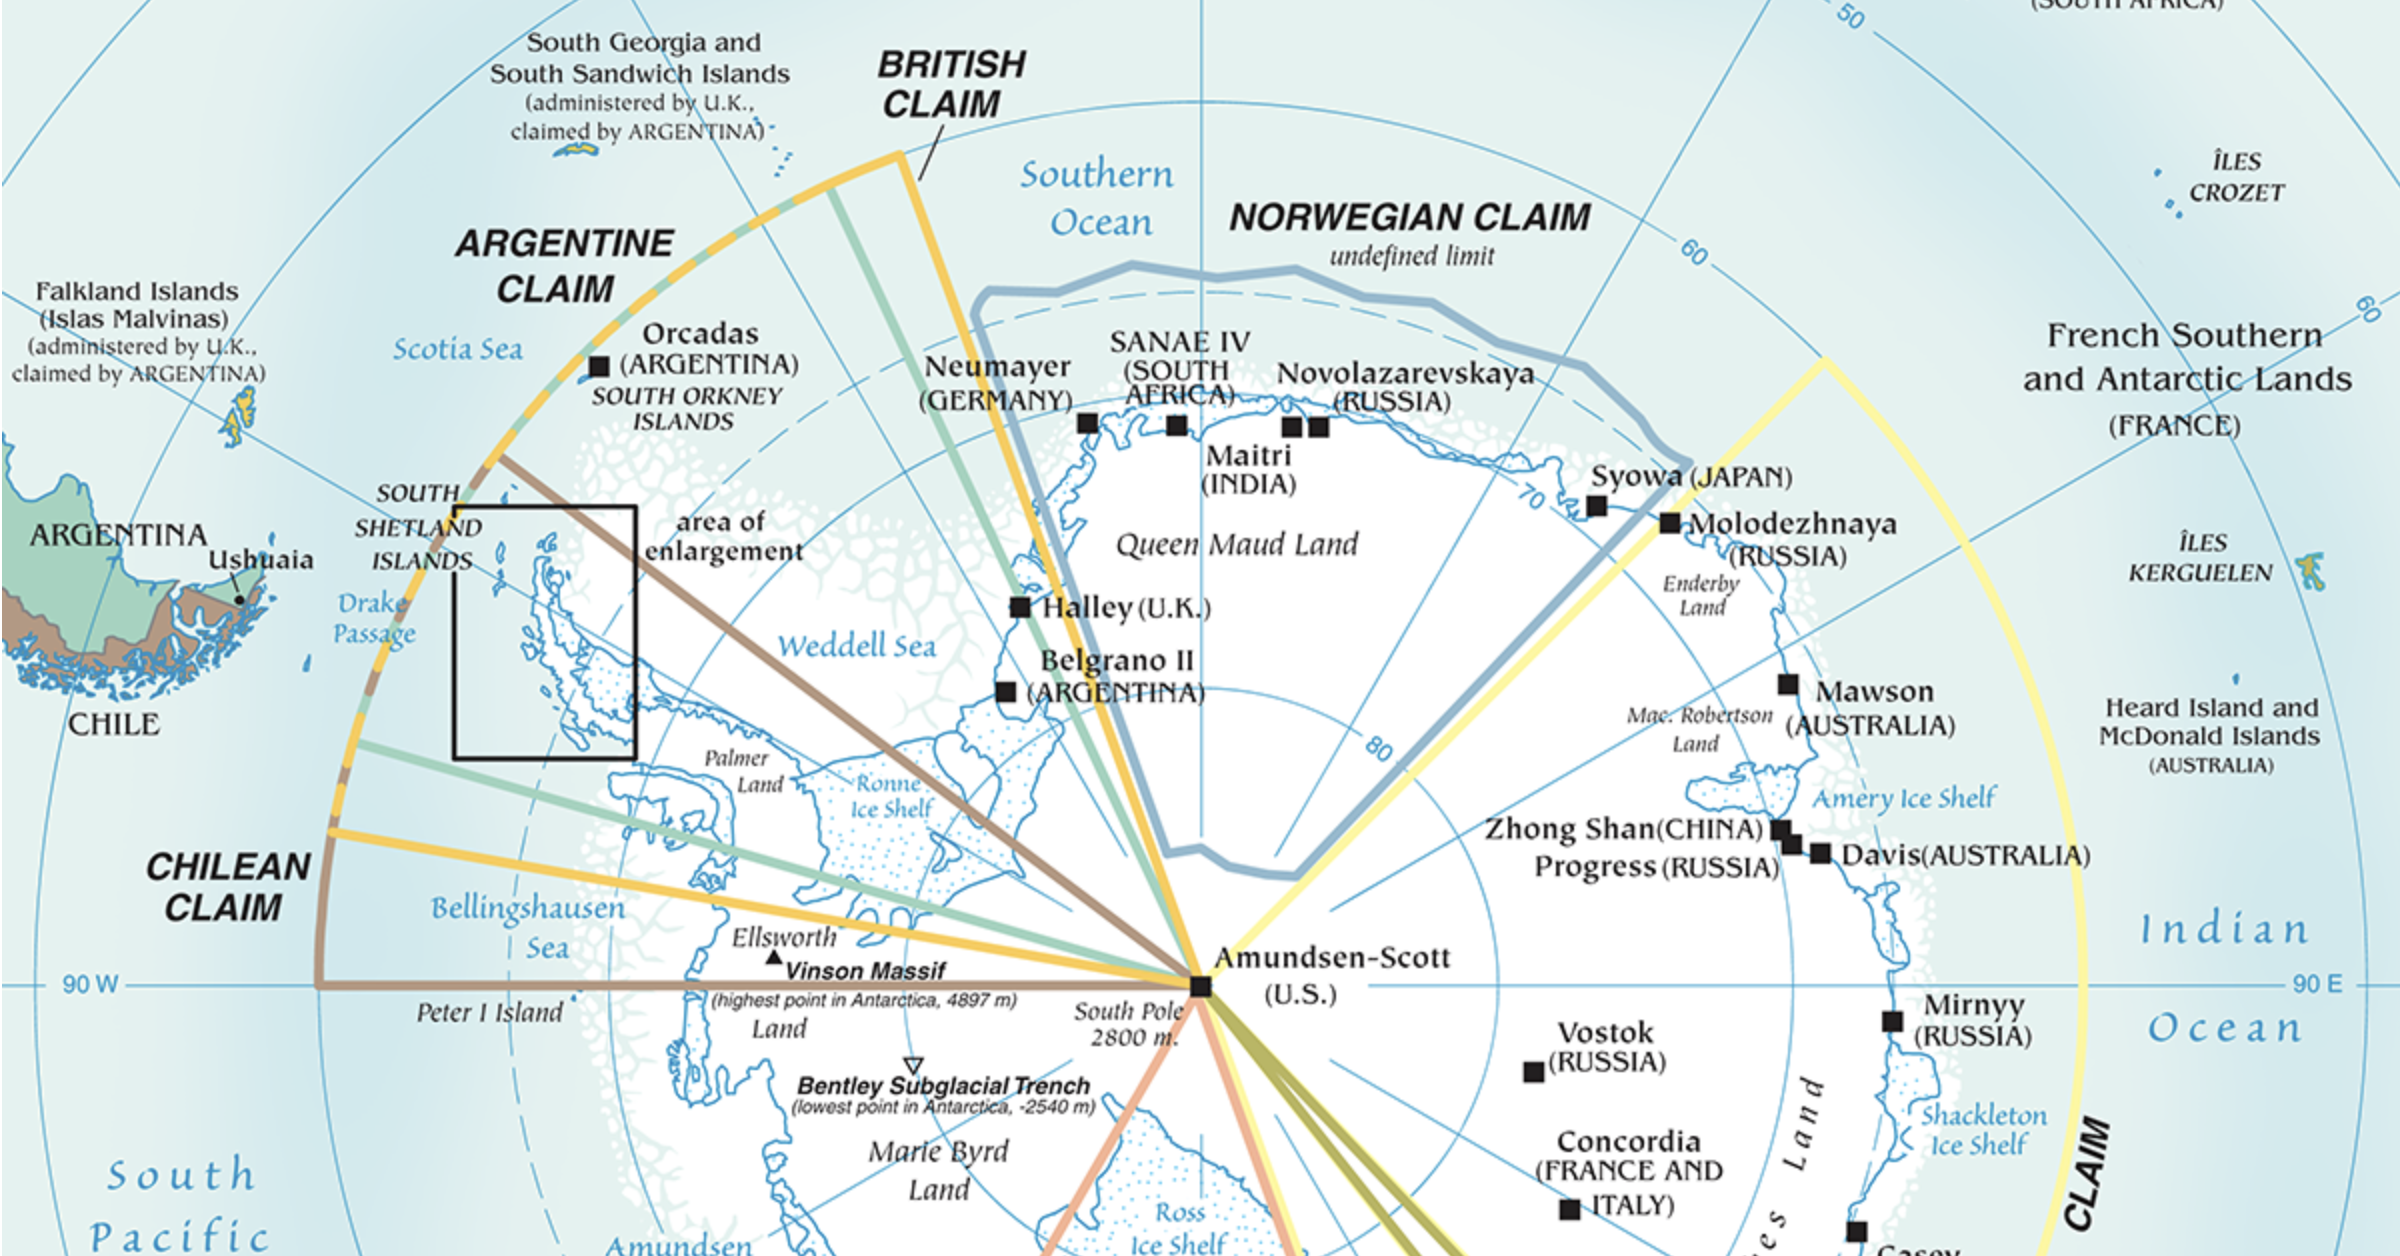
Today’s map, originally created by the CIA World Factbook, visualizes the active claims on Antarctic territory, as well as the location of many permanent research facilities.

The History of Antarctic Territorial Claims

In the first half of the 20th Century, a number of countries began to claim wedge-shaped portions of territory on the southernmost continent. Even Nazi Germany was in on the action, claiming a large swath of land which they dubbed New Swabia.

After WWII, the Antarctic Treaty systemโ€”which established the legal framework for the management of the continentโ€”began to take shape. In the 1950s, seven countries including Argentina, Australia, Chile, France, New Zealand, Norway, and the United Kingdom claimed territorial sovereignty over portions of Antarctica. A number of other nations, including the U.S. and Japan, were engaged in exploration but hadn’t put forward claims in an official capacity.

Territorial claims in AntarcticaTerritory nameArea of claim
๐Ÿ‡ฆ๐Ÿ‡บ AustraliaAustralian Antarctic Territory3,663,915 miยฒ (5,896,500 kmยฒ)
๐Ÿ‡ณ๐Ÿ‡ด NorwayQueen Maud Land1,677,702 miยฒ (2,700,000 kmยฒ)
๐Ÿ‡ฌ๐Ÿ‡ง United KingdomBritish Antarctic Territory1,062,171 miยฒ (1,709,400 kmยฒ)
๐Ÿ‡ฆ๐Ÿ‡ท Argentina Argentine Antarctica908,194 miยฒ (1,461,597 kmยฒ)
๐Ÿ‡จ๐Ÿ‡ฑ ChileChilean Antarctic Territory776,874 miยฒ (1,250,258 kmยฒ)
๐Ÿ‡ณ๐Ÿ‡ฟ New ZealandRoss Dependency279,617 miยฒ (450,000 kmยฒ)
๐Ÿ‡ซ๐Ÿ‡ท FranceAdรฉlie Land268,432 miยฒ (432,000 kmยฒ)

Despite the remoteness and inhospitable climate of Antarctica, the idea of claiming such large areas of landmass has proven appealing to countries. Even the smallest claim on the continent is equivalent to the size of Iraq.

A few of the above claims overlap, as is the case on the Antarctic Peninsula, which juts out geographically from the rest of the continent. This area is less remote with a milder climate, and is subject to claims by Argentina, Chile, and the United Kingdom (which governs the nearby Falkland Islands).

Interestingly, there is still a large portion of Antarctica that remains unclaimed today. Just east of the Ross Ice Shelf lies Marie Byrd Land, a vast, remote territory that is by far the largest unclaimed land area on Earth.

While Antarctica has no official government, it is administered through yearly meetings known as the Antarctic Treaty Consultative Meetings. These meetings involve a number of stakeholders, from member nations to observer organizations.

Frontage Theory: Another Way to Slice it

Of course, critics could argue that current claims are arbitrary, and that there is a more equitable way to partition land in Antarctica. That’s where Frontage Theory comes in.

Originally proposed by Brazilian geopolitical scholar Therezinha de Castro, the theory argues that sectors of the Antarctic continent should be distributed according to meridians (the imaginary lines running northโ€“south around the earth). Wherever straight lines running north hit landfall, that country would have sovereignty over the corresponding “wedge” of Antarctic territory.

The map below shows roughly how territorial claims would look under that scenario.

hypothetical Antarctica frontage territories claims

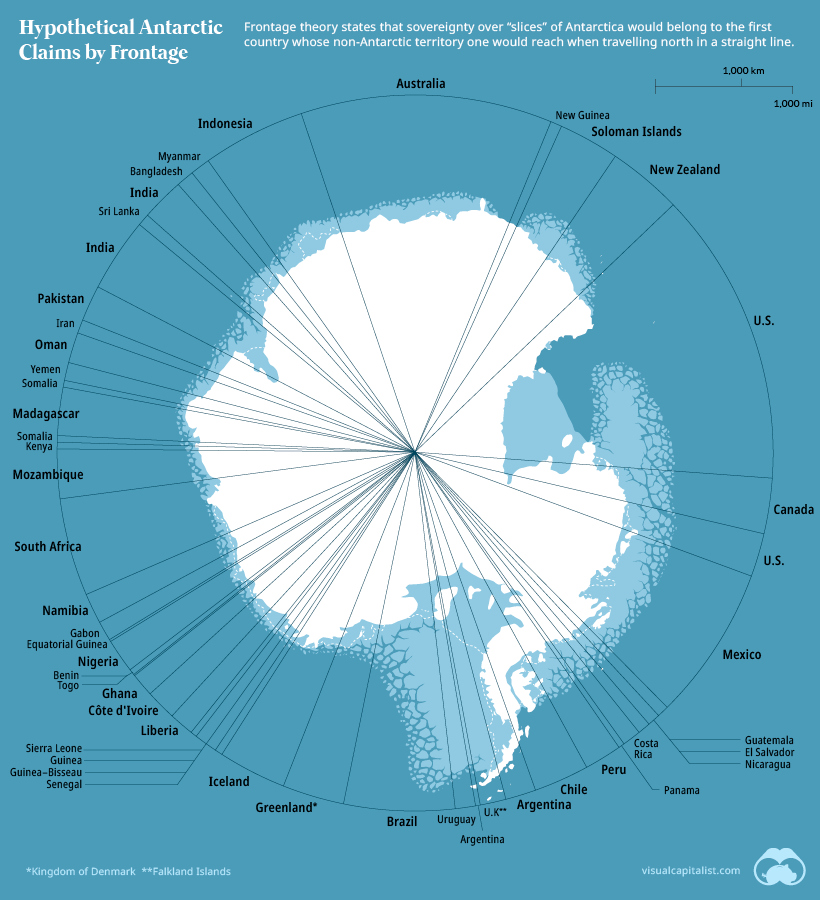
While Brazil has obvious reasons for favoring this solution, it’s also a thought experiment that produces an interesting mix of territorial claims. Not only do nearby countries in Africa and South America get a piece of the pie, but places like Canada and Greenland would end up with territory adjacent to both of the planet’s poles.

Leaving the Pie Unsliced

Thanks to the Antarctic Treaty, there is no mining taking place in Antarctica, and thus far no country has set up a permanent settlement on the continent. Aside from scattered research stations and a few thousand researchers, claims in the region have a limited impact.

For the near future at least, the slicing of the Antarctic pie is only hypothetical.

Subscribe to Visual Capitalist
Click for Comments

War

Interactive: Comparing Military Spend Around the World

Which countries have the highest military spend relative to their economy? This visual breaks down the amount spent in each country by GDP.

Published

on

A map showing countries' military spend as a percentage of their gross domestic product.

Comparing Military Spend Around the World

One of the easiest ways to identify a nationโ€™s priorities is by tracking its expenditures, and military spend is no different.

Usually spending is measured, and ranked, in absolute amounts. For example, countries around the world collectively spent $2.1 trillion on their militaries in 2021, with the most coming from the U.S. ($800 billion), China ($293 billion), and India ($77 billion).

But these eye-popping figures are best understood in the context of each country’s economy. Using data from the Stockholm International Peace Research Institute (SIPRI), Varun Jain has visualized 158 countries’ military expenditures, both as a percentage of their total GDP as well as in average per-capita spend.

Countriesโ€™ Military Spend as a Percentage of their Economy

To begin, Jain identified three categories of military expenditure as a percent of GDP, using the five-year (2018โ€’2022) average for more consistent data:

Military Spend% of GDPCountries
HighAbove 5%7
Medium2โ€’5%44
LowBelow 2%107

Under this categorization, the stand outs are the countries spending an outsized amount of their economic output on military, rather than the highest total spenders in absolute terms.

At the top of the table is Ukraine, which has earmarked a staggering average of 9.46% of its total economic output on defense over the past five years. That’s well ahead of second-place Saudi Arabia, which is slightly above 8%.

In Ukraine’s case, its high ranking shows how quickly priorities can change. From 2018 to 2021, the country spent 3.2-3.8% of its GDP on its military, but the outbreak of war with Russia saw its expenditures jump to one-third of economic output.

Other countries from the Middle East and North Africa follow in this tier, with Oman third at 8.11% and Qatar fourth with 5.88%. Rounding out the top seven high spenders are Algeria, Kuwait, and Israel.

RankCountryMilitary Spend% of GDP
1๐Ÿ‡บ๐Ÿ‡ฆ UkraineHigh9.46%
2๐Ÿ‡ธ๐Ÿ‡ฆ Saudi ArabiaHigh8.19%
3๐Ÿ‡ด๐Ÿ‡ฒ OmanHigh8.11%
4๐Ÿ‡ถ๐Ÿ‡ฆ QatarHigh5.88%
5๐Ÿ‡ฉ๐Ÿ‡ฟ AlgeriaHigh5.70%
6๐Ÿ‡ฐ๐Ÿ‡ผ KuwaitHigh5.66%
7๐Ÿ‡ฎ๐Ÿ‡ฑ IsraelHigh5.09%
8๐Ÿ‡ฏ๐Ÿ‡ด JordanMedium4.81%
9๐Ÿ‡ฆ๐Ÿ‡ฒ ArmeniaMedium4.53%
10๐Ÿ‡ฆ๐Ÿ‡ฟ AzerbaijanMedium4.53%
11๐Ÿ‡ฑ๐Ÿ‡ง LebanonMedium4.01%
12๐Ÿ‡ท๐Ÿ‡บ RussiaMedium3.98%
13๐Ÿ‡ง๐Ÿ‡ญ BahrainMedium3.79%
14๐Ÿ‡ต๐Ÿ‡ฐ PakistanMedium3.75%
15๐Ÿ‡ฒ๐Ÿ‡ฆ MoroccoMedium3.72%
16๐Ÿ‡บ๐Ÿ‡ฟ UzbekistanMedium3.56%
17๐Ÿ‡บ๐Ÿ‡ธ U.S.Medium3.48%
18๐Ÿ‡จ๐Ÿ‡ด ColombiaMedium3.24%
19๐Ÿ‡ฌ๐Ÿ‡ท GreeceMedium3.15%
20๐Ÿ‡ณ๐Ÿ‡ฆ NamibiaMedium3.09%
21๐Ÿ‡ง๐Ÿ‡ณ BruneiMedium3.09%
22๐Ÿ‡ธ๐Ÿ‡ธ South SudanMedium3.05%
23๐Ÿ‡น๐Ÿ‡ฌ TogoMedium3.03%
24๐Ÿ‡ฒ๐Ÿ‡ฑ MaliMedium2.90%
25๐Ÿ‡จ๐Ÿ‡บ CubaMedium2.88%
26๐Ÿ‡ธ๐Ÿ‡ฌ SingaporeMedium2.86%
27๐Ÿ‡ง๐Ÿ‡ผ BotswanaMedium2.86%
28๐Ÿ‡ฒ๐Ÿ‡ฒ MyanmarMedium2.76%
29๐Ÿ‡ง๐Ÿ‡ซ Burkina FasoMedium2.70%
30๐Ÿ‡ฎ๐Ÿ‡ถ IraqMedium2.69%
31๐Ÿ‡ฐ๐Ÿ‡ท South KoreaMedium2.69%
32๐Ÿ‡จ๐Ÿ‡ฌ Republic of CongoMedium2.68%
33๐Ÿ‡น๐Ÿ‡ฉ ChadMedium2.66%
34๐Ÿ‡ฎ๐Ÿ‡ณ IndiaMedium2.58%
35๐Ÿ‡น๐Ÿ‡ณ TunisiaMedium2.58%
36๐Ÿ‡ช๐Ÿ‡จ EcuadorMedium2.34%
37๐Ÿ‡ฎ๐Ÿ‡ท IranMedium2.32%
38๐Ÿ‡ป๐Ÿ‡ณ Viet NamMedium2.28%
39๐Ÿ‡ฐ๐Ÿ‡ญ CambodiaMedium2.26%
40๐Ÿ‡ฒ๐Ÿ‡ท MauritaniaMedium2.24%
41๐Ÿ‡ณ๐Ÿ‡ช NigerMedium2.21%
42๐Ÿ‡ง๐Ÿ‡ฎ BurundiMedium2.21%
43๐Ÿ‡น๐Ÿ‡ท TurkeyMedium2.19%
44๐Ÿ‡ต๐Ÿ‡ฑ PolandMedium2.17%
45๐Ÿ‡ฑ๐Ÿ‡ป LatviaMedium2.14%
46๐Ÿ‡ฑ๐Ÿ‡น LithuaniaMedium2.13%
47๐Ÿ‡ช๐Ÿ‡ช EstoniaMedium2.13%
48๐Ÿ‡ฌ๐Ÿ‡ง United KingdomMedium2.12%
49๐Ÿ‡บ๐Ÿ‡พ UruguayMedium2.11%
50๐Ÿ‡ท๐Ÿ‡ธ SerbiaMedium2.06%
51๐Ÿ‡บ๐Ÿ‡ฌ UgandaMedium2.02%
52๐Ÿ‡ญ๐Ÿ‡ท CroatiaLow1.97%
53๐Ÿ‡ฆ๐Ÿ‡บ AustraliaLow1.93%
54๐Ÿ‡จ๐Ÿ‡ฑ ChileLow1.92%
55๐Ÿ‡ซ๐Ÿ‡ท FranceLow1.91%
56๐Ÿ‡จ๐Ÿ‡พ CyprusLow1.90%
57๐Ÿ‡ท๐Ÿ‡ด RomaniaLow1.87%
58๐Ÿ‡ง๐Ÿ‡ฌ BulgariaLow1.85%
59๐Ÿ‡ธ๐Ÿ‡ฟ EswatiniLow1.82%
60๐Ÿ‡ณ๐Ÿ‡ด NorwayLow1.81%
61๐Ÿ‡จ๐Ÿ‡ซ Central African RepublicLow1.78%
62๐Ÿ‡ฑ๐Ÿ‡ฐ Sri LankaLow1.77%
63๐Ÿ‡ต๐Ÿ‡น PortugalLow1.77%
64๐Ÿ‡น๐Ÿ‡ผ TaiwanLow1.76%
65๐Ÿ‡จ๐Ÿ‡ณ ChinaLow1.72%
66๐Ÿ‡ฌ๐Ÿ‡ช GeorgiaLow1.71%
67๐Ÿ‡ธ๐Ÿ‡ฐ SlovakiaLow1.67%
68๐Ÿ‡ฌ๐Ÿ‡ผ Guinea-BissauLow1.65%
69๐Ÿ‡ฐ๐Ÿ‡ฌ KyrgyzstanLow1.62%
70๐Ÿ‡ฌ๐Ÿ‡ณ GuineaLow1.61%
71๐Ÿ‡ซ๐Ÿ‡ฎ FinlandLow1.60%
72๐Ÿ‡ธ๐Ÿ‡ณ SenegalLow1.58%
73๐Ÿ‡ญ๐Ÿ‡ณ HondurasLow1.56%
74๐Ÿ‡ฌ๐Ÿ‡ฆ GabonLow1.56%
75๐Ÿ‡ฒ๐Ÿ‡ฟ MozambiqueLow1.56%
76๐Ÿ‡ฑ๐Ÿ‡ธ LesothoLow1.56%
77๐Ÿ‡ฒ๐Ÿ‡ช MontenegroLow1.54%
78๐Ÿ‡ซ๐Ÿ‡ฏ FijiLow1.54%
79๐Ÿ‡ฏ๐Ÿ‡ฒ JamaicaLow1.49%
80๐Ÿ‡ฆ๐Ÿ‡ด AngolaLow1.48%
81๐Ÿ‡ฎ๐Ÿ‡น ItalyLow1.48%
82๐Ÿ‡ญ๐Ÿ‡บ HungaryLow1.48%
83๐Ÿ‡ง๐Ÿ‡ด BoliviaLow1.46%
84๐Ÿ‡ธ๐Ÿ‡จ SeychellesLow1.43%
85๐Ÿ‡ณ๐Ÿ‡ฑ NetherlandsLow1.41%
86๐Ÿ‡ธ๐Ÿ‡ฉ SudanLow1.39%
87๐Ÿ‡ท๐Ÿ‡ผ RwandaLow1.39%
88๐Ÿ‡ณ๐Ÿ‡ต NepalLow1.36%
89๐Ÿ‡ฉ๐Ÿ‡ฐ DenmarkLow1.36%
90๐Ÿ‡ฆ๐Ÿ‡ฑ AlbaniaLow1.34%
91๐Ÿ‡ช๐Ÿ‡ธ SpainLow1.34%
92๐Ÿ‡น๐Ÿ‡ญ ThailandLow1.33%
93๐Ÿ‡ฆ๐Ÿ‡ซ AfghanistanLow1.33%
94๐Ÿ‡ณ๐Ÿ‡ฟ New ZealandLow1.32%
95๐Ÿ‡จ๐Ÿ‡ฆ CanadaLow1.32%
96๐Ÿ‡ฉ๐Ÿ‡ช GermanyLow1.31%
97๐Ÿ‡ฒ๐Ÿ‡ฐ North MacedoniaLow1.30%
98๐Ÿ‡ง๐Ÿ‡ท BrazilLow1.29%
99๐Ÿ‡ง๐Ÿ‡ฟ BelizeLow1.28%
100๐Ÿ‡ธ๐Ÿ‡ป El SalvadorLow1.28%
101๐Ÿ‡ง๐Ÿ‡ฉ BangladeshLow1.26%
102๐Ÿ‡ฟ๐Ÿ‡ฒ ZambiaLow1.25%
103๐Ÿ‡ฌ๐Ÿ‡ถ Equatorial GuineaLow1.24%
104๐Ÿ‡ฌ๐Ÿ‡พ GuyanaLow1.22%
105๐Ÿ‡จ๐Ÿ‡ฎ Cote d'IvoireLow1.22%
106๐Ÿ‡ช๐Ÿ‡ฌ EgyptLow1.20%
107๐Ÿ‡ต๐Ÿ‡ช PeruLow1.20%
108๐Ÿ‡ง๐Ÿ‡พ BelarusLow1.18%
109๐Ÿ‡ธ๐Ÿ‡ช SwedenLow1.17%
110๐Ÿ‡ฐ๐Ÿ‡ช KenyaLow1.13%
111๐Ÿ‡ธ๐Ÿ‡ฎ SloveniaLow1.10%
112๐Ÿ‡น๐Ÿ‡ฑ Timor LesteLow1.08%
113๐Ÿ‡น๐Ÿ‡ฟ TanzaniaLow1.05%
114๐Ÿ‡จ๐Ÿ‡ฒ CameroonLow1.04%
115๐Ÿ‡น๐Ÿ‡ฏ TajikistanLow1.03%
116๐Ÿ‡ฏ๐Ÿ‡ต JapanLow1.03%
117๐Ÿ‡ง๐Ÿ‡ช BelgiumLow1.02%
118๐Ÿ‡ฑ๐Ÿ‡ท LiberiaLow1.00%
119๐Ÿ‡ฒ๐Ÿ‡พ MalaysiaLow0.98%
120๐Ÿ‡ต๐Ÿ‡ญ PhilippinesLow0.96%
121๐Ÿ‡ต๐Ÿ‡พ ParaguayLow0.95%
122๐Ÿ‡ฝ๐Ÿ‡ฐ KosovoLow0.95%
123๐Ÿ‡ฟ๐Ÿ‡ฆ South AfricaLow0.94%
124๐Ÿ‡ฒ๐Ÿ‡ผ MalawiLow0.92%
125๐Ÿ‡ง๐Ÿ‡ฆ Bosnia and HerzegovinaLow0.84%
126๐Ÿ‡ฐ๐Ÿ‡ฟ KazakhstanLow0.83%
127๐Ÿ‡ฆ๐Ÿ‡น AustriaLow0.78%
128๐Ÿ‡ฌ๐Ÿ‡ฒ GambiaLow0.76%
129๐Ÿ‡น๐Ÿ‡น Trinidad & TobagoLow0.75%
130๐Ÿ‡ฎ๐Ÿ‡ฉ IndonesiaLow0.74%
131๐Ÿ‡จ๐Ÿ‡ญ SwitzerlandLow0.73%
132๐Ÿ‡จ๐Ÿ‡ฟ Czech RepublicLow0.71%
133๐Ÿ‡ฉ๐Ÿ‡ด Dominican RepublicLow0.70%
134๐Ÿ‡ฒ๐Ÿ‡ณ MongoliaLow0.69%
135๐Ÿ‡ฒ๐Ÿ‡ฌ MadagascarLow0.68%
136๐Ÿ‡จ๐Ÿ‡ฉ Dem. Rep. of CongoLow0.64%
137๐Ÿ‡ณ๐Ÿ‡ฌ NigeriaLow0.64%
138๐Ÿ‡ช๐Ÿ‡น EthiopiaLow0.64%
139๐Ÿ‡ธ๐Ÿ‡ฑ Sierra LeoneLow0.64%
140๐Ÿ‡ฆ๐Ÿ‡ท ArgentinaLow0.63%
141๐Ÿ‡ฑ๐Ÿ‡บ LuxembourgLow0.61%
142๐Ÿ‡ฒ๐Ÿ‡ฝ MexicoLow0.61%
143๐Ÿ‡ณ๐Ÿ‡ฎ NicaraguaLow0.60%
144๐Ÿ‡จ๐Ÿ‡ป Cape VerdeLow0.54%
145๐Ÿ‡ง๐Ÿ‡ฏ BeninLow0.54%
146๐Ÿ‡ฒ๐Ÿ‡น MaltaLow0.48%
147๐Ÿ‡ฌ๐Ÿ‡น GuatemalaLow0.45%
148๐Ÿ‡ฌ๐Ÿ‡ญ GhanaLow0.43%
149๐Ÿ‡ต๐Ÿ‡ฌ Papua New GuineaLow0.38%
150๐Ÿ‡ฒ๐Ÿ‡ฉ MoldovaLow0.36%
151๐Ÿ‡ฎ๐Ÿ‡ช IrelandLow0.27%
152๐Ÿ‡ฟ๐Ÿ‡ผ ZimbabweLow0.26%
153๐Ÿ‡ป๐Ÿ‡ช VenezuelaLow0.20%
154๐Ÿ‡ญ๐Ÿ‡น HaitiLow0.17%
155๐Ÿ‡ฒ๐Ÿ‡บ MauritiusLow0.16%
156๐Ÿ‡จ๐Ÿ‡ท Costa RicaLow0.00%
157๐Ÿ‡ฎ๐Ÿ‡ธ IcelandLow0.00%
158๐Ÿ‡ต๐Ÿ‡ฆ PanamaLow0.00%

The medium group consists of 44 countries and is led by four nations (Jordan, Armenia, Azerbaijan, and Lebanon) that all spend more than 4% of their GDP on their militaries. Other familiar countries known to have large military budgets, like Russia, Pakistan, the U.S., India and the UK, are also in this category.

The low spend group has a total of 107 countries, but also contains some surprises. For example, China, France, and Germanyโ€”all in the top 10 countries by absolute military spendโ€”actually have similar amounts of military spend as a percent of GDP as Georgia, Cyprus, and North Macedonia respectively.

At the bottom of the table are countries with either low military importance, or strange technicalities. For example, Mauritius is one of the countries with the lowest military budgets because it doesn’t officially have a standing military, instead relying on two paramilitary forces (a special mobile force and a Coast Guard).

Similarly, Iceland allocates 0% of its GDP towards military spending. In place of a standing army, the country maintains a specialized peacekeeping force, a substantial Coast Guard, and relies on security alliances within NATO, of which it is a member and provides financial support to.

Ranking Defense Spending Per Capita

While the measure above equalizes military spend on economic strength, per-capita military spending shows how much countries allocate while accounting for population size.

On a per-capita basis (again using a five-year average), Qatar leads the ranks with a per-capita spend of $4,564, well-ahead of Israel at $2,535, and Saudi Arabia at $1,928.

RankCountryPer Capita Spend ($)
1๐Ÿ‡ถ๐Ÿ‡ฆ Qatar$4,564
2๐Ÿ‡ฎ๐Ÿ‡ฑ Israel$2,535
3๐Ÿ‡ธ๐Ÿ‡ฆ Saudi Arabia$1,928
4๐Ÿ‡ธ๐Ÿ‡ฌ Singapore$1,837
5๐Ÿ‡ฐ๐Ÿ‡ผ Kuwait$1,815
6๐Ÿ‡บ๐Ÿ‡ธ U.S.$1,815
7๐Ÿ‡ณ๐Ÿ‡ด Norway$1,438
8๐Ÿ‡ด๐Ÿ‡ฒ Oman$1,254
9๐Ÿ‡ฆ๐Ÿ‡บ Australia$1,131
10๐Ÿ‡ง๐Ÿ‡ณ Brunei$959
11๐Ÿ‡ฌ๐Ÿ‡ง UK$913
12๐Ÿ‡ฐ๐Ÿ‡ท South Korea$894
13๐Ÿ‡ง๐Ÿ‡ญ Bahrain$863
14๐Ÿ‡ฉ๐Ÿ‡ฐ Denmark$861
15๐Ÿ‡ซ๐Ÿ‡ท France$811
16๐Ÿ‡ซ๐Ÿ‡ฎ Finland$801
17๐Ÿ‡ณ๐Ÿ‡ฑ Netherlands$765
18๐Ÿ‡ฑ๐Ÿ‡บ Luxembourg$694
19๐Ÿ‡ธ๐Ÿ‡ช Sweden$662
20๐Ÿ‡จ๐Ÿ‡ญ Switzerland$647
21๐Ÿ‡จ๐Ÿ‡ฆ Canada$645
22๐Ÿ‡ฌ๐Ÿ‡ท Greece$629
23๐Ÿ‡ฉ๐Ÿ‡ช Germany$623
24๐Ÿ‡ณ๐Ÿ‡ฟ New Zealand$610
25๐Ÿ‡ช๐Ÿ‡ช Estonia$535
26๐Ÿ‡น๐Ÿ‡ผ Taiwan$495
27๐Ÿ‡ฎ๐Ÿ‡น Italy$494
28๐Ÿ‡ง๐Ÿ‡ช Belgium$487
29๐Ÿ‡ท๐Ÿ‡บ Russia$467
30๐Ÿ‡ฑ๐Ÿ‡น Lithuania$463
31๐Ÿ‡ต๐Ÿ‡น Portugal$417
32๐Ÿ‡ฑ๐Ÿ‡ป Latvia$405
33๐Ÿ‡จ๐Ÿ‡พ Cyprus$399
34๐Ÿ‡ฏ๐Ÿ‡ต Japan$398
35๐Ÿ‡ช๐Ÿ‡ธ Spain$395
36๐Ÿ‡ฆ๐Ÿ‡น Austria$393
37๐Ÿ‡ต๐Ÿ‡ฑ Poland$359
38๐Ÿ‡บ๐Ÿ‡พ Uruguay$354
39๐Ÿ‡ธ๐Ÿ‡ฐ Slovakia$334
40๐Ÿ‡ฑ๐Ÿ‡ง Lebanon$334
41๐Ÿ‡ธ๐Ÿ‡ฎ Slovenia$302
42๐Ÿ‡บ๐Ÿ‡ฆ Ukraine$302
43๐Ÿ‡ญ๐Ÿ‡ท Croatia$294
44๐Ÿ‡จ๐Ÿ‡ฑ Chile$292
45๐Ÿ‡ท๐Ÿ‡ด Romania$258
46๐Ÿ‡ญ๐Ÿ‡บ Hungary$248
47๐Ÿ‡ฎ๐Ÿ‡ช Ireland$235
48๐Ÿ‡ธ๐Ÿ‡จ Seychelles$230
49๐Ÿ‡ฆ๐Ÿ‡ฟ Azerbaijan$226
50๐Ÿ‡ฉ๐Ÿ‡ฟ Algeria$219
51๐Ÿ‡ฆ๐Ÿ‡ฒ Armenia$217
52๐Ÿ‡ง๐Ÿ‡ผ Botswana$215
53๐Ÿ‡ฏ๐Ÿ‡ด Jordan$207
54๐Ÿ‡น๐Ÿ‡ท Turkey$199
55๐Ÿ‡จ๐Ÿ‡ด Colombia$197
56๐Ÿ‡ง๐Ÿ‡ฌ Bulgaria$194
57๐Ÿ‡จ๐Ÿ‡ณ China$183
58๐Ÿ‡ฒ๐Ÿ‡น Malta$175
59๐Ÿ‡จ๐Ÿ‡ฟ Czech Republic$175
60๐Ÿ‡ฎ๐Ÿ‡ท Iran$169
61๐Ÿ‡ณ๐Ÿ‡ฆ Namibia$159
62๐Ÿ‡ฎ๐Ÿ‡ถ Iraq$145
63๐Ÿ‡ช๐Ÿ‡จ Ecuador$138
64๐Ÿ‡ฒ๐Ÿ‡ช Montenegro$137
65๐Ÿ‡ท๐Ÿ‡ธ Serbia$133
66๐Ÿ‡น๐Ÿ‡น Trinidad & Tobago$131
67๐Ÿ‡ฌ๐Ÿ‡ฆ Gabon$124
68๐Ÿ‡ฒ๐Ÿ‡ฆ Morocco$122
69๐Ÿ‡ฌ๐Ÿ‡ถ Equatorial Guinea$112
70๐Ÿ‡ฒ๐Ÿ‡พ Malaysia$109
71๐Ÿ‡ง๐Ÿ‡ท Brazil$107
72๐Ÿ‡น๐Ÿ‡ญ Thailand$97
73๐Ÿ‡ฌ๐Ÿ‡พ Guyana$92
74๐Ÿ‡น๐Ÿ‡ณ Tunisia$91
75๐Ÿ‡ซ๐Ÿ‡ฏ Fiji$83
76๐Ÿ‡ฒ๐Ÿ‡ฐ North Macedonia$83
77๐Ÿ‡ฐ๐Ÿ‡ฟ Kazakhstan$82
78๐Ÿ‡ต๐Ÿ‡ช Peru$81
79๐Ÿ‡ฌ๐Ÿ‡ช Georgia$80
80๐Ÿ‡ง๐Ÿ‡พ Belarus$80
81๐Ÿ‡ฏ๐Ÿ‡ฒ Jamaica$77
82๐Ÿ‡ฆ๐Ÿ‡ฑ Albania$76
83๐Ÿ‡ธ๐Ÿ‡ฟ Eswatini$72
84๐Ÿ‡ฑ๐Ÿ‡ฐ Sri Lanka$69
85๐Ÿ‡ฆ๐Ÿ‡ท Argentina$66
86๐Ÿ‡ง๐Ÿ‡ฟ Belize$60
87๐Ÿ‡ฒ๐Ÿ‡ฝ Mexico$59
88๐Ÿ‡ฉ๐Ÿ‡ด Dominican Republic$58
89๐Ÿ‡ป๐Ÿ‡ณ Viet Nam$58
90๐Ÿ‡ฟ๐Ÿ‡ฆ South Africa$56
91๐Ÿ‡ธ๐Ÿ‡ป El Salvador$54
92๐Ÿ‡ง๐Ÿ‡ฆ Bosnia and Herzegovina$54
93๐Ÿ‡ฎ๐Ÿ‡ณ India$53
94๐Ÿ‡จ๐Ÿ‡ฌ Republic of Congo$53
95๐Ÿ‡ต๐Ÿ‡พ Paraguay$52
96๐Ÿ‡ง๐Ÿ‡ด Bolivia$51
97๐Ÿ‡ต๐Ÿ‡ฐ Pakistan$49
98๐Ÿ‡บ๐Ÿ‡ฟ Uzbekistan$44
99๐Ÿ‡ฆ๐Ÿ‡ด Angola$43
100๐Ÿ‡ฝ๐Ÿ‡ฐ Kosovo$42
101๐Ÿ‡ฒ๐Ÿ‡ท Mauritania$42
102๐Ÿ‡ญ๐Ÿ‡ณ Honduras$42
103๐Ÿ‡ช๐Ÿ‡ฌ Egypt$41
104๐Ÿ‡ฐ๐Ÿ‡ญ Cambodia$36
105๐Ÿ‡ฒ๐Ÿ‡ฒ Myanmar$35
106๐Ÿ‡ต๐Ÿ‡ญ Philippines$33
107๐Ÿ‡ฒ๐Ÿ‡ณ Mongolia$33
108๐Ÿ‡ฎ๐Ÿ‡ฉ Indonesia$31
109๐Ÿ‡ง๐Ÿ‡ฉ Bangladesh$27
110๐Ÿ‡น๐Ÿ‡ฑ Timor Leste$27
111๐Ÿ‡ฒ๐Ÿ‡ฑ Mali$26
112๐Ÿ‡ธ๐Ÿ‡ณ Senegal$24
113๐Ÿ‡จ๐Ÿ‡ฎ Cote d'Ivoire$23
114๐Ÿ‡น๐Ÿ‡ฌ Togo$21
115๐Ÿ‡ฐ๐Ÿ‡ช Kenya$21
116๐Ÿ‡ฐ๐Ÿ‡ฌ Kyrgyzstan$20
117๐Ÿ‡ง๐Ÿ‡ซ Burkina Faso$20
118๐Ÿ‡ฌ๐Ÿ‡ณ Guinea$19
119๐Ÿ‡ฑ๐Ÿ‡ธ Lesotho$19
120๐Ÿ‡จ๐Ÿ‡ป Cape Verde$19
121๐Ÿ‡ฌ๐Ÿ‡น Guatemala$19
122๐Ÿ‡น๐Ÿ‡ฉ Chad$18
123๐Ÿ‡ธ๐Ÿ‡ธ South Sudan$18
124๐Ÿ‡ธ๐Ÿ‡ฉ Sudan$18
125๐Ÿ‡บ๐Ÿ‡ฌ Uganda$18
126๐Ÿ‡ฟ๐Ÿ‡ผ Zimbabwe$17
127๐Ÿ‡ฟ๐Ÿ‡ฒ Zambia$16
128๐Ÿ‡ฒ๐Ÿ‡บ Mauritius$16
129๐Ÿ‡จ๐Ÿ‡ฒ Cameroon$16
130๐Ÿ‡ณ๐Ÿ‡ต Nepal$15
131๐Ÿ‡ณ๐Ÿ‡ฌ Nigeria$14
132๐Ÿ‡ณ๐Ÿ‡ฎ Nicaragua$12
133๐Ÿ‡ฌ๐Ÿ‡ผ Guinea-Bissau$12
134๐Ÿ‡น๐Ÿ‡ฟ Tanzania$12
135๐Ÿ‡จ๐Ÿ‡บ Cuba$11
136๐Ÿ‡ท๐Ÿ‡ผ Rwanda$11
137๐Ÿ‡ฒ๐Ÿ‡ฉ Moldova$11
138๐Ÿ‡ต๐Ÿ‡ฌ Papua New Guinea$10
139๐Ÿ‡ณ๐Ÿ‡ช Niger$10
140๐Ÿ‡น๐Ÿ‡ฏ Tajikistan$9
141๐Ÿ‡จ๐Ÿ‡ซ Central African Republic$8
142๐Ÿ‡ฒ๐Ÿ‡ฟ Mozambique$8
143๐Ÿ‡ฌ๐Ÿ‡ญ Ghana$8
144๐Ÿ‡ง๐Ÿ‡ฏ Benin$7
145๐Ÿ‡ง๐Ÿ‡ฎ Burundi$7
146๐Ÿ‡ฆ๐Ÿ‡ซ Afghanistan$6
147๐Ÿ‡ฌ๐Ÿ‡ฒ Gambia$6
148๐Ÿ‡ช๐Ÿ‡น Ethiopia$5
149๐Ÿ‡ป๐Ÿ‡ช Venezuela$5
150๐Ÿ‡ฒ๐Ÿ‡ผ Malawi$4
151๐Ÿ‡ธ๐Ÿ‡ฑ Sierra Leone$3
152๐Ÿ‡ฒ๐Ÿ‡ฌ Madagascar$3
153๐Ÿ‡จ๐Ÿ‡ฉ Dem. Rep. of Congo$3
154๐Ÿ‡ฑ๐Ÿ‡ท Liberia$3
155๐Ÿ‡ญ๐Ÿ‡น Haiti$2
156๐Ÿ‡จ๐Ÿ‡ท Costa Rica$0
157๐Ÿ‡ฎ๐Ÿ‡ธ Iceland$0
158๐Ÿ‡ต๐Ÿ‡ฆ Panama$0

Measured this way, we get a perspective of how small defense budgets can be per person, even if the total expenditure is large.

For example, India has the fourth-highest total defense expenditure in 2022, but because of its massive population only sets aside $53 per resident for its military, putting it solidly at the bottom third of the per-capita rankings.

Patterns Revealed By Measuring Military Spend

Changing how we look at a countryโ€™s military budget can reveal a lot more than just looking at absolute numbers.

For example, the Middle East is the region with the highest spenders on defense as a percentage of their GDP, giving us insight into regional security concerns.

Countries from the medium group of military spendingโ€”including parts of Eastern Europe, sub-Saharan Africa, and South Asiaโ€”highlight past or recent conflict zones between neighbors, countries with internal strife, or countries wary of a regional aggressor. Ukraine’s average per capita military spend, for example, was just $122.4 from 2018 to 2021. The next year, it jumped nearly 10 times to $1,018.66 per person after Russia’s invasion.

In fact, European military spending saw its sharpest one-year jump in 30 years as a direct result of the war.

Alongside European anxieties, ongoing tension between China and Taiwan has also contributed to increased military spending in Asia and Oceania. Will these budgets continue their dramatic ascent or will they rise evenly alongside their relative economies in 2023?

Data note: For these comparisons, the creator is calculating five-year averages (using data from 2018-2022) for military spending as a percentage of GDP and per-capita military spending for each country. The military expenditure data is pulled from Stockholm International Peace Research Institute.

Data for some countries is missing or may vary significantly from official figures. Countries with up to
two years of missing data had averages calculated on the years available, while countries with three or more years of missing data have been removed from this dataset, including: Djibouti, Eritrea, North Korea, Laos, Libya, Somalia, Syria, Turkmenistan, UAE, and Yemen.

Please see SIPRI’s methodologies page for more details on how they collect their data and create estimates.

Continue Reading

Subscribe

Popular