Culture
Ranked: Which Countries Drink the Most Beer?
Visualizing Global Beer Consumption
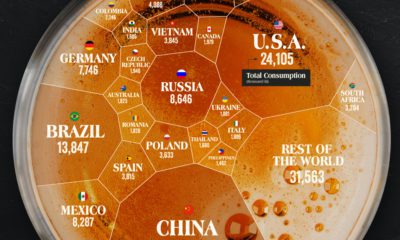
Global beer consumption exceeded 185 million kiloliters in 2021, enough to fill more than 74,000 Olympic-sized swimming pools.
So, which countries drink the most beer?
This graphic uses data from Kirin Holdings to compare global beer consumption by country. The Japanese company has been tracking beer consumption around the world since 1975.
Which Countries Drink the Most Beer?
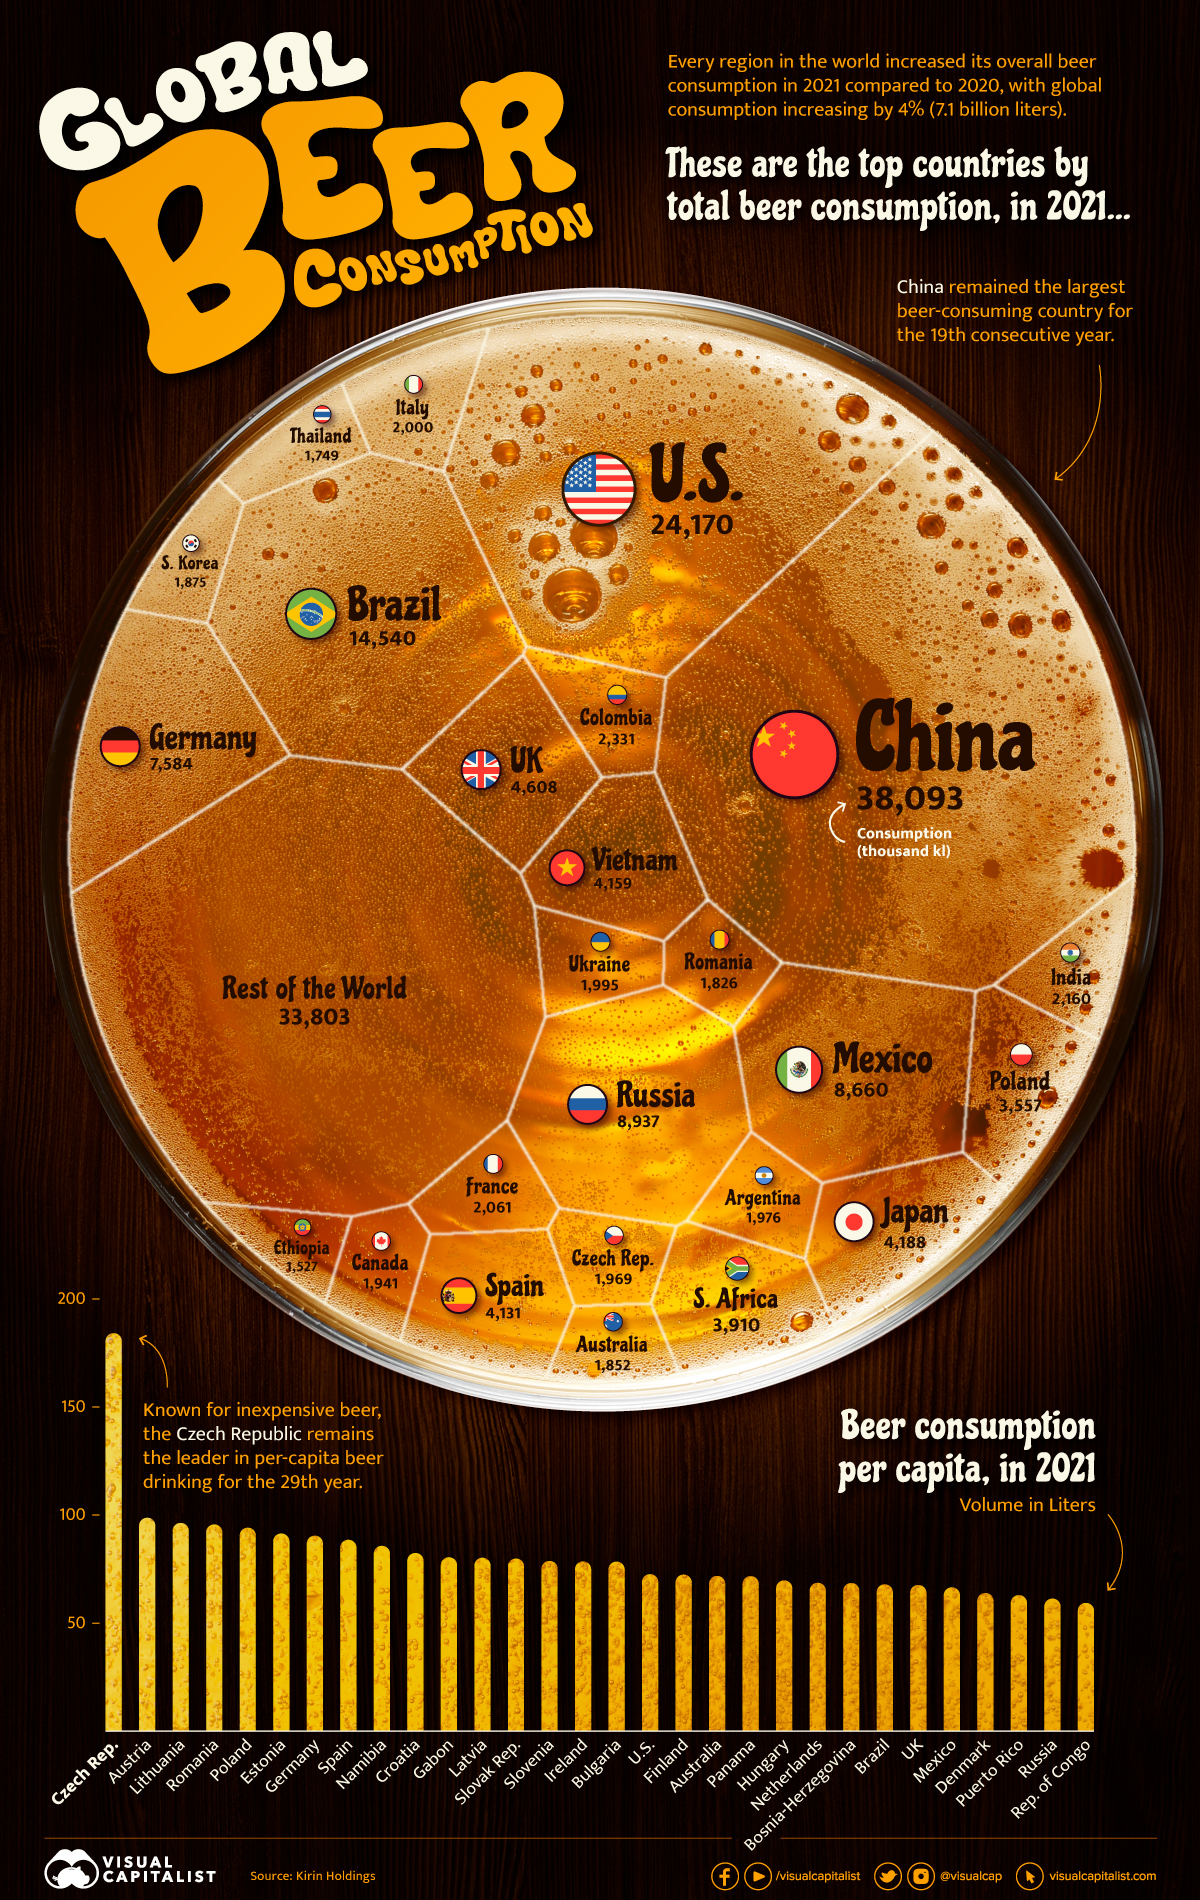
Every region in the world increased its overall beer consumption in 2021 compared to 2020, with global consumption rising by 4%.
Asia holds a 31% share of the global beer market, remaining the world’s largest beer-consuming region over the last 14 years.
| Rank | Country | Total Consumption (thousand kl) | Market Share |
|---|---|---|---|
| 1 | 🇨🇳 China | 38,093 | 20.5% |
| 2 | 🇺🇸 U.S. | 24,170 | 13.0% |
| 3 | 🇧🇷 Brazil | 14,540 | 7.8% |
| 4 | 🇷🇺 Russia | 8,937 | 4.8% |
| 5 | 🇲🇽 Mexico | 8,660 | 4.7% |
| 6 | 🇩🇪 Germany | 7,584 | 4.1% |
| 7 | 🇬🇧 United Kingdom | 4,608 | 2.5% |
| 8 | 🇯🇵 Japan | 4,188 | 2.3% |
| 9 | 🇻🇳 Vietnam | 4,159 | 2.2% |
| 10 | 🇪🇸 Spain | 4,131 | 2.2% |
China was the largest beer-consuming country for the 19th consecutive year.
The tradition of brewing and enjoying beer in China spans approximately nine millennia. Recent archaeological discoveries have revealed that as far back as 7000 BC, ancient Chinese communities were engaged in producing beer-like alcoholic beverages, primarily on a small and localized basis.
China was also the leading producer of beer in 2022, followed by the United States.
Beer Consumption Per Capita
When examining per capita beer consumption, Asia falls behind Europe. In fact, nine of the top 10 consumers of beer per capita are European nations.
The Czech Republic remains the leader in per capita beer drinking for the 29th year. In 2021, the average Czech drank more than 184 liters of beer.
| Rank | Country | Per Capita Beer Consumption (volume in liters) | Total Consumption (thousand kl) |
|---|---|---|---|
| 1 | 🇨🇿 Czech Republic | 184.1 | 1,969 |
| 2 | 🇦🇹 Austria | 98.7 | 888 |
| 3 | 🇱🇹 Lithuania | 96.3 | 260 |
| 4 | 🇷🇴 Romania | 95.6 | 1,826 |
| 5 | 🇵🇱 Poland | 94.1 | 3,557 |
| 6 | 🇪🇪 Estonia | 91.4 | 119 |
| 7 | 🇩🇪 Germany | 90.4 | 7,584 |
| 8 | 🇪🇸 Spain | 88.5 | 4,131 |
| 9 | 🇳🇦 Namibia | 85.7 | 223 |
| 10 | 🇭🇷 Croatia | 82.4 | 338 |
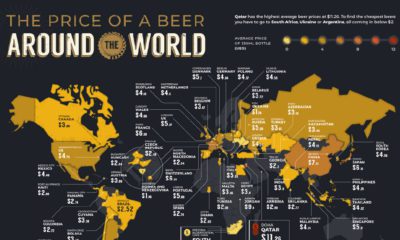
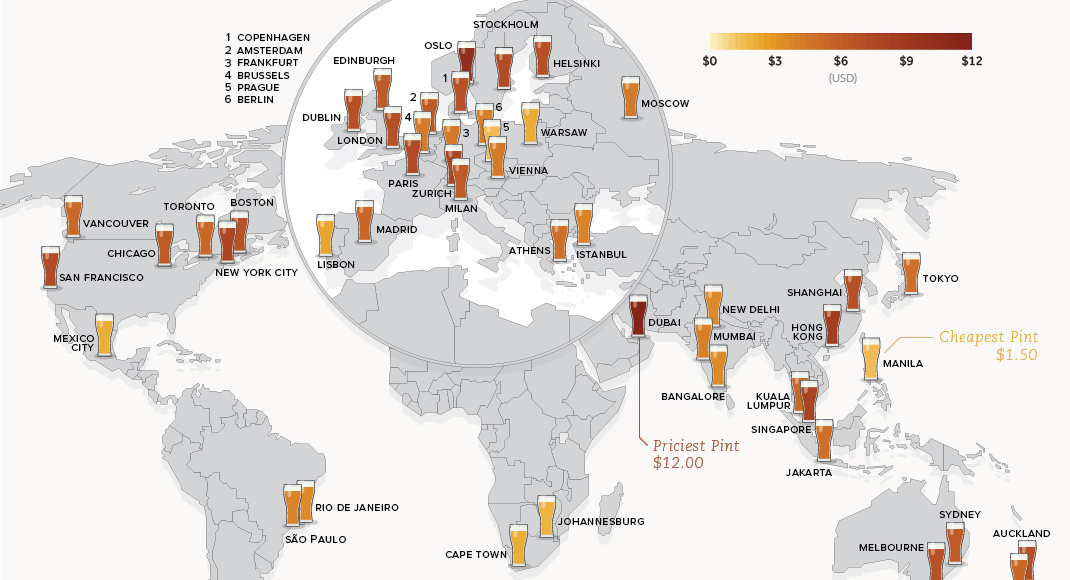
The Czech Republic is known for its affordable beer. In some parts of the country, beer can even cost less than bottled water.
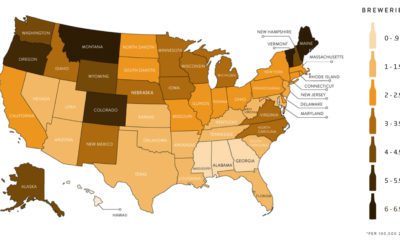
Small Brewers and Technology
Beer production is expected to rise over the next decade, boosted by new smaller brewers, particularly in Western countries.
Investments have also been made in new technology to expedite the brewing process, including the utilization of ‘BeerBots’ capable of accelerating the fermentation process.
According to Future Market Insights, the global beer market is projected to be valued at $690 billion in 2023, rising to $996 billion by 2033.


Brands
How Tech Logos Have Evolved Over Time
From complete overhauls to more subtle tweaks, these tech logos have had quite a journey. Featuring: Google, Apple, and more.


How Tech Logos Have Evolved Over Time
This was originally posted on our Voronoi app. Download the app for free on iOS or Android and discover incredible data-driven charts from a variety of trusted sources.
One would be hard-pressed to find a company that has never changed its logo. Granted, some brands—like Rolex, IBM, and Coca-Cola—tend to just have more minimalistic updates. But other companies undergo an entire identity change, thus necessitating a full overhaul.
In this graphic, we visualized the evolution of prominent tech companies’ logos over time. All of these brands ranked highly in a Q1 2024 YouGov study of America’s most famous tech brands. The logo changes are sourced from 1000logos.net.
How Many Times Has Google Changed Its Logo?
Google and Facebook share a 98% fame rating according to YouGov. But while Facebook’s rise was captured in The Social Network (2010), Google’s history tends to be a little less lionized in popular culture.
For example, Google was initially called “Backrub” because it analyzed “back links” to understand how important a website was. Since its founding, Google has undergone eight logo changes, finally settling on its current one in 2015.
| Company | Number of Logo Changes |
|---|---|
| 8 | |
| HP | 8 |
| Amazon | 6 |
| Microsoft | 6 |
| Samsung | 6 |
| Apple | 5* |
Note: *Includes color changes. Source: 1000Logos.net
Another fun origin story is Microsoft, which started off as Traf-O-Data, a traffic counter reading company that generated reports for traffic engineers. By 1975, the company was renamed. But it wasn’t until 2012 that Microsoft put the iconic Windows logo—still the most popular desktop operating system—alongside its name.
And then there’s Samsung, which started as a grocery trading store in 1938. Its pivot to electronics started in the 1970s with black and white television sets. For 55 years, the company kept some form of stars from its first logo, until 1993, when the iconic encircled blue Samsung logo debuted.
Finally, Apple’s first logo in 1976 featured Isaac Newton reading under a tree—moments before an apple fell on his head. Two years later, the iconic bitten apple logo would be designed at Steve Jobs’ behest, and it would take another two decades for it to go monochrome.

-

 Debt1 week ago
How Debt-to-GDP Ratios Have Changed Since 2000
-

 Countries2 weeks ago
Population Projections: The World’s 6 Largest Countries in 2075
-

 Markets2 weeks ago
The Top 10 States by Real GDP Growth in 2023
-

 Demographics2 weeks ago
The Smallest Gender Wage Gaps in OECD Countries
-

 United States2 weeks ago
Where U.S. Inflation Hit the Hardest in March 2024
-

 Green2 weeks ago
Top Countries By Forest Growth Since 2001
-

 United States2 weeks ago
Ranked: The Largest U.S. Corporations by Number of Employees
-

 Maps2 weeks ago
The Largest Earthquakes in the New York Area (1970-2024)