Misc
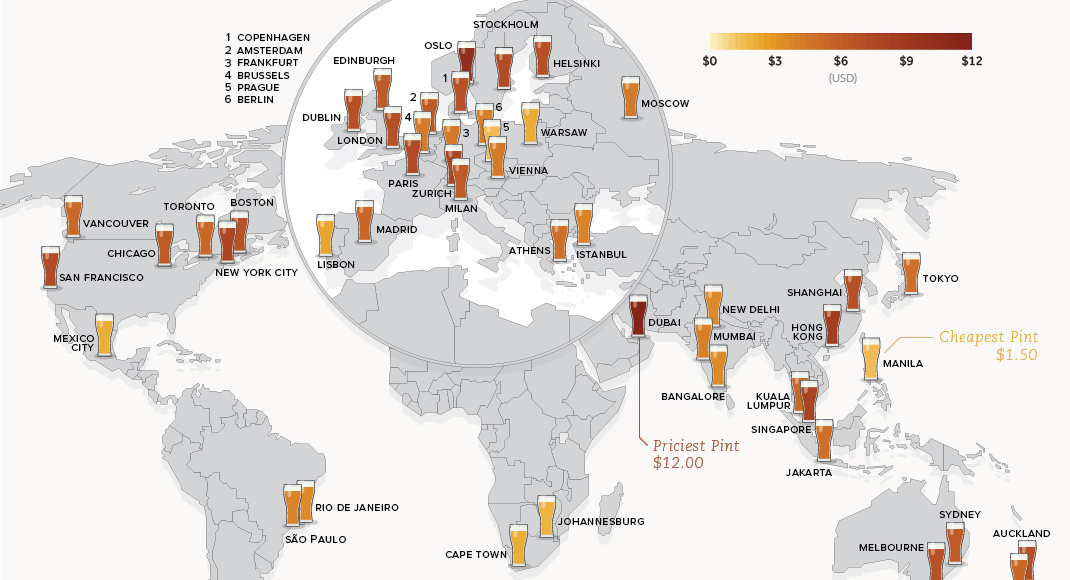
Mapping the Price of Beer Around the World
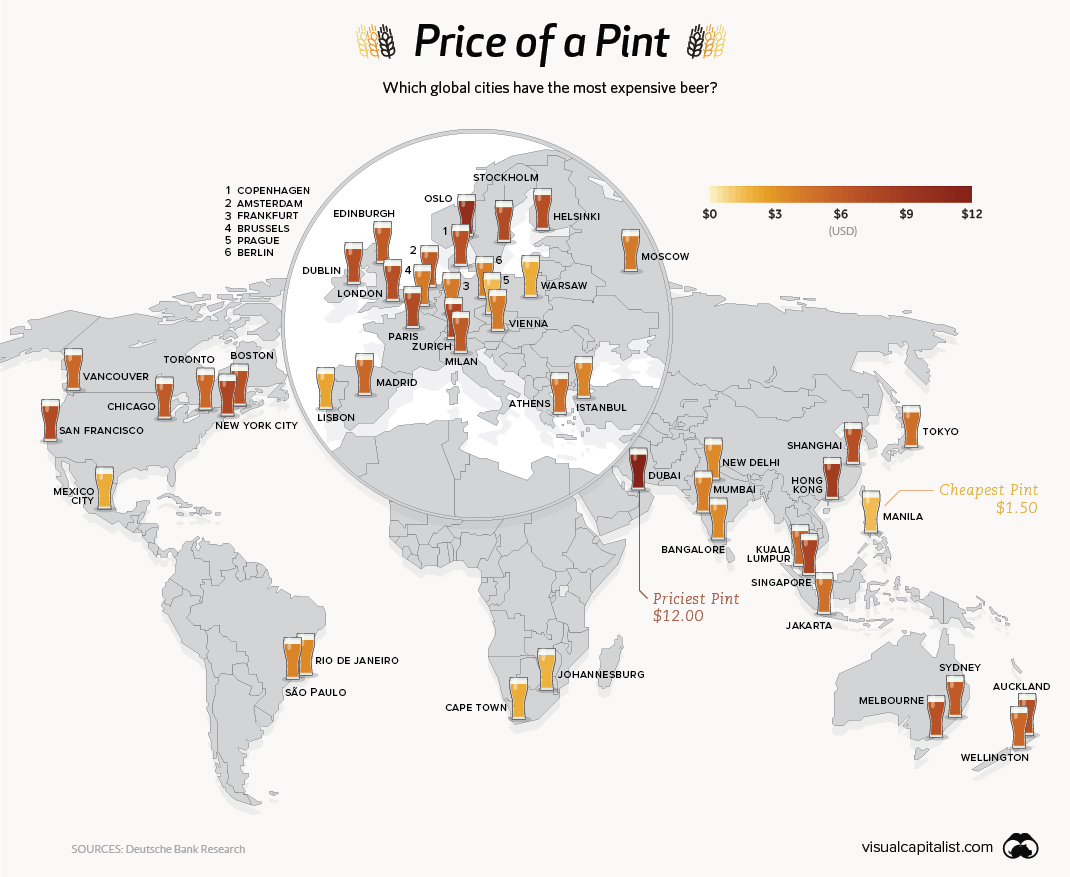


Mapping the Price of Beer Around the World
Whether you’re sipping a pint of kölsch in Germany or drinking a Heineken at a hotel bar in Hong Kong, there are a number of factors that can influence how much your beverage will cost. Cost of living is certainly a primary factor, but taxes, availability, type of establishment, type of beer (craft beer vs macro brew), and local tastes will also affect the price of your pint.
Analysts at Deutsche Bank recently gathered critical data on how much a pint of beer costs in various major cities around the world.
Sticker Shock
Many of the cities that topped the price list have a higher cost of living, and it’s no surprise to see Singapore and Oslo rank near the top.
The city of Dubai, however, is a unique case.
Technically, drinking is only permissible for expats and non-Muslim residents in Dubai, and being drunk in public can come with serious consequences. That said, the city’s establishments serve beer with prices that reflect its high-end look and feel. Considering the scarcity and heavy regulations, those craving a pint might be happy to overlook the price tag of $12.
Cheap Thrills
The thirsty citizens of the Czech Republic consume the most beer by a long shot – a full 36% more than neighbors Austria and Germany. This is partially because demand is so high that companies are willing to compete on cost. As a result, beer is often cheaper than water in restaurants and pubs in Prague.
Manila’s low cost of living and steady supply of domestic beer earned it the lowest price per pint on the Beer Price List. San Miguel, the Philippines’ largest brewery, dominates with a market share of over 90%, and beer consumption is also on the rise in the country.
The 48 Pack
The median price of beer in the 48 cities analyzed was $5.70, and below is the full list of cities ordered from most to least expensive pint.
| Rank | City | Country | Price of Beer Pint |
|---|---|---|---|
| #1 | Dubai | United Arab Emirates | $12.00 |
| #2 | Oslo | Norway | $10.30 |
| #3 | Hong Kong | China | $8.90 |
| #4 | Singapore | Singapore | $8.30 |
| #5 | Zurich | Switzerland | $7.70 |
| #6 | New York City | United States | $7.70 |
| #7 | San Francisco | United States | $7.70 |
| #8 | Paris | France | $7.30 |
| #9 | Stockholm | Sweden | $7.30 |
| #10 | London | United Kingdom | $7.20 |
| #11 | Dublin | Ireland | $7.10 |
| #12 | Helsinki | Finland | $7.10 |
| #13 | Auckland | New Zealand | $7.00 |
| #14 | Shanghai | China | $7.00 |
| #15 | Melbourne | Australia | $6.80 |
| #16 | Copenhagen | Denmark | $6.70 |
| #17 | Boston | United States | $6.70 |
| #18 | Milan | Italy | $6.50 |
| #19 | Amsterdam | Netherlands | $6.10 |
| #20 | Sydney | Australia | $6.10 |
| #21 | Edinburgh | United Kingdom | $6.00 |
| #22 | Chicago | United States | $5.70 |
| #23 | Madrid | Spain | $5.70 |
| #24 | Toronto | Canada | $5.70 |
| #25 | Wellington | New Zealand | $5.70 |
| #26 | Vancouver | Canada | $5.50 |
| #27 | Kuala Lumpur | Malaysia | $5.40 |
| #28 | Athens | Greece | $5.10 |
| #29 | Jakarta | Indonesia | $5.00 |
| #30 | Tokyo | Japan | $5.00 |
| #31 | Moscow | Russia | $4.70 |
| #32 | Vienna | Austria | $4.60 |
| #33 | Frankfurt | Germany | $4.60 |
| #34 | Brussels | Belgium | $4.50 |
| #35 | Mumbai | India | $3.90 |
| #36 | Berlin | Germany | $3.90 |
| #37 | São Paulo | Brazil | $3.70 |
| #38 | Istanbul | Turkey | $3.70 |
| #39 | New Delhi | India | $3.40 |
| #40 | Bangalore | India | $3.20 |
| #41 | Rio de Janeiro | Brazil | $3.20 |
| #42 | Lisbon | Portugal | $2.80 |
| #43 | Warsaw | Poland | $2.60 |
| #44 | Cape Town | South Africa | $2.60 |
| #45 | Mexico City | Mexico | $2.40 |
| #46 | Johannesburg | South Africa | $2.20 |
| #47 | Prague | Czech Republic | $1.60 |
| #48 | Manila | Philippines | $1.50 |
It’s worth noting that the data collection focuses on expat (read: touristy) areas of the city. While that’s not a perfect picture of prices in a city, it does allow for a more consistent comparison of wildly differing markets.


Misc
How Hard Is It to Get Into an Ivy League School?
We detail the admission rates and average annual cost for Ivy League schools, as well as the median SAT scores required to be accepted.


How Hard Is It to Get Into an Ivy League School?
This was originally posted on our Voronoi app. Download the app for free on iOS or Android and discover incredible data-driven charts from a variety of trusted sources.
Ivy League institutions are renowned worldwide for their academic excellence and long-standing traditions. But how hard is it to get into one of the top universities in the U.S.?
In this graphic, we detail the admission rates and average annual cost for Ivy League schools, as well as the median SAT scores required to be accepted. The data comes from the National Center for Education Statistics and was compiled by 24/7 Wall St.
Note that “average annual cost” represents the net price a student pays after subtracting the average value of grants and/or scholarships received.
Harvard is the Most Selective
The SAT is a standardized test commonly used for college admissions in the United States. It’s taken by high school juniors and seniors to assess their readiness for college-level academic work.
When comparing SAT scores, Harvard and Dartmouth are among the most challenging universities to gain admission to. The median SAT scores for their students are 760 for reading and writing and 790 for math. Still, Harvard has half the admission rate (3.2%) compared to Dartmouth (6.4%).
| School | Admission rate (%) | SAT Score: Reading & Writing | SAT Score: Math | Avg Annual Cost* |
|---|---|---|---|---|
| Harvard University | 3.2 | 760 | 790 | $13,259 |
| Columbia University | 3.9 | 750 | 780 | $12,836 |
| Yale University | 4.6 | 760 | 780 | $16,341 |
| Brown University | 5.1 | 760 | 780 | $26,308 |
| Princeton University | 5.7 | 760 | 780 | $11,080 |
| Dartmouth College | 6.4 | 760 | 790 | $33,023 |
| University of Pennsylvania | 6.5 | 750 | 790 | $14,851 |
| Cornell University | 7.5 | 750 | 780 | $29,011 |
*Costs after receiving federal financial aid.
Additionally, Dartmouth has the highest average annual cost at $33,000. Princeton has the lowest at $11,100.
While student debt has surged in the United States in recent years, hitting $1.73 trillion in 2023, the worth of obtaining a degree from any of the schools listed surpasses mere academics. This is evidenced by the substantial incomes earned by former students.
Harvard grads, for example, have the highest average starting salary in the country, at $91,700.

-

 Real Estate2 weeks ago
Visualizing America’s Shortage of Affordable Homes
-

 Technology1 week ago
Ranked: Semiconductor Companies by Industry Revenue Share
-

 Money1 week ago
Which States Have the Highest Minimum Wage in America?
-

 Real Estate1 week ago
Ranked: The Most Valuable Housing Markets in America
-

 Business2 weeks ago
Charted: Big Four Market Share by S&P 500 Audits
-

 AI2 weeks ago
The Stock Performance of U.S. Chipmakers So Far in 2024
-

 Misc2 weeks ago
Almost Every EV Stock is Down After Q1 2024
-

 Money2 weeks ago
Where Does One U.S. Tax Dollar Go?