Misc
Ranked: The World’s Largest Stadiums
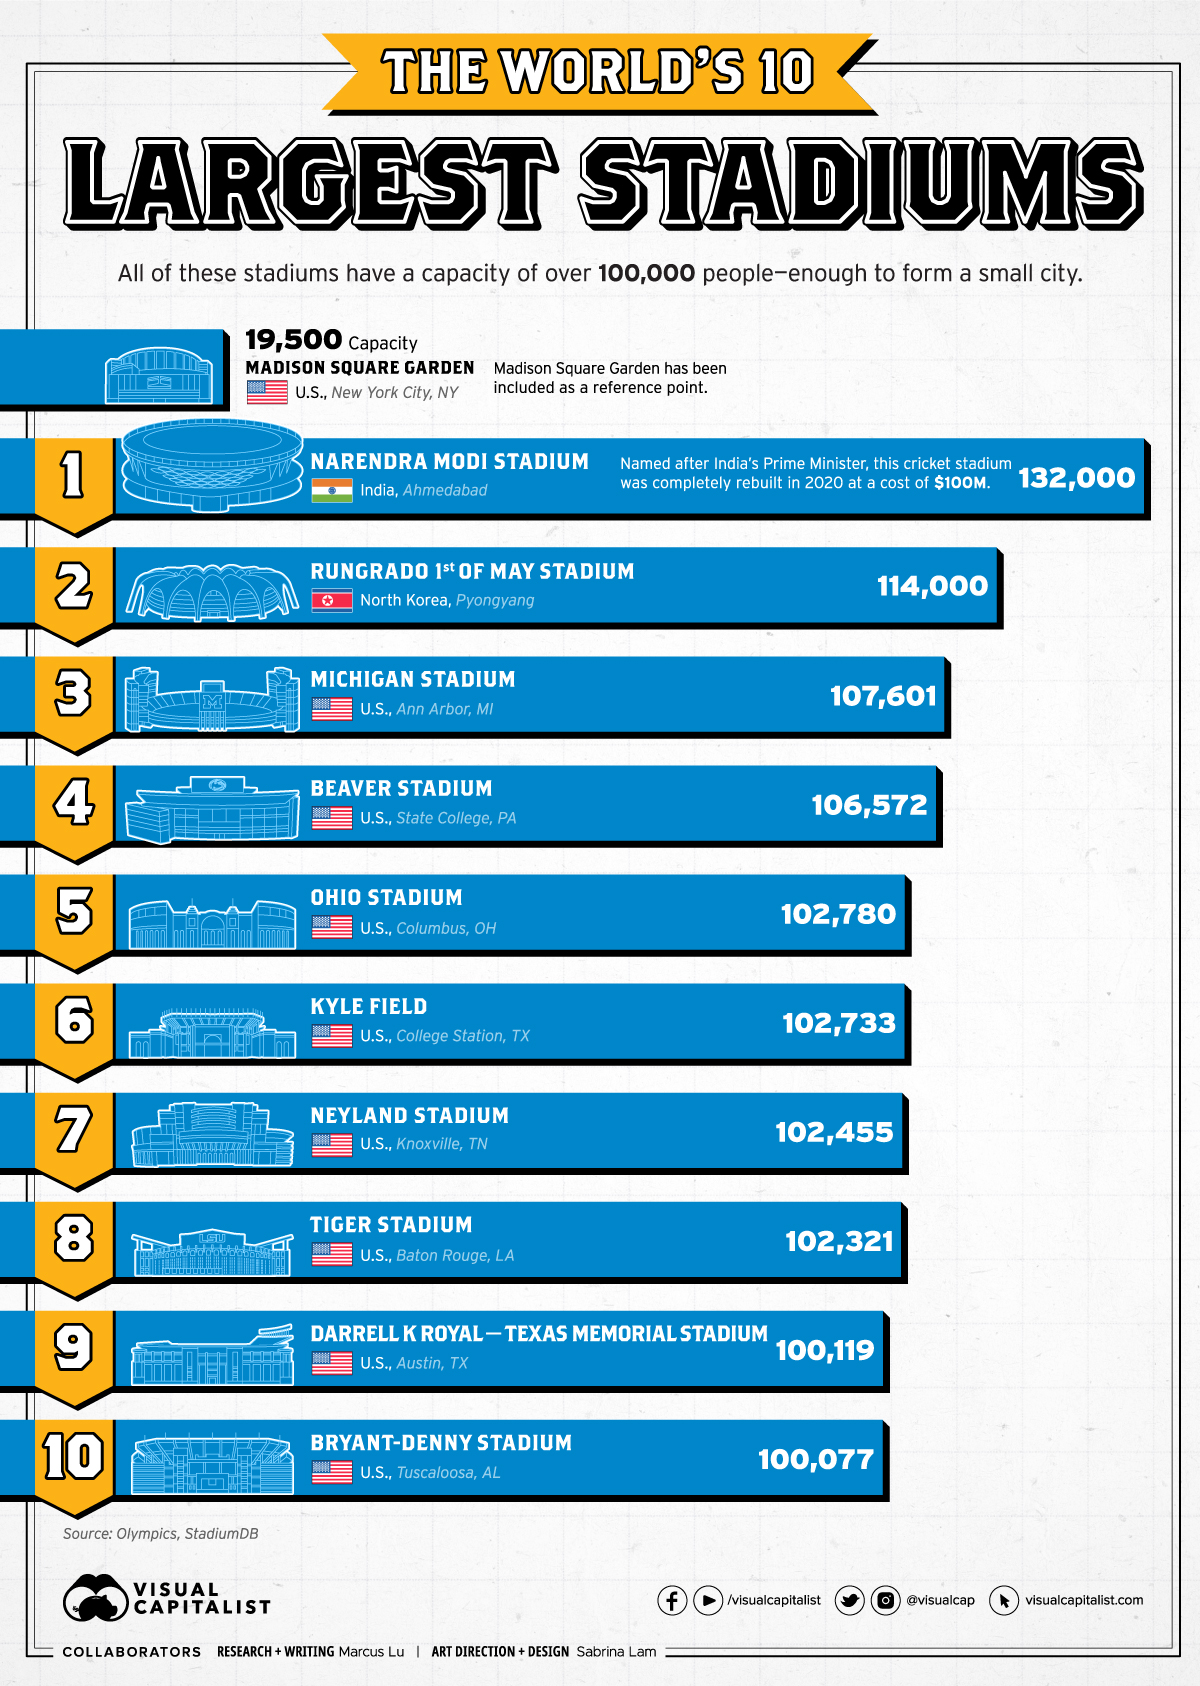
Ranking The World’s Largest Stadiums
From football games to live concerts, stadiums serve as a gathering place for some of life’s most exciting moments.
While some stadiums are famous for their history, others are truly massive in size, capable of seating over 100,000 people at once. In this graphic, we’ve ranked the 10 largest stadiums in the world by seating capacity, with Madison Square Garden included as a reference point.
Data and Highlights
As shown in the graphic above, the world’s largest stadium belongs to India. Named after the country’s Prime Minister, the Narendra Modi Stadium was designed to host cricket games.
See below for the full list in tabular format.
| Rank | Stadium | Country | City | Capacity |
|---|---|---|---|---|
| 1 | Narendra Modi Stadium | 🇮🇳 India | Ahmedabad | 132,000 |
| 2 | Rungrado 1st of May Stadium | 🇰🇵 North Korea | Pyongyang | 114,000 |
| 3 | Michigan Stadium | 🇺🇸 US | Ann Arbor, MI | 107,601 |
| 4 | Beaver Stadium | 🇺🇸 US | State College, PA | 106,572 |
| 5 | Ohio Stadium | 🇺🇸 US | Columbus, OH | 102,780 |
| 6 | Kyle Field | 🇺🇸 US | College Station, TX | 102,733 |
| 7 | Neyland Stadium | 🇺🇸 US | Knoxville, TN | 102,455 |
| 8 | Tiger Stadium | 🇺🇸 US | Baton Rouge, LA | 102,321 |
| 9 | Darrell K Royal - Texas Memorial Stadium | 🇺🇸 US | Austin, TX | 100,119 |
| 10 | Bryant-Denny Stadium | 🇺🇸 US | Tuscaloosa, AL | 100,077 |
The number two spot is held by Rungrado 1st of May Stadium, which is surprisingly located in North Korea. It was completed in 1989 with the purpose of hosting the 13th World Festival of Youth and Students, and is now used to host various government events.
It’s interesting to note that this arena initially had a higher capacity of 150,000 people, but was reduced to 114,000 after renovations in 2014.
Looking further down the list, the third to tenth largest stadiums belong to the United States. All of these arenas are primarily used for college football, serving as the home field for their respective university team.
A shocking fact is that these arenas are significantly larger than NFL stadiums. For example, the largest NFL stadium is MetLife Stadium, which has a seating capacity of 82,500.
The Runner-Ups
While just three countries are represented in the top 10 list, there is plenty of geographical diversity once we look a little further down. Shown below are the 11th to 14th largest stadiums in the world.
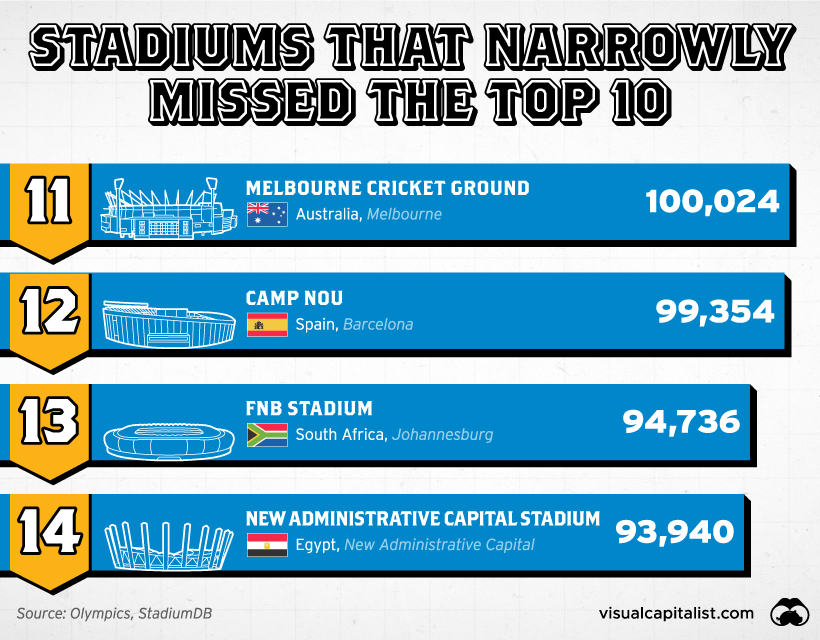
Camp Nou and FNB Stadium are two historic soccer stadiums which have both hosted a FIFA World Cup tournament. Camp Nou is owned by FC Barcelona, the world’s third most valuable soccer club.
New Administrative Capital Stadium is expected to replace the Cairo International Stadium as Egypt’s new national arena, and could be used to host the Olympics or a FIFA World Cup in the future if called upon.


VC+
VC+: Get Our Key Takeaways From the IMF’s World Economic Outlook
A sneak preview of the exclusive VC+ Special Dispatch—your shortcut to understanding IMF’s World Economic Outlook report.

Have you read IMF’s latest World Economic Outlook yet? At a daunting 202 pages, we don’t blame you if it’s still on your to-do list.
But don’t worry, you don’t need to read the whole April release, because we’ve already done the hard work for you.
To save you time and effort, the Visual Capitalist team has compiled a visual analysis of everything you need to know from the report—and our VC+ Special Dispatch is available exclusively to VC+ members. All you need to do is log into the VC+ Archive.
If you’re not already subscribed to VC+, make sure you sign up now to access the full analysis of the IMF report, and more (we release similar deep dives every week).
For now, here’s what VC+ members get to see.
Your Shortcut to Understanding IMF’s World Economic Outlook
With long and short-term growth prospects declining for many countries around the world, this Special Dispatch offers a visual analysis of the key figures and takeaways from the IMF’s report including:
- The global decline in economic growth forecasts
- Real GDP growth and inflation forecasts for major nations in 2024
- When interest rate cuts will happen and interest rate forecasts
- How debt-to-GDP ratios have changed since 2000
- And much more!

Get the Full Breakdown in the Next VC+ Special Dispatch
VC+ members can access the full Special Dispatch by logging into the VC+ Archive, where you can also check out previous releases.
Make sure you join VC+ now to see exclusive charts and the full analysis of key takeaways from IMF’s World Economic Outlook.
Don’t miss out. Become a VC+ member today.
What You Get When You Become a VC+ Member
VC+ is Visual Capitalist’s premium subscription. As a member, you’ll get the following:
- Special Dispatches: Deep dive visual briefings on crucial reports and global trends
- Markets This Month: A snappy summary of the state of the markets and what to look out for
- The Trendline: Weekly curation of the best visualizations from across the globe
- Global Forecast Series: Our flagship annual report that covers everything you need to know related to the economy, markets, geopolitics, and the latest tech trends
- VC+ Archive: Hundreds of previously released VC+ briefings and reports that you’ve been missing out on, all in one dedicated hub
You can get all of the above, and more, by joining VC+ today.

-

 Debt1 week ago
How Debt-to-GDP Ratios Have Changed Since 2000
-

 Countries2 weeks ago
Population Projections: The World’s 6 Largest Countries in 2075
-

 Markets2 weeks ago
The Top 10 States by Real GDP Growth in 2023
-

 Demographics2 weeks ago
The Smallest Gender Wage Gaps in OECD Countries
-

 United States2 weeks ago
Where U.S. Inflation Hit the Hardest in March 2024
-

 Green2 weeks ago
Top Countries By Forest Growth Since 2001
-

 United States2 weeks ago
Ranked: The Largest U.S. Corporations by Number of Employees
-

 Maps2 weeks ago
The Largest Earthquakes in the New York Area (1970-2024)