Markets
Visualizing the Rise of Women on Boards of Directors Worldwide
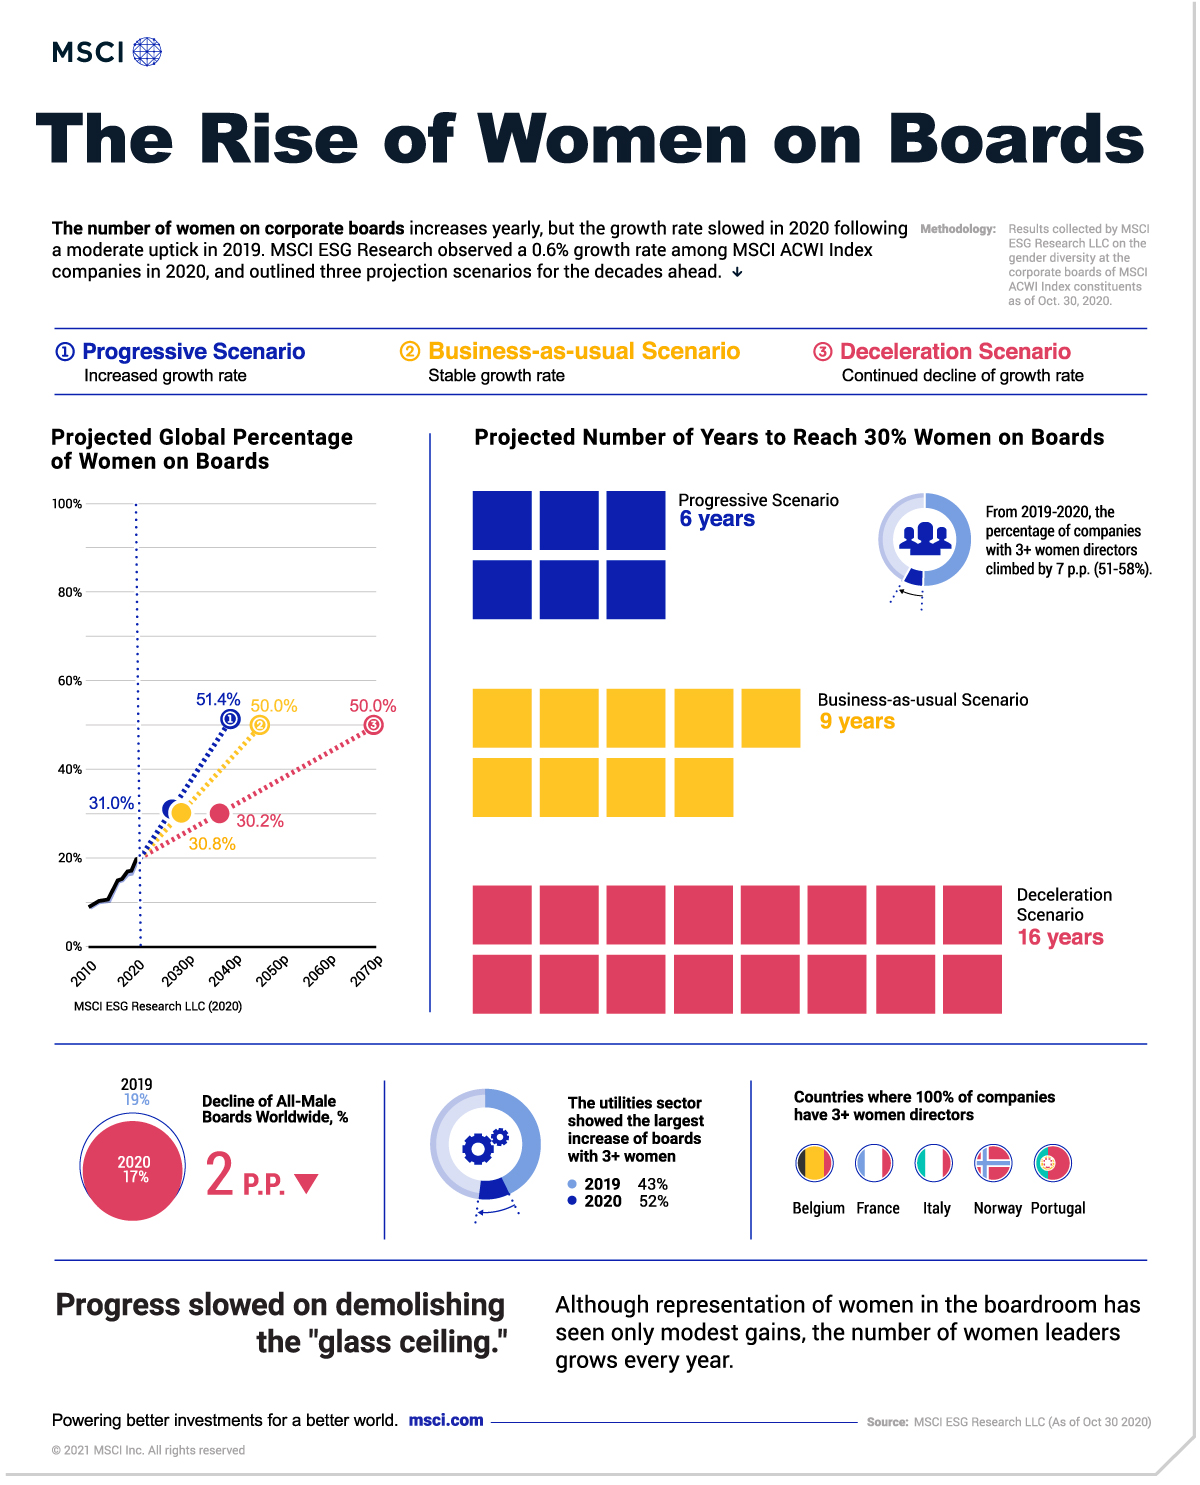
The Rise of Women on Boards of Directors Worldwide
Women’s representation in the boardroom is a mixed bag. The number of women on boards is rising across the globe—but the rate of increase has slowed for three of the past four years.
Based on MSCI research of All Country World Index (ACWI) constituent companies, the graphic above reveals a 10-year trend of women’s representation on corporate boards, and projects three future scenarios on the way to parity.
ESG Goals: The Path to Parity
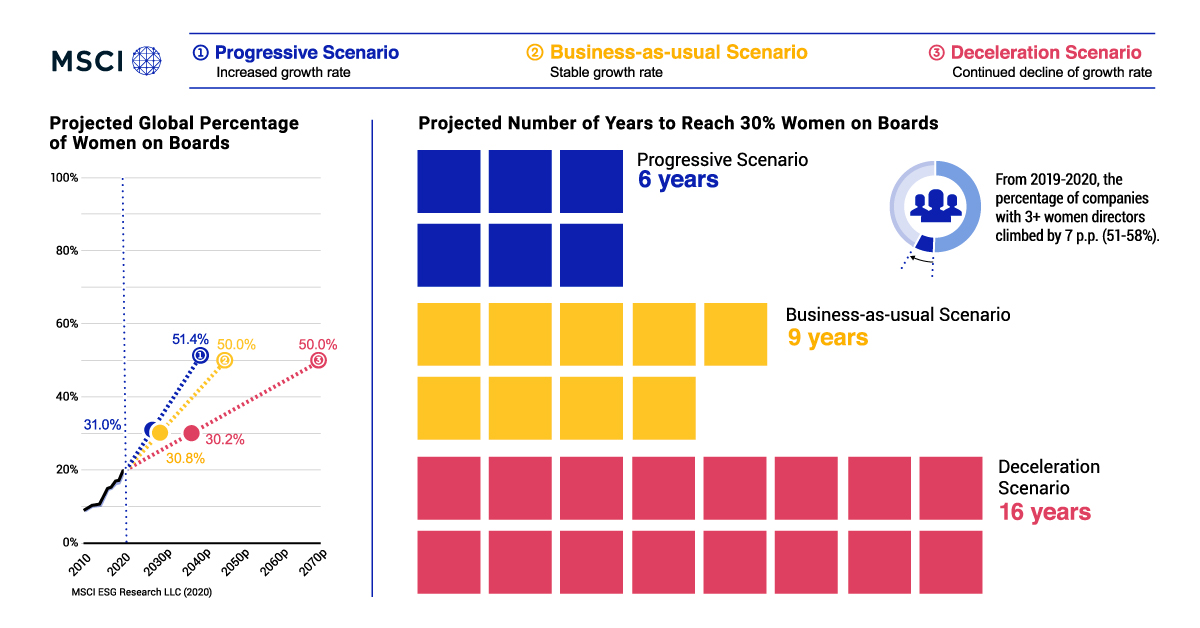
The ESG ecosystem considers 30% representation to be a critical milestone on the road to reaching gender parity on corporate boards of directors.
Following a small uptick in 2019—and two years of slowed growth from 2017 to 2018—the rise of women on boards slowed again in 2020, gaining 0.6 percentage points (p.p.).
Based on different forward-looking scenarios, here’s how long it could take to reach equal representation:
| Progressive scenario | Business-as-usual scenario | Deceleration scenario | |
|---|---|---|---|
| Years to reach 30% Women on Boards (WoB) | 6 years | 9 years | 16 years |
| Year we may reach >50% WoB | 2039 | 2045 | 2070 |
Source: MSCI ESG Research LLC as of Oct. 30, 2020.
On the whole, parity on corporate boards could be reached as early as 2039 or as late as 2070.
Women’s Representation: State of the Unions
MSCI research reveals trends that highlight significant traction. In 2020, fewer women became directors, but all-male boards continued to decline worldwide to 17% in 2020 (a 2 p.p. drop) among the ACWI contingent.
This trend is partially driven by emerging markets, where all-male boards dropped to 31%, from over 34% initially. Hong Kong is one of the few countries that actually experienced an increase of 5 p.p. in all-male boards. In contrast, Saudi Arabia’s share reduced by 8 p.p. to 86% in 2020.
| Country | % Companies with 3+ WoB | Country | % Companies with no WoB |
|---|---|---|---|
| 🇳🇴 Norway | 100% | 🇶🇦 Qatar | 100% |
| 🇮🇹 Italy | 100% | 🇸🇦 Saudi Arabia | 86% |
| 🇧🇪 Belgium | 100% | 🇦🇷 Argentina | 67% |
| 🇵🇹 Portugal | 100% | 🇭🇺 Hungary | 67% |
| 🇫🇷 France | 100% | 🇰🇷 South Korea | 65% |
| 🇸🇪 Sweden | 91% | 🇦🇪 UAE | 63% |
| 🇫🇮 Finland | 91% | 🇨🇱 Chile | 44% |
| 🇪🇸 Spain | 90% | 🇲🇽 Mexico | 38% |
| 🇬🇧 UK | 85% | 🇭🇰 Hong Kong | 37% |
| 🇦🇹 Austria | 83% | 🇮🇩 Indonesia | 36% |
Source: MSCI ESG Research LLC as of Oct. 30, 2020.
Europe continues to lead the world in gender representation on boards. All top 10 countries with three or more women directors are found in the region, with countries like Norway, Italy, and Belgium being the closest to reaching parity.
Across sectors, utilities experienced the largest increase in companies with three or more women on boards, with a 9% jump between 2019-2020.
The Other Glass Ceiling: The C-Suite
The number of women CEOs remains low across all regions, but CFO roles show more promise.
| MSCI World, 2017 | MSCI World, 2020 | MSCI EM, 2017 | MSCI EM, 2020 | |
|---|---|---|---|---|
| Women in CEO roles | 4.7% | 4.9% | 3.3% | 4.8% |
| Women in CFO roles | 9.4% | 12.1% | 9.8% | 18.7% |
Source: MSCI ESG Research LLC as of Oct. 30, 2020.
This global rise is also largely thanks to emerging markets. Since 2017, emerging market companies have exhibited higher percentages of CFOs than companies in developed markets, and the difference is widening.
The Glass Ceiling Isn’t Unbreakable
As MSCI reports, the progress towards parity in boardrooms does not necessarily represent the workplace. Emerging research suggests that women have been more negatively impacted by the pandemic’s economic fallout—potentially undoing several years’ worth of improvements.
However, developing nations still show promising results in key indicators of gender diversity, with further opportunity to grow corporate bottom lines.
As more post-pandemic recovery data becomes available amidst vaccine rollouts, we’ll gain a better sense of whether we’re still on track to follow these long-term trends.


Markets
The European Stock Market: Attractive Valuations Offer Opportunities
On average, the European stock market has valuations that are nearly 50% lower than U.S. valuations. But how can you access the market?


European Stock Market: Attractive Valuations Offer Opportunities
Europe is known for some established brands, from L’Oréal to Louis Vuitton. However, the European stock market offers additional opportunities that may be lesser known.
The above infographic, sponsored by STOXX, outlines why investors may want to consider European stocks.
Attractive Valuations
Compared to most North American and Asian markets, European stocks offer lower or comparable valuations.
| Index | Price-to-Earnings Ratio | Price-to-Book Ratio |
|---|---|---|
| EURO STOXX 50 | 14.9 | 2.2 |
| STOXX Europe 600 | 14.4 | 2 |
| U.S. | 25.9 | 4.7 |
| Canada | 16.1 | 1.8 |
| Japan | 15.4 | 1.6 |
| Asia Pacific ex. China | 17.1 | 1.8 |
Data as of February 29, 2024. See graphic for full index names. Ratios based on trailing 12 month financials. The price to earnings ratio excludes companies with negative earnings.
On average, European valuations are nearly 50% lower than U.S. valuations, potentially offering an affordable entry point for investors.
Research also shows that lower price ratios have historically led to higher long-term returns.
Market Movements Not Closely Connected
Over the last decade, the European stock market had low-to-moderate correlation with North American and Asian equities.
The below chart shows correlations from February 2014 to February 2024. A value closer to zero indicates low correlation, while a value of one would indicate that two regions are moving in perfect unison.
| EURO STOXX 50 | STOXX EUROPE 600 | U.S. | Canada | Japan | Asia Pacific ex. China |
|
|---|---|---|---|---|---|---|
| EURO STOXX 50 | 1.00 | 0.97 | 0.55 | 0.67 | 0.24 | 0.43 |
| STOXX EUROPE 600 | 1.00 | 0.56 | 0.71 | 0.28 | 0.48 | |
| U.S. | 1.00 | 0.73 | 0.12 | 0.25 | ||
| Canada | 1.00 | 0.22 | 0.40 | |||
| Japan | 1.00 | 0.88 | ||||
| Asia Pacific ex. China | 1.00 |
Data is based on daily USD returns.
European equities had relatively independent market movements from North American and Asian markets. One contributing factor could be the differing sector weights in each market. For instance, technology makes up a quarter of the U.S. market, but health care and industrials dominate the broader European market.
Ultimately, European equities can enhance portfolio diversification and have the potential to mitigate risk for investors.
Tracking the Market
For investors interested in European equities, STOXX offers a variety of flagship indices:
| Index | Description | Market Cap |
|---|---|---|
| STOXX Europe 600 | Pan-regional, broad market | €10.5T |
| STOXX Developed Europe | Pan-regional, broad-market | €9.9T |
| STOXX Europe 600 ESG-X | Pan-regional, broad market, sustainability focus | €9.7T |
| STOXX Europe 50 | Pan-regional, blue-chip | €5.1T |
| EURO STOXX 50 | Eurozone, blue-chip | €3.5T |
Data is as of February 29, 2024. Market cap is free float, which represents the shares that are readily available for public trading on stock exchanges.
The EURO STOXX 50 tracks the Eurozone’s biggest and most traded companies. It also underlies one of the world’s largest ranges of ETFs and mutual funds. As of November 2023, there were €27.3 billion in ETFs and €23.5B in mutual fund assets under management tracking the index.
“For the past 25 years, the EURO STOXX 50 has served as an accurate, reliable and tradable representation of the Eurozone equity market.”
— Axel Lomholt, General Manager at STOXX
Partnering with STOXX to Track the European Stock Market
Are you interested in European equities? STOXX can be a valuable partner:
- Comprehensive, liquid and investable ecosystem
- European heritage, global reach
- Highly sophisticated customization capabilities
- Open architecture approach to using data
- Close partnerships with clients
- Part of ISS STOXX and Deutsche Börse Group
With a full suite of indices, STOXX can help you benchmark against the European stock market.
Learn how STOXX’s European indices offer liquid and effective market access.

-

 Economy2 days ago
Economic Growth Forecasts for G7 and BRICS Countries in 2024
The IMF has released its economic growth forecasts for 2024. How do the G7 and BRICS countries compare?
-

 Markets2 weeks ago
U.S. Debt Interest Payments Reach $1 Trillion
U.S. debt interest payments have surged past the $1 trillion dollar mark, amid high interest rates and an ever-expanding debt burden.
-

 United States2 weeks ago
Ranked: The Largest U.S. Corporations by Number of Employees
We visualized the top U.S. companies by employees, revealing the massive scale of retailers like Walmart, Target, and Home Depot.
-

 Markets2 weeks ago
The Top 10 States by Real GDP Growth in 2023
This graphic shows the states with the highest real GDP growth rate in 2023, largely propelled by the oil and gas boom.
-

 Markets2 weeks ago
Ranked: The World’s Top Flight Routes, by Revenue
In this graphic, we show the highest earning flight routes globally as air travel continued to rebound in 2023.
-

 Markets3 weeks ago
Ranked: The Most Valuable Housing Markets in America
The U.S. residential real estate market is worth a staggering $47.5 trillion. Here are the most valuable housing markets in the country.


-

 Debt1 week ago
How Debt-to-GDP Ratios Have Changed Since 2000
-
Markets2 weeks ago
Ranked: The World’s Top Flight Routes, by Revenue
-

 Countries2 weeks ago
Population Projections: The World’s 6 Largest Countries in 2075
-
Markets2 weeks ago
The Top 10 States by Real GDP Growth in 2023
-

 Demographics2 weeks ago
The Smallest Gender Wage Gaps in OECD Countries
-

 United States2 weeks ago
Where U.S. Inflation Hit the Hardest in March 2024
-

 Green2 weeks ago
Top Countries By Forest Growth Since 2001
-
United States2 weeks ago
Ranked: The Largest U.S. Corporations by Number of Employees