Datastream
The Rising Demand for Nature-based Climate Solutions
The following content is sponsored by Carbon Streaming Corporation.
The Briefing
- Nature-based climate solutions include conservation, restoration, and land management projects that avoid, reduce or sequester greenhouse gas emissions.
- Carbon credits from nature-based projects accounted for over 66% of transaction value in the voluntary carbon markets in 2021.
The Rising Demand for Nature-based Climate Solutions
The world’s forests are important carbon sinks that absorb a net 7.6 billion tonnes of carbon dioxide equivalent (CO2e) annually.
Therefore, regrowing, preserving, and managing forests and other natural carbon sinks is crucial to achieving net-zero emissions by 2050, and nature-based climate solutions are one way to do so.
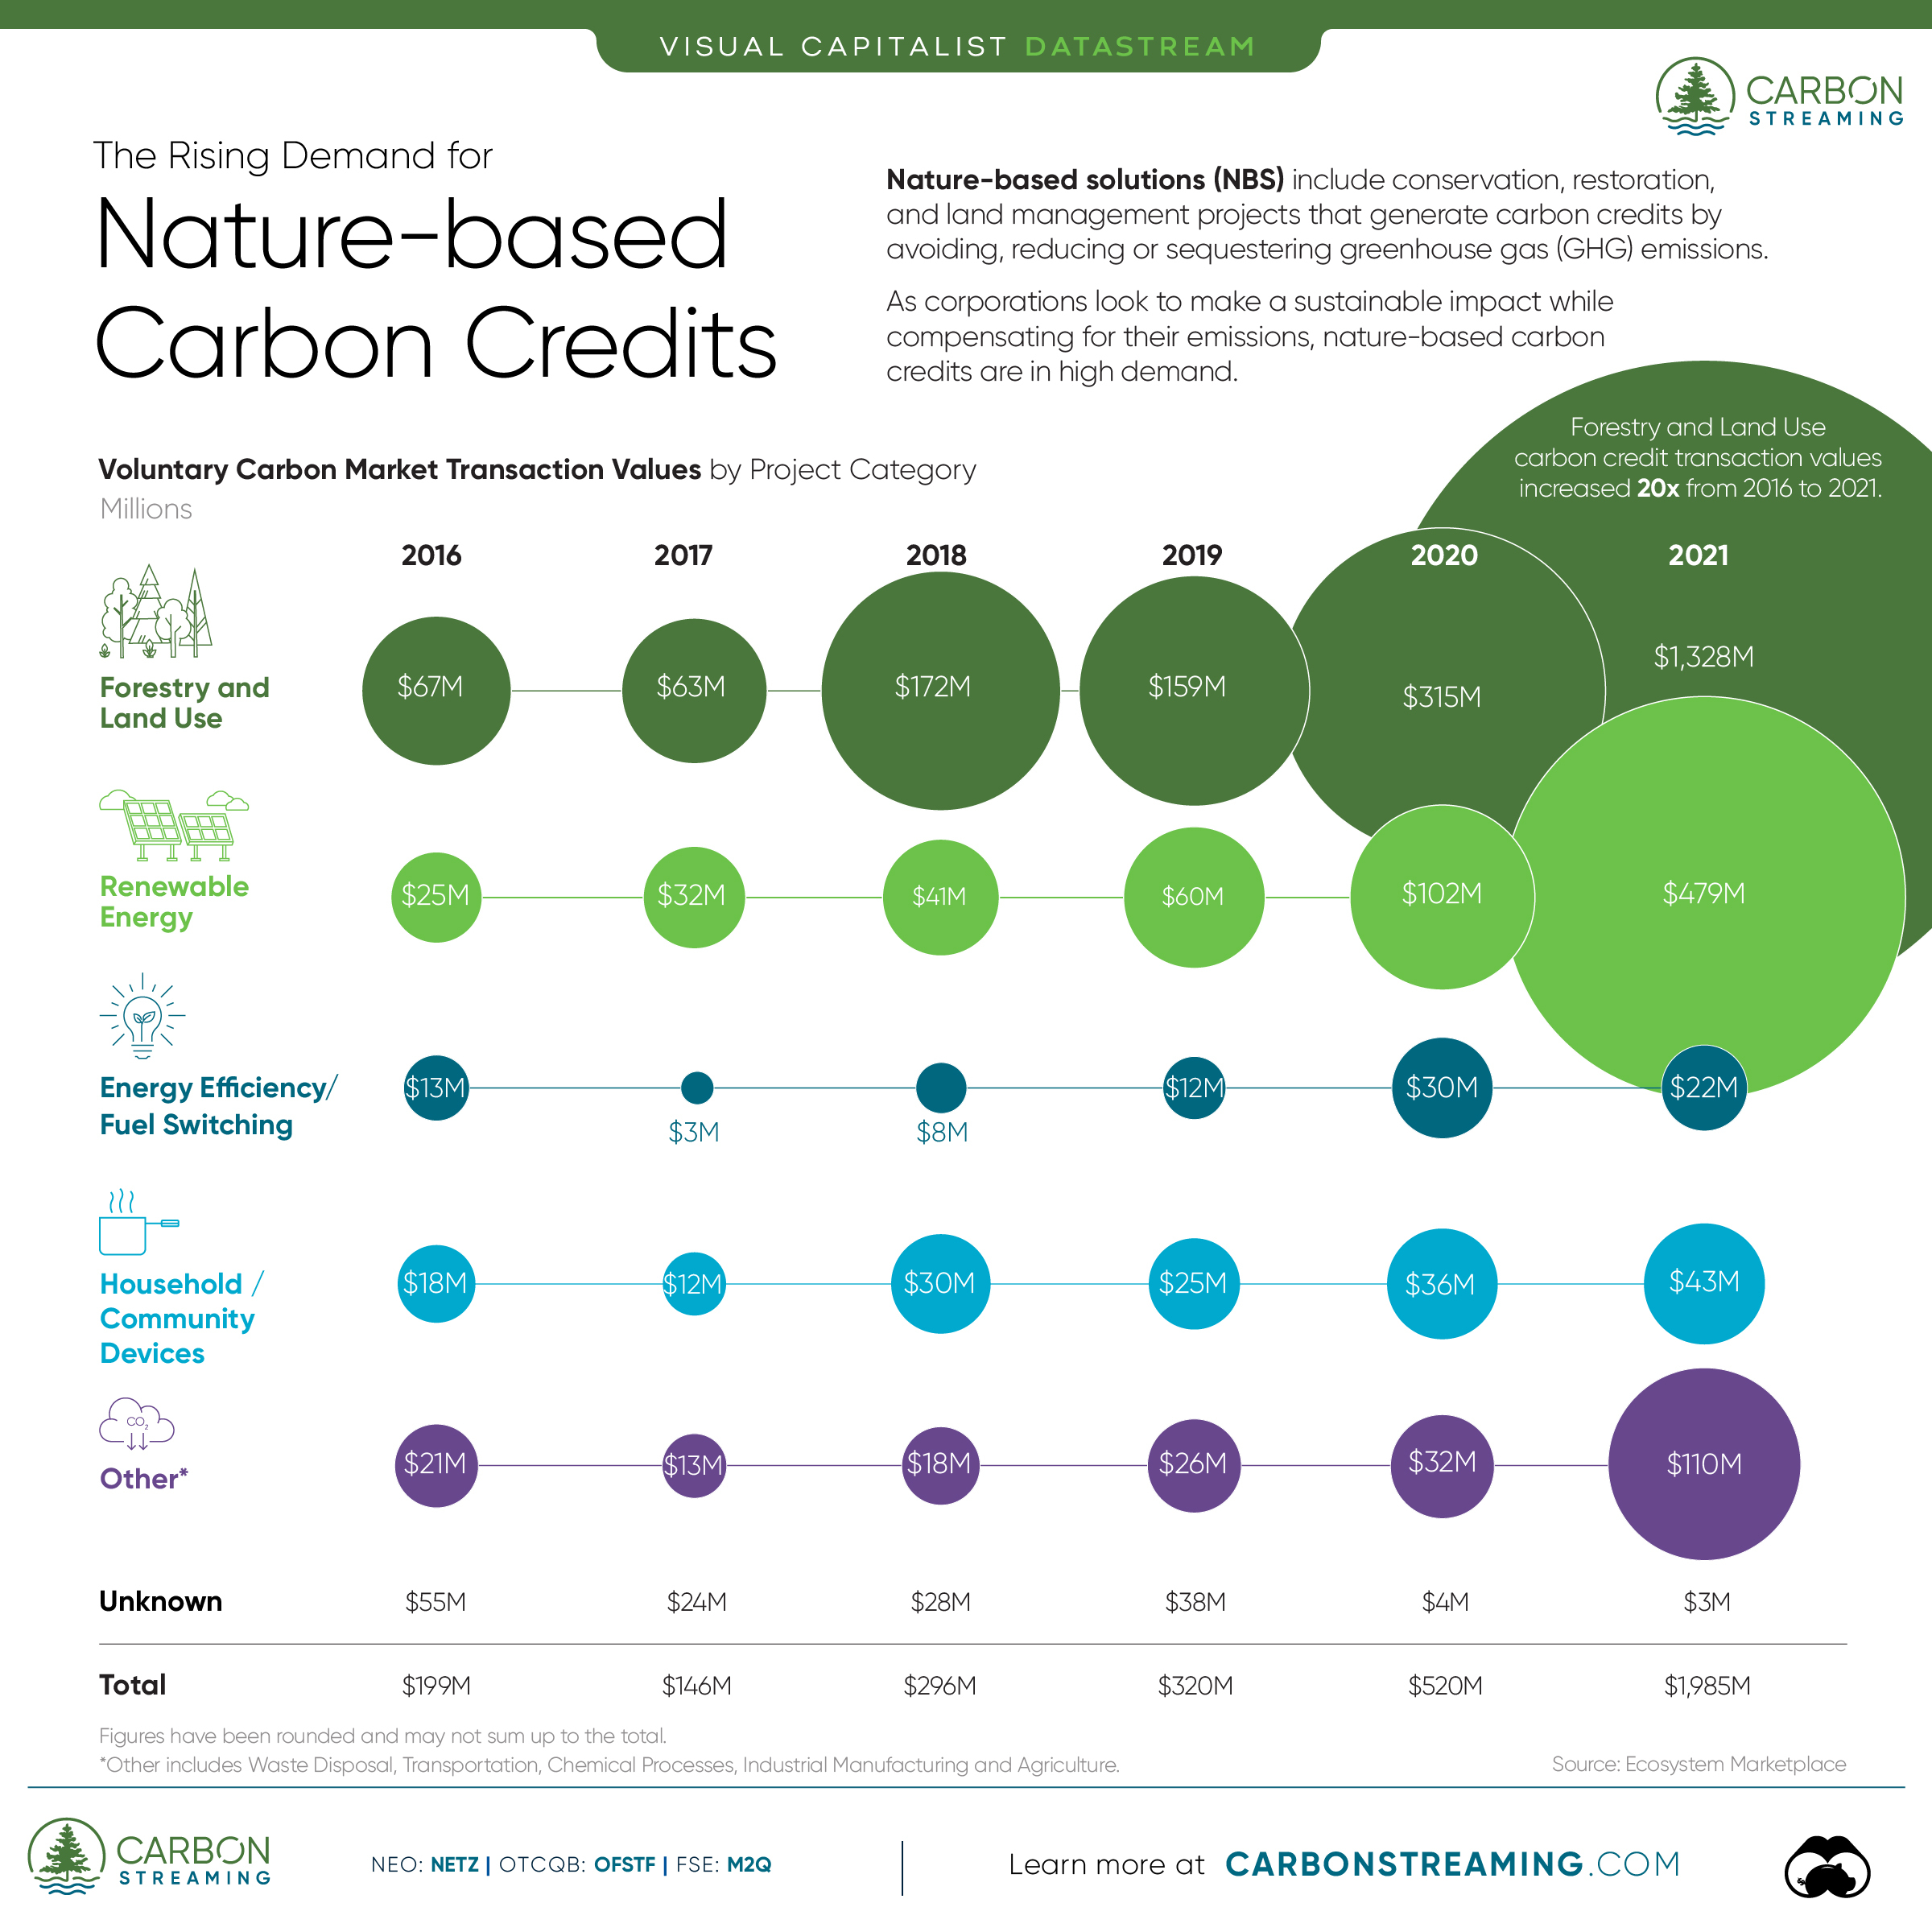
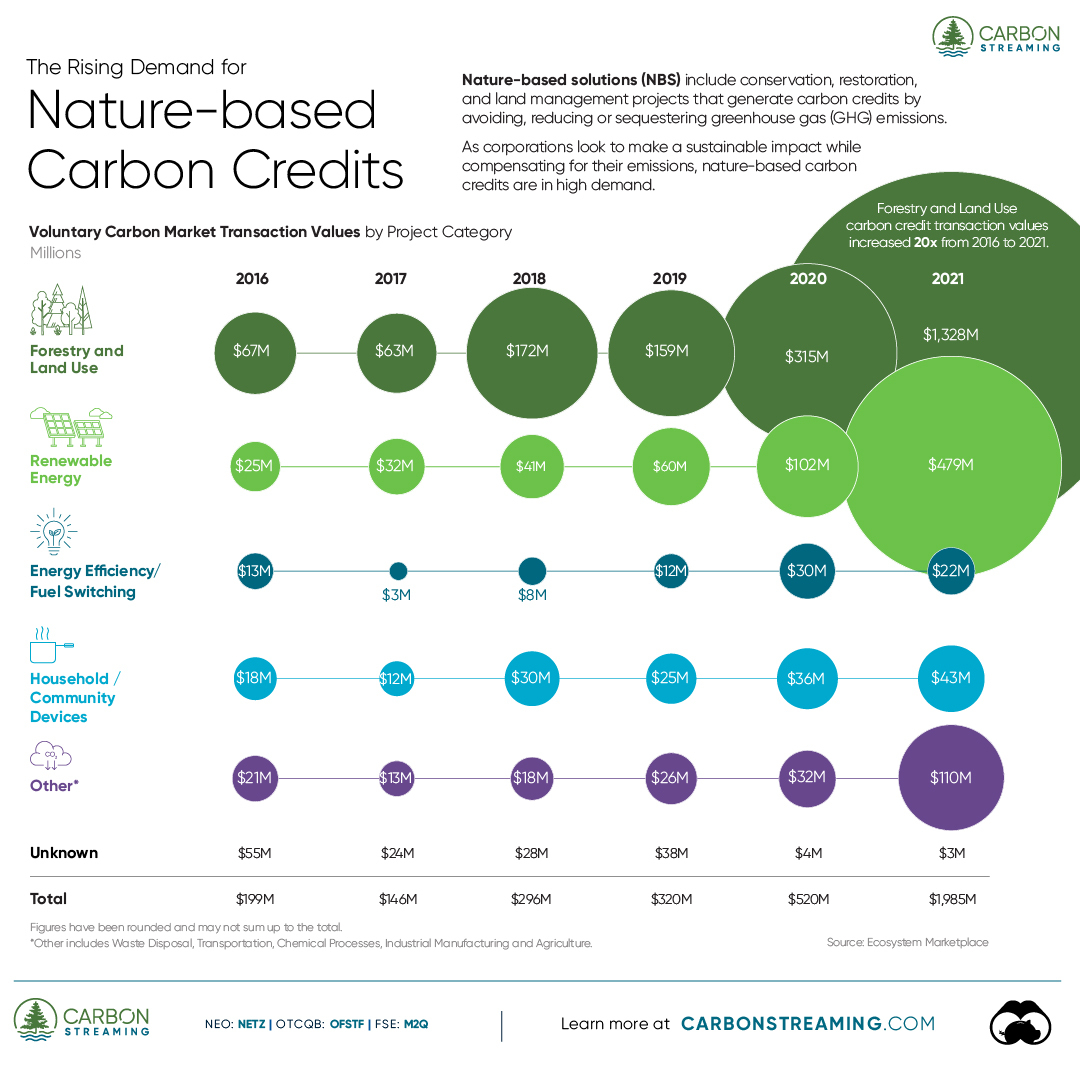
Nature-based solutions refer to conservation, restoration, and land management projects that generate carbon credits by avoiding, reducing or sequestering greenhouse gas (GHG) emissions. With more organizations committing to climate targets, carbon credits from these projects have been in high demand.
The above graphic sponsored by Carbon Streaming Corporation looks at the growing demand for carbon credits generated by nature-based projects using data from Ecosystem Marketplace.
The Growth of Nature-based Carbon Credits
With the race to net-zero ramping up, carbon markets have been growing as a whole.
In fact, the value of total transactions in the voluntary carbon markets in 2021 reached nearly $2 billion—more than tripling since 2020. Forestry and Land Use carbon credit projects led the growth, accounting for over 66% or over $1.3 billion worth of transactions in 2021.
Here’s a full breakdown of transaction values by project category:
| Transaction Year | Forestry and Land Use | Renewable Energy | Energy Efficiency / Fuel Switching | Household / Community Devices | Other and Unknown | Total |
|---|---|---|---|---|---|---|
| 2016 | $67M | $25M | $13M | $18M | $76M | $199M |
| 2017 | $63M | $32M | $3M | $12M | $37M | $146M |
| 2018 | $172M | $41M | $8M | $30M | $46M | $296M |
| 2019 | $159M | $60M | $12M | $25M | $64M | $320M |
| 2020 | $315M | $102M | $30M | $36M | $36M | $520M |
| 2021 | $1,328M | $479M | $22M | $43M | $113M | $1,985M |
Figures have been rounded and may not sum up to the total.
Forestry and Land Use projects manage forests, soil, grasslands, and other land types to avoid or reduce carbon emissions or increase carbon sequestration. These projects generate one carbon credit for every tonne of CO2 equivalent GHGs that they remove or avoid from entering the atmosphere.
At the same time, they may offer co-benefits that can advance the UN Sustainable Development Goals through improvements in biodiversity, soil health, air and water quality, and the livelihoods of local communities.
Therefore, Forestry and Land Use projects have a significant role to play in reaching net zero. In fact, according to research published in the scientific journal Nature, letting forests regrow naturally has the potential to absorb up to 8.9 billion tonnes of CO2 annually through 2050, while still maintaining native grasslands and current food production levels.
Nature’s Role in Reaching Net Zero
For organizations looking to achieve their sustainability goals, nature-based solutions offer an opportunity to preserve and restore critical carbon sinks while supporting biodiversity and local communities. As a result, these types of carbon credits often trade at a premium, and their demand is skyrocketing, especially with more corporations committing to sustainability.
Carbon Streaming aims to accelerate a net-zero future. It pioneered the use of streaming transactions, a proven and flexible funding model, to scale high-integrity carbon credit projects to accelerate global climate action and advance the United Nations Sustainable Development Goals. It focuses on projects that have a positive impact on the environment, local communities, and biodiversity, in addition to their carbon reduction or removal potential.
>>>Interested in learning more about Carbon Streaming? Click here to learn more.
Where does this data come from?
Source: Ecosystem Marketplace


Datastream
Can You Calculate Your Daily Carbon Footprint?
Discover how the average person’s carbon footprint impacts the environment and learn how carbon credits can offset your carbon footprint.


The Briefing
- A person’s carbon footprint is substantial, with activities such as food consumption creating as much as 4,500 g of CO₂ emissions daily.
- By purchasing carbon credits from Carbon Streaming Corporation, you can offset your own emissions and fund positive climate action.
Your Everyday Carbon Footprint
While many large businesses and countries have committed to net-zero goals, it is essential to acknowledge that your everyday activities also contribute to global emissions.
In this graphic, sponsored by Carbon Streaming Corporation, we will explore how the choices we make and the products we use have a profound impact on our carbon footprint.
Carbon Emissions by Activity
Here are some of the daily activities and products of the average person and their carbon footprint, according to Clever Carbon.
| Household Activities & Products | CO2 Emissions (g) |
|---|---|
| 💡 Standard Light Bulb (100 watts, four hours) | 172 g |
| 📱 Mobile Phone Use (195 minutes per day)* | 189 g |
| 👕 Washing Machine (0.63 kWh) | 275 g |
| 🔥 Electric Oven (1.56 kWh) | 675 g |
| ♨️ Tumble Dryer (2.5 kWh) | 1,000 g |
| 🧻 Toilet Roll (2 ply) | 1,300 g |
| 🚿 Hot Shower (10 mins) | 2,000 g |
| 🚙 Daily Commute (one hour, by car) | 3,360 g |
| 🍽️ Average Daily Food Consumption (three meals of 600 calories) | 4,500 g |
| *Phone use based on yearly use of 69kg per the source, Reboxed | |
Your choice of transportation plays a crucial role in determining your carbon footprint. For instance, a 15 km daily commute to work on public transport generates an average of 1,464 g of CO₂ emissions. Compared to 3,360 g—twice the volume for a journey the same length by car.
By opting for more sustainable modes of transport, such as cycling, walking, or public transportation, you can significantly reduce your carbon footprint.
Addressing Your Carbon Footprint
One way to compensate for your emissions is by purchasing high-quality carbon credits.
Carbon credits are used to help fund projects that avoid, reduce or remove CO₂ emissions. This includes nature-based solutions such as reforestation and improved forest management, or technology-based solutions such as the production of biochar and carbon capture and storage (CCS).
While carbon credits offer a potential solution for individuals to help reduce global emissions, public awareness remains a significant challenge. A BCG-Patch survey revealed that only 34% of U.S. consumers are familiar with carbon credits, and only 3% have purchased them in the past.
About Carbon Streaming
By financing the creation or expansion of carbon projects, Carbon Streaming Corporation secures the rights to future carbon credits generated by these sustainable projects. You can then purchase these carbon credits to help fund climate solutions around the world and compensate for your own emissions.
Ready to get involved?
>> Learn more about purchasing carbon credits at Carbon Streaming

-

 Science1 week ago
Visualizing the Average Lifespans of Mammals
-

 Demographics2 weeks ago
The Smallest Gender Wage Gaps in OECD Countries
-

 United States2 weeks ago
Where U.S. Inflation Hit the Hardest in March 2024
-

 Green2 weeks ago
Top Countries By Forest Growth Since 2001
-

 United States2 weeks ago
Ranked: The Largest U.S. Corporations by Number of Employees
-

 Maps2 weeks ago
The Largest Earthquakes in the New York Area (1970-2024)
-

 Green2 weeks ago
Ranked: The Countries With the Most Air Pollution in 2023
-

 Green2 weeks ago
Ranking the Top 15 Countries by Carbon Tax Revenue