Sponsored
Visualizing Carbon Storage in Earth’s Ecosystems
The following content is sponsored by the Carbon Streaming Corporation.

Visualizing Carbon Storage in Earth’s Ecosystems
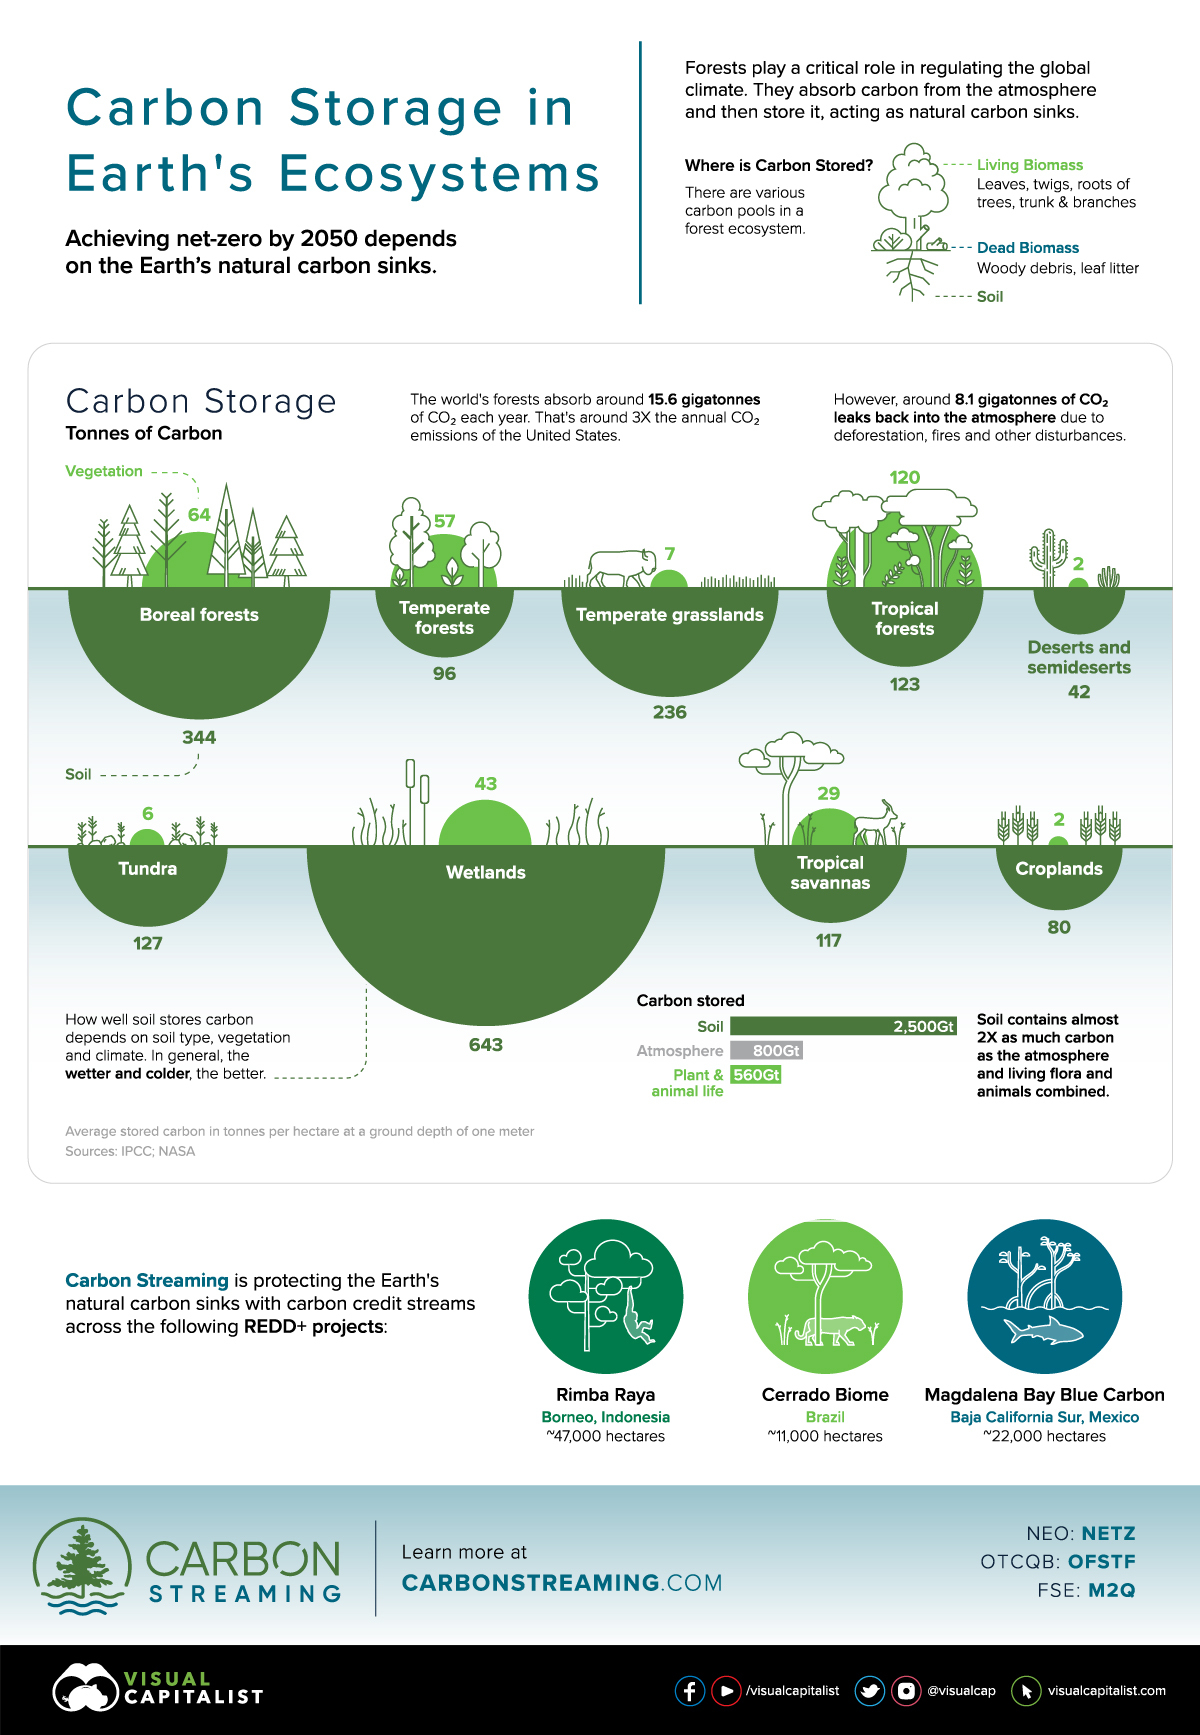
Each year, the world’s forests absorb roughly 15.6 billion tonnes of carbon dioxide (CO2).
To put it in perspective, that’s around three times the annual CO2 emissions of the U.S. or about 40% of global CO2 emissions. For this reason, forests serve as a vital tool in regulating the global temperature and achieving net-zero emissions by 2050.
In this graphic sponsored by Carbon Streaming Corporation, we look at the Earth’s natural carbon sinks, and break down their carbon storage.
Carbon Storage by Ecosystem
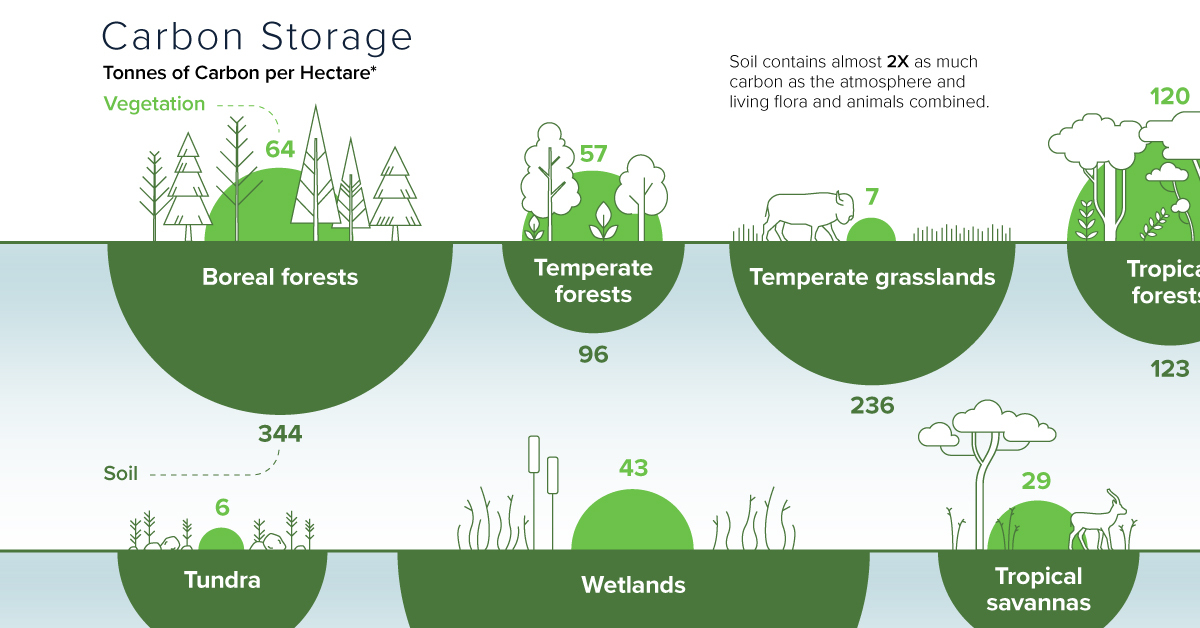
Forests contain several carbon sinks, from living biomass such as roots and leaves to soil. In fact, soil contains nearly twice as much carbon than the atmosphere, plant, and animal life combined.
- Soil: 2,500 gigatonnes (Gt)
- Atmosphere: 800 Gt
- Plant & animal life: 560 Gt
The soil type, vegetation, and climate all affect how carbon is stored. For example, colder and wetter climates promote the most effective carbon storage in soil.
Global Carbon Storage* (Tonnes of carbon per hectare) | Vegetation | Soil |
---|---|---|
Wetlands | 43 | 643 |
Boreal forests | 64 | 344 |
Temperate grasslands | 7 | 236 |
Tundra | 6 | 127 |
Tropical forests | 120 | 123 |
Tropical savannas | 29 | 117 |
Temperate forests | 57 | 96 |
Croplands | 2 | 80 |
Deserts and semideserts | 2 | 42 |
*Average stored carbon in tonnes per hectare at a ground depth of one meter
Source: IPCC
Wetlands are substantial reservoirs of carbon. Despite occupying only 5-8% of the Earth’s land surface, they hold between 20 to 30% of all estimated organic soil carbon.
Risks to Natural Carbon Sinks
Around 8.1 billion tonnes of CO2 leaks back into the atmosphere each year.
Over the last 20 years, the world has lost about 10% of its tree cover, or 411 million hectares (Mha). The main causes behind this are forestry (119 Mha), commodity-driven deforestation (103 Mha), and wildfires (89 Mha). What’s more, research suggests that Amazon rainforests emit more carbon than they absorb due to record levels of fires, many of which are deliberately set to clear for commodity production.
With the increasing frequency of wildfires and deforestation, the world’s forests are at risk of releasing carbon. Protecting and preserving these biomes is critical to the Earth’s carbon balance and mitigating climate change.
Carbon Credits Provide a Solution
Given the risk of losing critical carbon sinks, carbon credits play an important role in preserving these ecosystems.
Carbon credits can help finance projects that reduce or remove GHG emissions from the atmosphere. From improved forest management to reforestation, there are a number of different types of carbon projects across wetlands, grasslands, and various forests:
- Reforestation and Afforestation
- Avoided Deforestation
- Natural forest management
- Wetland restoration
For instance, a carbon credit project may preserve endangered tropical lowland peat swamp forests spanning thousands of hectares, such as the Rimba Raya Biodiversity Reserve Project in Indonesia, one of the projects that Carbon Streaming has a carbon credit stream.
Through this project, forests are prevented from being converted into palm oil plantations to reduce and avoid 130 million tonnes of GHG emissions during the 30 years of the project.
Another example would be the Cerrado Biome Project in Brazil, another carbon offset project where Carbon Streaming has a stream agreement. This project is protecting and preserving native forests and grasslands from being converted to commercial agriculture.
Importantly, these projects would not be economically viable without the sale of carbon credits.
Protecting Stored Carbon
To prevent further loss of stored carbon, government policies, NGO-led initiatives, and the financing of carbon offset projects are gaining momentum. Taken together, they offer the critical intervention needed to preserve the earth’s carbon vaults.
Support the Future of Data Storytelling
Sorry to interrupt your reading, but we have a favor to ask. At Visual Capitalist we believe in a world where data can be understood by everyone. That’s why we want to build the VC App - the first app of its kind combining verifiable and transparent data with beautiful, memorable visuals. All available for free.
As a small, independent media company we don’t have the expertise in-house or the funds to build an app like this. So we’re asking our community to help us raise funds on Kickstarter.
If you believe in data-driven storytelling, join the movement and back us on Kickstarter!
Thank you.

Sponsored
Operational Health Tech: A New Billion Dollar Market
Operational health tech is poised to be a multi-billion dollar industry. This graphic breaks down how its disrupting healthcare as we know it.

Operational Health Tech: A New Billion Dollar Market
Many lessons were learned throughout the COVID-19 pandemic, but what has become most apparent is the need to invest in healthcare on all fronts. In fact in just a few short years, businesses, governments, and consumers have had to entirely reassess healthcare in ways not quite seen before.
What’s more, this elevated importance placed on health could be here to stay, and one area in particular is poised for significant growth: operational health tech.
The graphic above from our sponsor Bloom Health Partners dives into the burgeoning market that is operational health tech, and reveals the key driving forces behind it.
What is Operational Health?
To start, operational health is an industry that provides health services to employees to help keep companies running smoothly.
A critical piece of operational health is workplace health, which is expected to soar in value. From 2021 to 2025, the market for workplace health is expected to grow 200% from $6.5 billion to $19.5 billion.
The industry is undergoing a tremendous amount of innovation, specifically in relation to technological advances.
Operational Health Tech: Disrupting Healthcare
The operational health tech industry is disrupting traditional healthcare by providing direct services to employees in the workplace.
For decades now, the U.S. has increasingly become a statistical outlier for healthcare spending relative to health outcomes. For instance, the average American incurs $9,000 in healthcare spending per year, nearly twice that of OECD countries, yet life expectancy is flatlining while other countries see rises.
A worsening and increasingly expensive health dynamic makes the environment ripe for disruption and is allowing for new ideas to be brought to the table.
In addition, people are already responding to these inefficient practices by shifting greater emphasis on health within the job market. For example, studies show that workers care more about healthcare benefits over the salaries when choosing an employer.
Going forward, employees will gravitate towards employers that provide standout health benefits like workplace healthcare options offered by operational health. Here are some additional factors that act as catalysts for this space.
1. Healthcare as Smart Business
What do companies that rank as some of the best to work for have in common? First, they all tend to outperform relative to the S&P 500 on a cumulative stock performance basis. Second, many offer superior healthcare benefits.
Moreover, from 2012 to 2022, companies that were the best to work for saw shares appreciate nearly 500%, compared to around 300% for the broader market. Data like this suggests investing in healthcare and keeping employees happy is smart business that pays dividends.
2. Healthcare as a Differentiator
Since 2020, labor markets have changed dramatically. As a result, employees now have more options and are much more selective about where they work. This is evident from the difference between job openings and hires which has risen to unrecognizable levels. For example, the data shows that there are nearly 12 million job openings, but only around 6-7 million hires in 2022.
Altogether, with an oversupply of jobs relative to workers, employers will have to find new ways to differentiate. One way to stand out is through healthcare and initiatives around operational health tech.
3. The Looming Mental Health Epidemic
Today some 700 million people suffer from some form of a mental health condition and COVID-19 has continued to exacerbate the problem.
Moreover, the cost of mental health for the global economy is estimated to be a whopping $6 trillion by 2030, over double compared to the $2.5 trillion figure in 2010.
Under the umbrella of services operational health tech covers, mental health will stand to benefit. Especially in the years to come as we look for new ways to combat its mounting costs.
Investing in Operational Health Tech
Bloom Health Partners is an operational health tech company looking to revolutionize workplace health by supplying employers with data to better understand their employee base and business.
One way Bloom stands out is with Bloom Shield—its flagship cloud-based big data platform for employee health data management. With Bloom Shield, new health insights become available to make better decisions. Employers can get insight into demographic data and age trends within the workplace, pre-screening detection for cancer and diabetes, and testing for management to tackle the spread of disease.
Click here to learn more about investing in operational health tech with Bloom Health Partners.
Sponsored
How Environmental Markets Advance Net Zero
The global price of carbon increased 91% in 2021. Below, we show how environmental markets are supporting a greener future.

How Environmental Markets Advance Net Zero
In 2021, roughly 20% of global carbon emissions were covered by carbon pricing mechanisms.
Meanwhile, the global price of carbon increased 91%, bolstered by government, corporate, and investor demand. This puts traditional fuel sources at a disadvantage, instead building the investment case for renewables.
This infographic from ICE, the first in a three part series on the ESG toolkit, explores how environmental markets work and their role in the fight against climate change.
What are Environmental Markets?
First, meeting a goal of net zero carbon emissions involves limiting the use of the world’s finite carbon budget to meet a 1.5°C pathway.
Achieving net zero requires us to:
- Change how we utilize energy and transition to less carbon-intensive fuels
- Put a value on the conservation of nature or “natural capital” and carbon sinks, which accumulate and store carbon
Environmental markets facilitate the pathway to net zero by valuing externalities, such as placing a cost on pollution and placing a price on carbon storage. This helps balance the carbon cycle to manage the carbon budget in the most cost-effective manner.
What Is the Carbon Budget?
To keep temperatures 1.5°C above pre-industrial levels, we have just 420 gigatonnes (Gt) of CO₂ remaining in the global carbon budget. At current rates, this remaining carbon budget is projected to be consumed by 2030 if no reductions are made.
Carbon Budget | 1.5°C | 1.7°C | 2.0°C |
---|---|---|---|
Remaining GtCO₂ | 420 | 770 | 1270 |
Consumed GtCO₂ | 2475 | 2475 | 2475 |
Each scenario based on a 50% chance of success
Source: IPCC AR6 WG; Friedlingstein et al 2021; Global Carbon Budget 2021
Across three different scenarios, the above table indicates the amount of carbon emissions humanity can emit to prevent the worst effects of climate change.
What are Negative and Positive Externalities?
Second, when companies compensate for CO₂ emissions, they can fall across two categories: negative and positive externalities.
- Negative externalities include pollution. Carbon cap and trade programs, using carbon allowances, put a cost on pollution.
- Positive externalities include renewables, such as wind and solar power that generate carbon-free electricity. The value of renewable energy can be expressed with a renewable energy certificate.
Natural capital is another example of a positive externality, which involves the capturing and storing of carbon. The value of this type of natural capital can be expressed using a carbon credit.
Environmental Markets and the Energy Transition
Next, environmental markets can drive the transition to cleaner energy sources by ascribing a cost to pollution and putting a premium on renewables, to change how we use energy.
As one example, in 2013 the UK government introduced the Carbon Price Support mechanism to complement the emissions cap and trade program and weaken the investment case for coal. Between 2013 and 2020, Britain’s overall CO₂ emissions fell by 31%.
Here’s how coal was phased out of the UK’s energy mix, while renewable energy sources such as wind, solar, and bioenergy played a greater role.
Date | Coal | Gas | Wind and Solar | Bioenergy |
---|---|---|---|---|
Q1 2000 | 31 TWh | 40 TWh | 0 TWh | 1 TWh |
Q1 2005 | 41 TWh | 36 TWh | 1 TWh | 2 TWh |
Q1 2010 | 31 TWh | 47 TWh | 2 TWh | 3 TWh |
Q1 2015 | 28 TWh | 23 TWh | 13 TWh | 6 TWh |
Q1 2020 | 3 TWh | 27 TWh | 28 TWh | 9 TWh |
Source: Digest of UK Energy Statistics (DUKES); BP; EMBER via Our World in Data (2021)
Today, less than 5% of the UK’s electricity is coal-generated, with remaining plants expected to be decommissioned by 2024.
How Environmental Markets are Advancing Net Zero
Finally, as governments increase their commitments to net zero, carbon prices are rising towards a level that requires industries to decarbonize and meet those goals.
In fact, between 2014 and 2021, the global price of carbon has increased over sixfold.
Date | Global Carbon Price (Year End) | Annual % Change |
---|---|---|
2021 | $47.78 | 91% |
2020 | $24.96 | 37% |
2019 | $18.16 | -7% |
2018 | $19.56 | 102% |
2017 | $9.67 | 29% |
2016 | $7.52 | -24% |
2015 | $9.88 | 7% |
2014 | $9.24 | 32% |
As indicated by the ICECRBN Global Carbon Price (CPW Weighted)
Source: ICE (Apr 2022)
As companies begin to treat their carbon footprints as liabilities, there will be increasing demand for environmental attributes, such as carbon allowances and carbon credits.
Managing Risk and Opportunity
Quoted markets like ICE Futures Exchanges and NYSE allow stakeholders to precisely value positive and negative externalities to:
- Manage emissions cost effectively
- Hedge climate transition risk
- Allocate capital to facilitate the energy transition and build carbon sinks
- Create an asset class for Natural Capital
- Invest in assets to meet climate obligations
Everyone is exposed to climate risk which means it needs to be measured and managed.
That’s why balancing the carbon cycle will be critical to managing the world’s carbon budget. Markets are providing greater access, liquidity and opportunity in supporting net zero ambitions.
In part two of the series sponsored by ICE, we’ll look at four motivations for using ESG data.
-
Money1 week ago
Mapping the Migration of the World’s Millionaires
-
Markets2 weeks ago
Visualizing the Coming Shift in Global Economic Power (2006-2036p)
-
Datastream3 weeks ago
Ranked: These Are 10 of the World’s Least Affordable Housing Markets
-
Demographics1 week ago
Mapped: A Decade of Population Growth and Decline in U.S. Counties
-
Misc2 weeks ago
Visualizing Well-Known Airlines by Fleet Composition
-
Politics4 weeks ago
Which Countries Trust Their Government, and Which Ones Don’t?
-
Markets4 weeks ago
Ranked: Visualizing the Largest Trading Partners of the U.S.
-
Misc7 days ago
Iconic Infographic Map Compares the World’s Mountains and Rivers