Datastream
Visualizing the Forest Funding Gap Relative to Emissions
The following content is sponsored by The LEAF Coalition
The Briefing
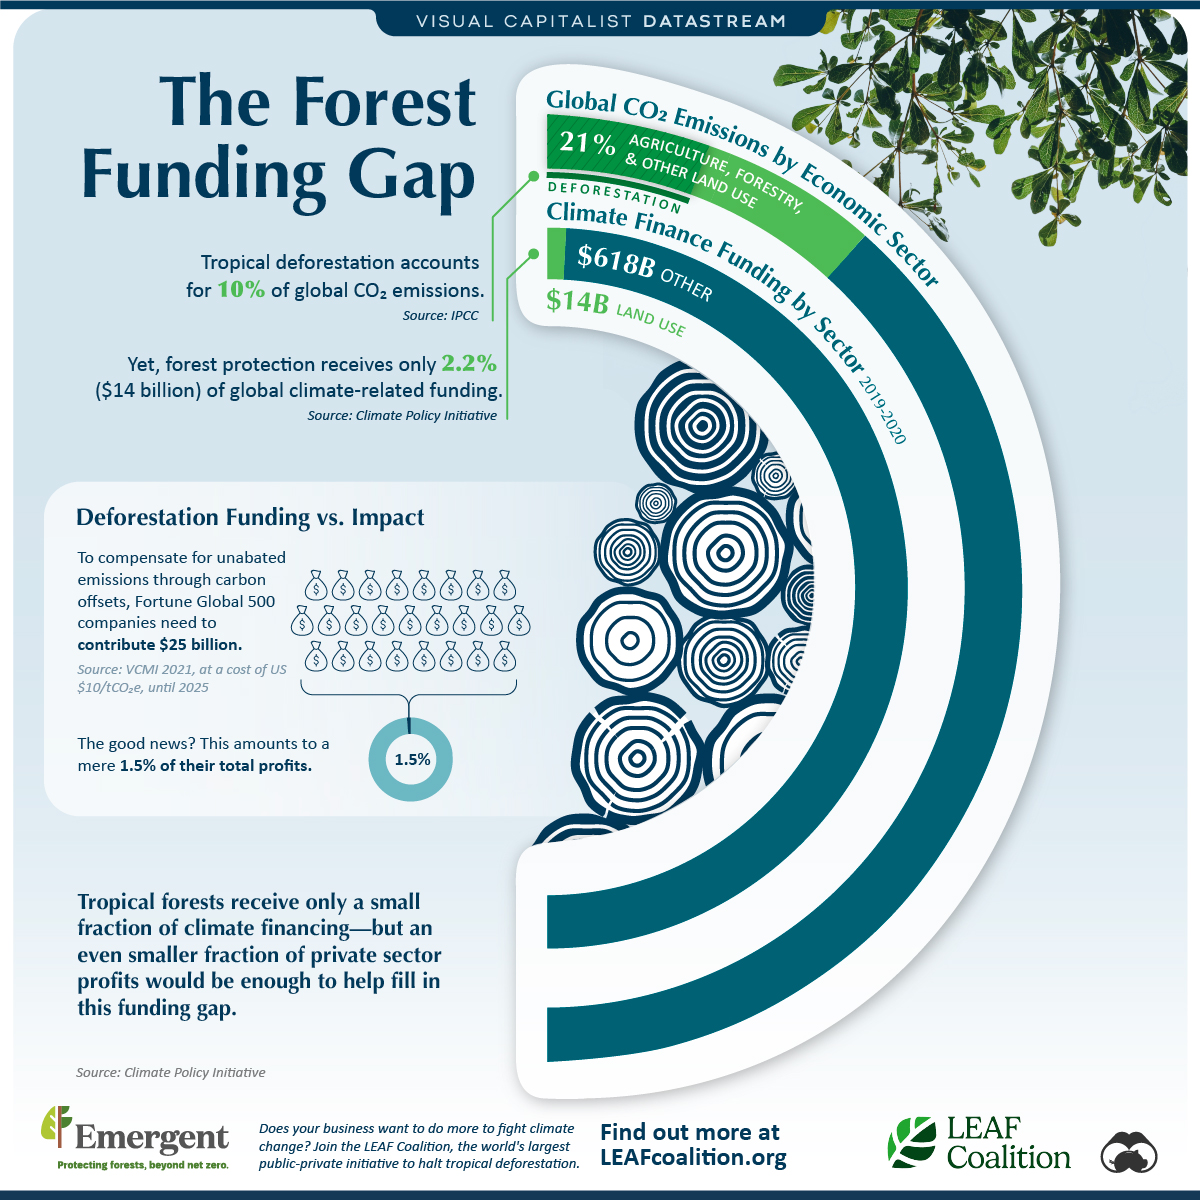
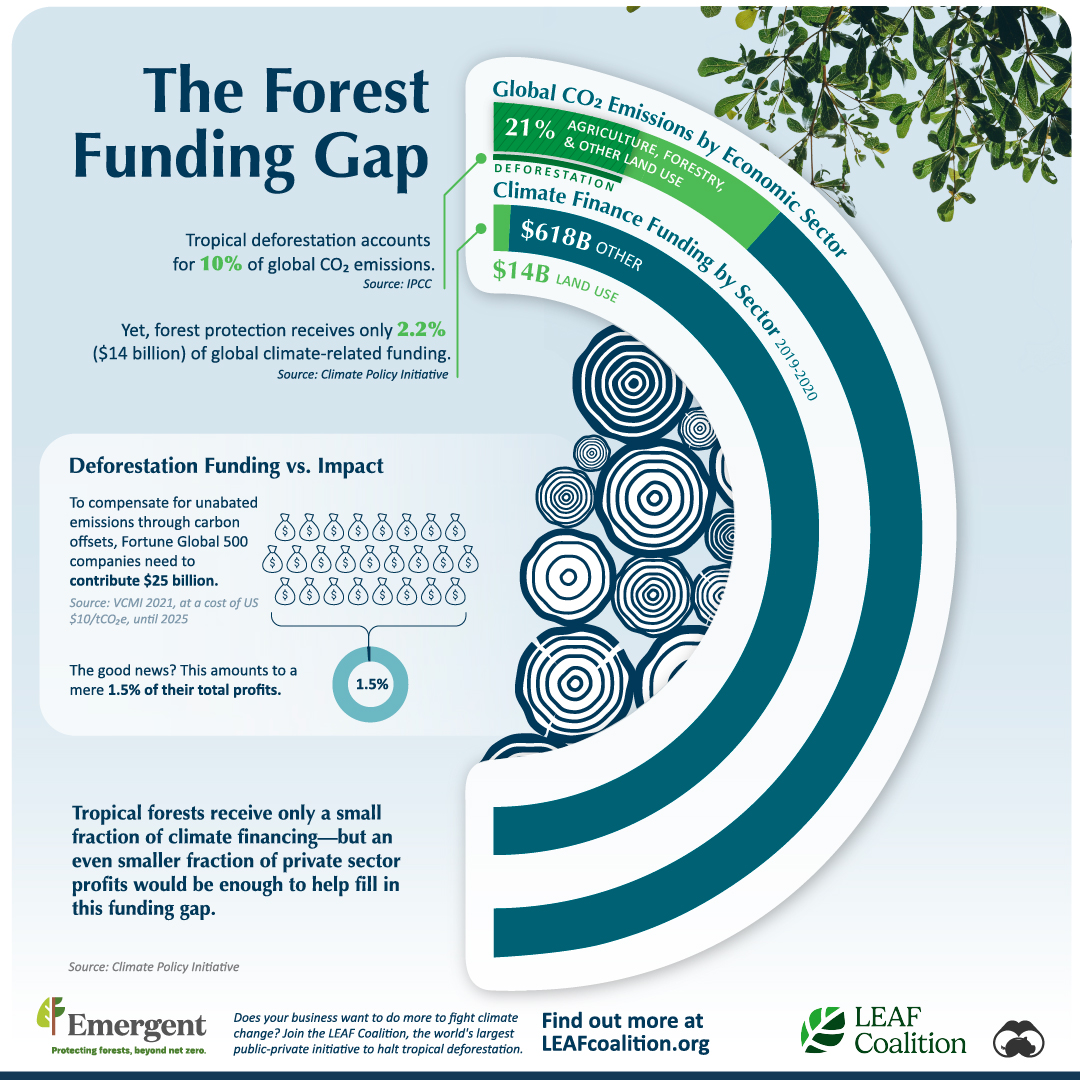
- Deforestation accounts for 10% of global carbon emissions
- Deforestation receives just 2.2% of climate funding
The Forest Funding Gap
Climate change has been referred to as modern day civilization’s greatest challenge. And stopping deforestation is an important step in the battle to stop rising global temperatures. Yet, when you look at the amount of climate funding earmarked for deforestation, something doesn’t add up.
This graphic from The LEAF Coalition looks at the state of global deforestation and compares how much climate funding it receives relative to its global CO2 emissions.
Deforestation’s Role in Global Emissions
Protecting our forests and protecting the climate are one in the same. In fact, the data reveals that tropical deforestation accounts for 10% of global CO2 emissions.
What’s more, these levels of emissions exceed that of all individual countries except for the U.S. and China. Despite this, climate funding towards deforestation only accounts for $14 billion of the over $618 billion available, representing a small 2.2% slice of the total.
This is especially problematic when considering a forest’s carbon stock and carbon sequestration capabilities. Here’s how different forests across the globe compare when looking at gigatonnes of carbon stock.
| Ecosystem | Estimated Carbon Stock (Gt) | Annual Loss Rate |
|---|---|---|
| Tropical moist forests | 295 Gt | 0.45% |
| Boreal forests | 283 Gt | 0.18% |
| Temperate broadleaf forests | 133 Gt | 0.35% |
| Temperate conifer forests | 66 Gt | 0.28% |
| Tropical dry forests | 14 Gt | 0.58% |
| Mangroves | 7.3Gt | 0.13% |
A carbon stock or carbon pool refers to a system that can store carbon and take it out of the atmosphere. Forests are used to offset plenty of carbon emissions, and by some estimates, it would cost $25 billion for additional carbon offsets to match and compensate for unabated emissions.
This is crucial because unabated emissions are those who’s harm are not reduced from carbon reduction methods. While this may sound like a lot, it’s equivalent to just 1.5% of the profits from Fortune Global 500 companies.
Altogether, approximately 30% of global emissions are absorbed by forests each year. Despite this, 3.75 million hectares of tropical primary rainforest were lost in 2021, equivalent to 600 football pitches per hour.
Turning The Page
It’s practically impossible to effectively tackle climate change without addressing deforestation. The broader agriculture, forestry and other land use category (which includes deforestation) accounts for 21% of all global CO2 emissions.
Swift action is required in order to slow deforestation and decelerate rising average temperatures. See how The LEAF Coalition, a public-private initiative, is accelerating climate action by providing results-based finance to countries committed to protecting tropical forests.


Datastream
Can You Calculate Your Daily Carbon Footprint?
Discover how the average person’s carbon footprint impacts the environment and learn how carbon credits can offset your carbon footprint.


The Briefing
- A person’s carbon footprint is substantial, with activities such as food consumption creating as much as 4,500 g of CO₂ emissions daily.
- By purchasing carbon credits from Carbon Streaming Corporation, you can offset your own emissions and fund positive climate action.
Your Everyday Carbon Footprint
While many large businesses and countries have committed to net-zero goals, it is essential to acknowledge that your everyday activities also contribute to global emissions.
In this graphic, sponsored by Carbon Streaming Corporation, we will explore how the choices we make and the products we use have a profound impact on our carbon footprint.
Carbon Emissions by Activity
Here are some of the daily activities and products of the average person and their carbon footprint, according to Clever Carbon.
| Household Activities & Products | CO2 Emissions (g) |
|---|---|
| 💡 Standard Light Bulb (100 watts, four hours) | 172 g |
| 📱 Mobile Phone Use (195 minutes per day)* | 189 g |
| 👕 Washing Machine (0.63 kWh) | 275 g |
| 🔥 Electric Oven (1.56 kWh) | 675 g |
| ♨️ Tumble Dryer (2.5 kWh) | 1,000 g |
| 🧻 Toilet Roll (2 ply) | 1,300 g |
| 🚿 Hot Shower (10 mins) | 2,000 g |
| 🚙 Daily Commute (one hour, by car) | 3,360 g |
| 🍽️ Average Daily Food Consumption (three meals of 600 calories) | 4,500 g |
| *Phone use based on yearly use of 69kg per the source, Reboxed | |
Your choice of transportation plays a crucial role in determining your carbon footprint. For instance, a 15 km daily commute to work on public transport generates an average of 1,464 g of CO₂ emissions. Compared to 3,360 g—twice the volume for a journey the same length by car.
By opting for more sustainable modes of transport, such as cycling, walking, or public transportation, you can significantly reduce your carbon footprint.
Addressing Your Carbon Footprint
One way to compensate for your emissions is by purchasing high-quality carbon credits.
Carbon credits are used to help fund projects that avoid, reduce or remove CO₂ emissions. This includes nature-based solutions such as reforestation and improved forest management, or technology-based solutions such as the production of biochar and carbon capture and storage (CCS).
While carbon credits offer a potential solution for individuals to help reduce global emissions, public awareness remains a significant challenge. A BCG-Patch survey revealed that only 34% of U.S. consumers are familiar with carbon credits, and only 3% have purchased them in the past.
About Carbon Streaming
By financing the creation or expansion of carbon projects, Carbon Streaming Corporation secures the rights to future carbon credits generated by these sustainable projects. You can then purchase these carbon credits to help fund climate solutions around the world and compensate for your own emissions.
Ready to get involved?
>> Learn more about purchasing carbon credits at Carbon Streaming

-

 Real Estate2 weeks ago
Visualizing America’s Shortage of Affordable Homes
-

 Technology1 week ago
Ranked: Semiconductor Companies by Industry Revenue Share
-

 Money1 week ago
Which States Have the Highest Minimum Wage in America?
-

 Real Estate1 week ago
Ranked: The Most Valuable Housing Markets in America
-

 Business2 weeks ago
Charted: Big Four Market Share by S&P 500 Audits
-

 AI2 weeks ago
The Stock Performance of U.S. Chipmakers So Far in 2024
-

 Misc2 weeks ago
Almost Every EV Stock is Down After Q1 2024
-

 Money2 weeks ago
Where Does One U.S. Tax Dollar Go?