Markets
All the S&P 500 Women CEOs in One Timeline (2000-2019)
var divElement = document.getElementById(‘viz1568739636115’); var vizElement = divElement.getElementsByTagName(‘object’)[0]; vizElement.style.width=’1100px’;vizElement.style.height=’2027px’; var scriptElement = document.createElement(‘script’); scriptElement.src = ‘https://public.tableau.com/javascripts/api/viz_v1.js’; vizElement.parentNode.insertBefore(scriptElement, vizElement);
All the S&P 500 Women CEOs in One Timeline (2000-2019)
Gender equality has made significant strides since the days of Rosie the Riveter. The iconic wartime image continues to symbolize womens’ empowerment in the present—especially in politics and the workforce.
Yet, the higher and further women get in their careers, it’s clear that barriers still remain. Today’s interactive timeline comes to us from Alex Architektonidis of BoardEx, and it tracks all the women chief executive officers (CEOs) of companies listed in the S&P 500 index since the turn of the century.
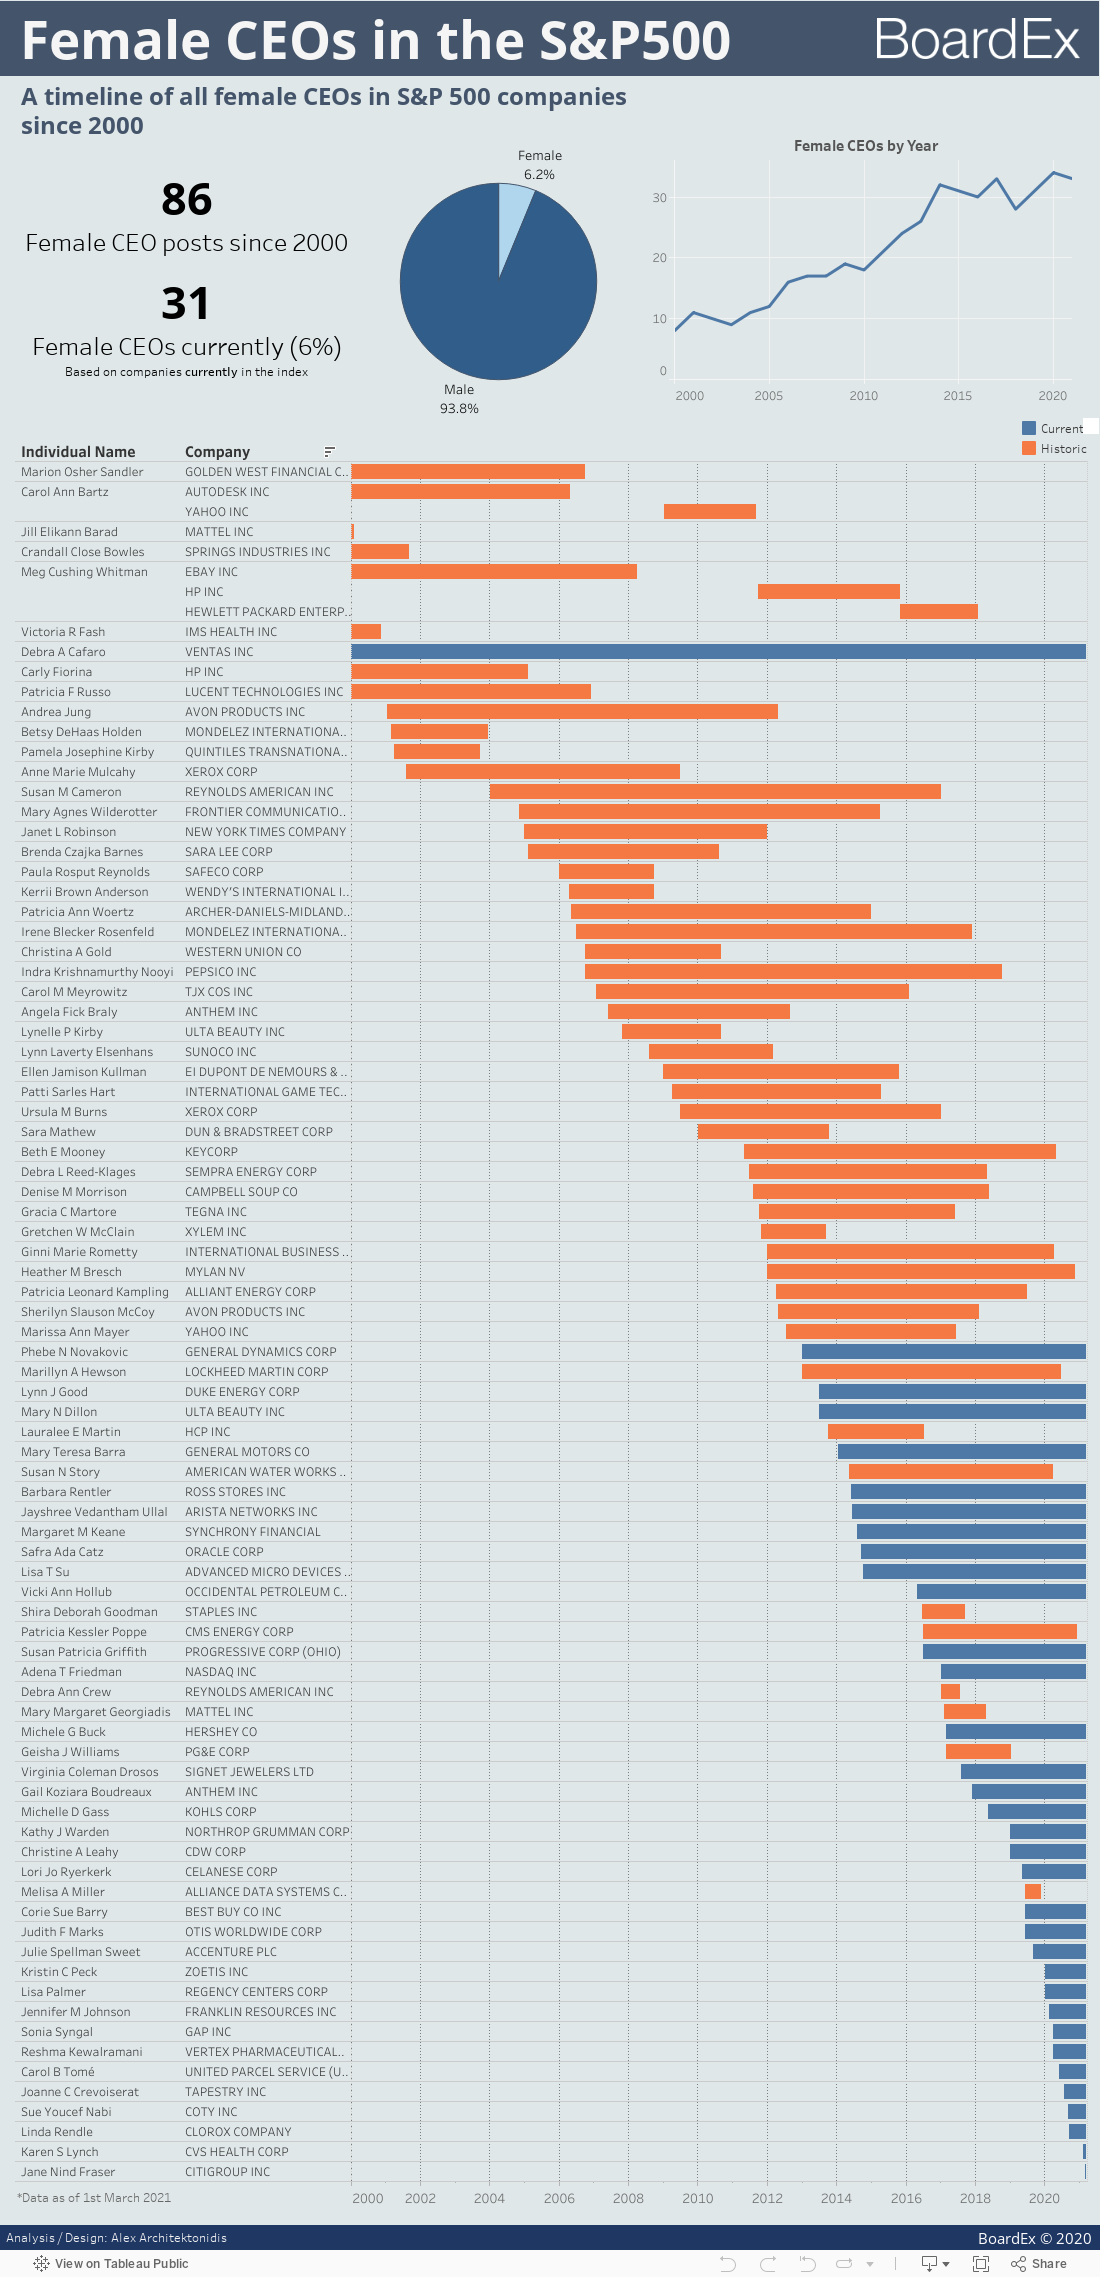
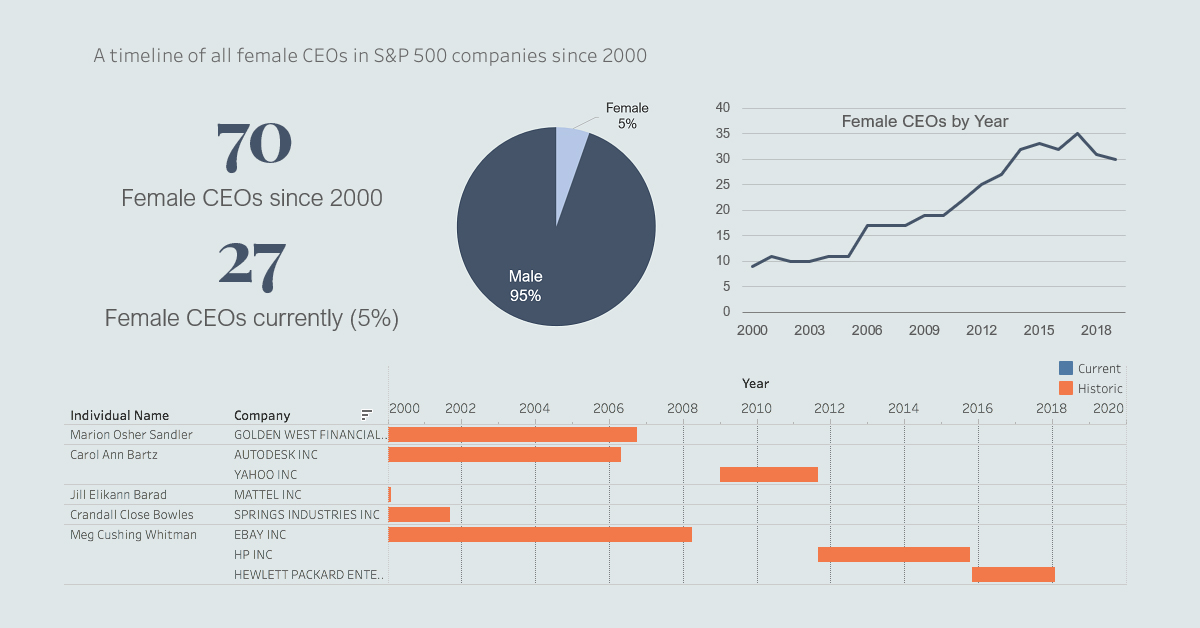
The kicker? Across the 500 large-cap companies in the index, only 70 women have ever held the position of CEO or similar titles—and only 28 women currently have this status.
Which Industries Have the Most Women CEOs?
The S&P 500 covers approximately 80% of the U.S. equity market by capitalization. Since the index is fluid and regularly updated, women CEOs were selected based on whether their company was listed in the index during their tenure.
Out of all the sectors represented on the timeline, the top categories are retail with 14 women CEOs, engineering and tech with 10 women CEOs, and finance with 9 women CEOs. Food & beverage and utilities are tied with 7 women CEOs each.
Women Leading in the Corporate World
Topping the list is Marion Osher Sandler, the first and longest-serving woman CEO in the United States. She held the title for nearly 27 years at Golden West Financial Corp (from 1980 to 2006), a company she co-founded and grew to $125 billion in assets.
The next person in line for the longest female-led CEO term is Debra A Cafaro, from the healthcare-focused real estate investment trust Ventas Inc. Cafaro has been CEO of Ventas for 20 years, and generated a cumulative total return of 2,559% since 1999—the S&P average for returns over the same time period was only 215%.
Only two women CEOs show up more than twice on the timeline. The first is Meg Cushing Whitman, who served as President/CEO of Ebay from 1998–2008, Chairman/President/CEO of HP Inc. from 2011–2015, and finally as the CEO of Hewlett Packard from 2015 to 2018. In total, Whitman has spent over 16 years as CEO of these S&P 500 companies.
However, Carol Ann Bartz also has an impressive CV, with nearly 17 years as a CEO under her belt. Bartz was the Chairman/President/CEO of the software corporation Autodesk from 1992–2006, and later on at Yahoo from 2009 to 2011.
The most recent addition to this list is Julie Spellman Sweet, who became the CEO of Accenture on September 1st. She was previously the CEO of Accenture’s North American division, and has been crowned on Fortune’s “Most Powerful Women” list from 2016–2018 consecutively. Sweet’s appointment aligns well with Accenture’s corporate diversity targets—the company is aiming for 25% women in managing director roles globally by 2020.
There’s More Work To Be Done
There’s a growing body of evidence that corporate diversity improves a company’s financial bottom line. A recent CNBC analysis shows that in 2019, over half of female CEOs led their company’s stocks to outperform the S&P 500 index, with some even showing quadruple-digit percentage returns (as previously mentioned with Ventas).
Despite womens’ contributions to nearly half the labor force and consistent success as CEOs, they are disproportionately represented higher up the ladder. Women CEOs still lead a meager 5.6% of S&P 500 companies overall—in fact, women CEO appointments are actually slowing down, averaging less than 6% since 2015.
Such stunted growth is setting back equality at the C-suite level drastically. A joint report between the non-profit Lean In and the consulting firm McKinsey & Co. offers some insight into the reasons underlying this disparity:
Since 2015… corporate America has made almost no progress in improving women’s representation. From the outset, fewer women than men are hired at the entry level. And at every subsequent step, the representation of women further declines.


Markets
The European Stock Market: Attractive Valuations Offer Opportunities
On average, the European stock market has valuations that are nearly 50% lower than U.S. valuations. But how can you access the market?


European Stock Market: Attractive Valuations Offer Opportunities
Europe is known for some established brands, from L’Oréal to Louis Vuitton. However, the European stock market offers additional opportunities that may be lesser known.
The above infographic, sponsored by STOXX, outlines why investors may want to consider European stocks.
Attractive Valuations
Compared to most North American and Asian markets, European stocks offer lower or comparable valuations.
| Index | Price-to-Earnings Ratio | Price-to-Book Ratio |
|---|---|---|
| EURO STOXX 50 | 14.9 | 2.2 |
| STOXX Europe 600 | 14.4 | 2 |
| U.S. | 25.9 | 4.7 |
| Canada | 16.1 | 1.8 |
| Japan | 15.4 | 1.6 |
| Asia Pacific ex. China | 17.1 | 1.8 |
Data as of February 29, 2024. See graphic for full index names. Ratios based on trailing 12 month financials. The price to earnings ratio excludes companies with negative earnings.
On average, European valuations are nearly 50% lower than U.S. valuations, potentially offering an affordable entry point for investors.
Research also shows that lower price ratios have historically led to higher long-term returns.
Market Movements Not Closely Connected
Over the last decade, the European stock market had low-to-moderate correlation with North American and Asian equities.
The below chart shows correlations from February 2014 to February 2024. A value closer to zero indicates low correlation, while a value of one would indicate that two regions are moving in perfect unison.
| EURO STOXX 50 | STOXX EUROPE 600 | U.S. | Canada | Japan | Asia Pacific ex. China |
|
|---|---|---|---|---|---|---|
| EURO STOXX 50 | 1.00 | 0.97 | 0.55 | 0.67 | 0.24 | 0.43 |
| STOXX EUROPE 600 | 1.00 | 0.56 | 0.71 | 0.28 | 0.48 | |
| U.S. | 1.00 | 0.73 | 0.12 | 0.25 | ||
| Canada | 1.00 | 0.22 | 0.40 | |||
| Japan | 1.00 | 0.88 | ||||
| Asia Pacific ex. China | 1.00 |
Data is based on daily USD returns.
European equities had relatively independent market movements from North American and Asian markets. One contributing factor could be the differing sector weights in each market. For instance, technology makes up a quarter of the U.S. market, but health care and industrials dominate the broader European market.
Ultimately, European equities can enhance portfolio diversification and have the potential to mitigate risk for investors.
Tracking the Market
For investors interested in European equities, STOXX offers a variety of flagship indices:
| Index | Description | Market Cap |
|---|---|---|
| STOXX Europe 600 | Pan-regional, broad market | €10.5T |
| STOXX Developed Europe | Pan-regional, broad-market | €9.9T |
| STOXX Europe 600 ESG-X | Pan-regional, broad market, sustainability focus | €9.7T |
| STOXX Europe 50 | Pan-regional, blue-chip | €5.1T |
| EURO STOXX 50 | Eurozone, blue-chip | €3.5T |
Data is as of February 29, 2024. Market cap is free float, which represents the shares that are readily available for public trading on stock exchanges.
The EURO STOXX 50 tracks the Eurozone’s biggest and most traded companies. It also underlies one of the world’s largest ranges of ETFs and mutual funds. As of November 2023, there were €27.3 billion in ETFs and €23.5B in mutual fund assets under management tracking the index.
“For the past 25 years, the EURO STOXX 50 has served as an accurate, reliable and tradable representation of the Eurozone equity market.”
— Axel Lomholt, General Manager at STOXX
Partnering with STOXX to Track the European Stock Market
Are you interested in European equities? STOXX can be a valuable partner:
- Comprehensive, liquid and investable ecosystem
- European heritage, global reach
- Highly sophisticated customization capabilities
- Open architecture approach to using data
- Close partnerships with clients
- Part of ISS STOXX and Deutsche Börse Group
With a full suite of indices, STOXX can help you benchmark against the European stock market.
Learn how STOXX’s European indices offer liquid and effective market access.

-

 Economy3 days ago
Economic Growth Forecasts for G7 and BRICS Countries in 2024
The IMF has released its economic growth forecasts for 2024. How do the G7 and BRICS countries compare?
-

 Markets2 weeks ago
U.S. Debt Interest Payments Reach $1 Trillion
U.S. debt interest payments have surged past the $1 trillion dollar mark, amid high interest rates and an ever-expanding debt burden.
-

 United States2 weeks ago
Ranked: The Largest U.S. Corporations by Number of Employees
We visualized the top U.S. companies by employees, revealing the massive scale of retailers like Walmart, Target, and Home Depot.
-

 Markets2 weeks ago
The Top 10 States by Real GDP Growth in 2023
This graphic shows the states with the highest real GDP growth rate in 2023, largely propelled by the oil and gas boom.
-

 Markets2 weeks ago
Ranked: The World’s Top Flight Routes, by Revenue
In this graphic, we show the highest earning flight routes globally as air travel continued to rebound in 2023.
-

 Markets3 weeks ago
Ranked: The Most Valuable Housing Markets in America
The U.S. residential real estate market is worth a staggering $47.5 trillion. Here are the most valuable housing markets in the country.


-

 Debt1 week ago
How Debt-to-GDP Ratios Have Changed Since 2000
-
Markets2 weeks ago
Ranked: The World’s Top Flight Routes, by Revenue
-

 Countries2 weeks ago
Population Projections: The World’s 6 Largest Countries in 2075
-
Markets2 weeks ago
The Top 10 States by Real GDP Growth in 2023
-

 Demographics2 weeks ago
The Smallest Gender Wage Gaps in OECD Countries
-

 United States2 weeks ago
Where U.S. Inflation Hit the Hardest in March 2024
-

 Green2 weeks ago
Top Countries By Forest Growth Since 2001
-
United States2 weeks ago
Ranked: The Largest U.S. Corporations by Number of Employees