Investor Education
Why Investors Should Rethink Traditional Income Strategies

Why Investors Should Rethink Traditional Income Strategies
Humans are creatures of habit. We all have daily routines, whether it’s walking the same lunchtime route, watching a familiar TV show, or cooking the same meal over and over again. Once we develop a pattern, it can take a drastic change to convince us to rethink our approach.
One such shake-up to ingrained investment habits is the changing landscape of income investing.
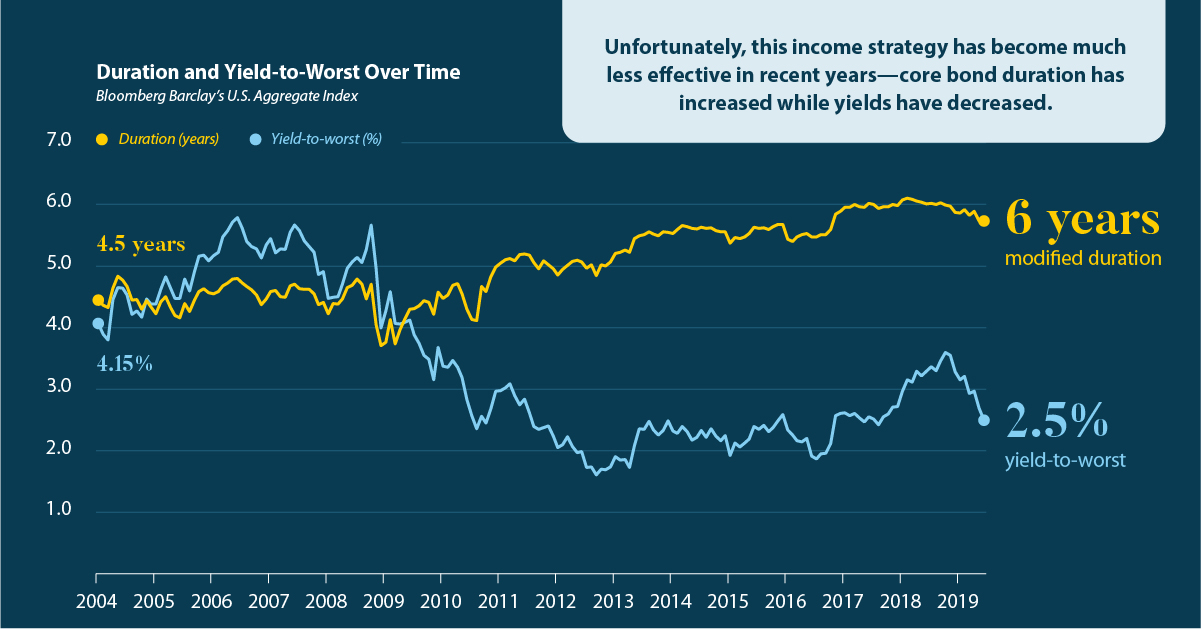
In today’s infographic from New York Life Investments, we explain why traditional long-term bonds may not be as effective as they were in the past, and which additional income strategies investors can consider.
The Status Quo
For years, investors have relied on traditional longer-term bonds as the centerpiece in an income portfolio. These debt instruments usually pay out interest to investors on a predetermined schedule, providing a steady income stream investment. Historically, they have also been subject to less volatility than equities.
The typical bond portfolio is diversified, much like the Bloomberg Barclay’s U.S. Aggregate Index. Here’s how the sectors are broken down in the index:
| Sector | Market Value |
|---|---|
| Treasury | 39.5% |
| Government-Related | 5.8% |
| Corporate | 25.0% |
| Securitized | 29.7% |
Unfortunately, this income strategy has been less effective in recent years. Over the last decade, core bond duration has increased by 1.5 years while yields have decreased by almost 2%. Essentially, interest rate volatility has increased—but investors are less compensated for the risk.
In light of low rates and higher expected market volatility, it’s critical that investors explore other income solutions. Luckily, there are many lesser-known asset classes for investors to consider.
Additional Income Strategies: An Investor’s Choice
When investors decide how to re-allocate, they can keep these objectives in mind:
- Preservation of principal (risk level)
- Pursuit of capital (growth potential)
- Perseverance in markets (long-term objectives)
Which additional income strategies can they explore?
Taxable Municipal Bonds
Issued by state and local governments, the yield of taxable munis has historically been higher than that of other sectors. Taxable munis also have a strong credit rating—over 76% of U.S. municipal bonds outstanding are A+ rated or better.
Insured Municipal Bonds
Investors can get additional downside protection with insured municipal bonds, which are guaranteed to pay interest and principal back by private insurers. They have historically performed similar to munis while capturing less of the “downside”, often providing an attractive risk-adjusted return for income investors.
Short-duration, High-yield Bonds
Bonds with a shorter duration and higher yield can be a lower volatility approach to achieving the same income investing goals.
Yield and Risk in Bonds (July 1, 2014 – June 30, 2019):
| Bond Type | Yield | Standard Deviation (annualized) | Yield per Unit of Risk |
|---|---|---|---|
| U.S. Aggregate Bonds | 2.49 | 2.94 | 0.85 |
| High Yield Bonds | 6.05 | 5.60 | 1.08 |
| Low-duration, High-yield bonds | 5.00 | 3.90 | 1.28 |
Short duration funds have lower interest rate risk, and can offer attractive yield per unit of risk.
Yield-Centric Equities
Equities can also play a role in an income focused portfolio. Investors should look for established companies that are achieving:
- Growth in free cash flow
- Stable or growing dividends
- Share buybacks or debt reduction
Over the last 40+ years, the annual compound return of stocks with growing dividends have outperformed dividend cutters on the S&P 500 by more than 4%.
Preparing for Your Future
Maximizing the benefit from new income opportunities can take time. For this reason, it’s important to consider potential portfolio changes now, so that these strategies can play out in the lead up to retirement years.
It may be tempting to stick with the status quo—both in daily routines and investment strategies—but those who proactively adjust their approach will be able to maximize their potential.


Investor Education
How MSCI Builds Thematic Indexes: A Step-by-Step Guide
From developing an index objective to choosing relevant stocks, this graphic breaks down how MSCI builds thematic indexes using examples.


How MSCI Builds Thematic Indexes: A Step-by-Step Guide
Have you ever wondered how MSCI builds its thematic indexes?
To capture long-term, structural trends that could drive business performance in the future, the company follows a systematic approach. This graphic from MSCI breaks down each step in the process used to create its thematic indexes.
Step 1: Develop an Index Objective
MSCI first builds a broad statement of what the theme aims to capture based on extensive research and insights from industry experts.
Steps 2 and 3: List Sub-Themes, Generate Keyword List
Together with experts, MSCI creates a list of sub-themes or “seedwords” to identify aligned business activities.
The team then assembles a collection of suitable documents describing the theme. Natural language processing efficiently analyzes word frequency and relevance to generate a more detailed set of keywords contextually similar to the seedwords.
Step 4: Find Relevant Companies
By analyzing financial reports, MSCI picks companies relevant to the theme using two methods:
- Direct approach: Revenue from a company’s business segment is considered 100% relevant if the segment name matches a theme keyword. Standard Industrial Classification (SIC) codes from these directly-matched segments make up the eligible SIC code list used in the indirect approach.
- Indirect approach: If a segment name doesn’t match theme keywords, MSCI will:
- Analyze the density of theme keywords mentioned in the company’s description. A minimum of two unique keywords is required.
- The keyword density determines a “discount factor” to reflect lower certainty in theme alignment.
- Revenue from business segments with an eligible SIC code, regardless of how they are named, is scaled down by the discount factor.
The total percentage of revenue applicable to the theme from both approaches determines a company’s relevance score.
Step 5: Select the Stocks
Finally, MSCI narrows down the stocks that will be included:
- Global parent universe: The ACWI Investable Market Index (IMI) is the starting point for standard thematic indexes.
- Relevance filter: The universe is filtered for companies with a relevance score of at least 25%.
- False positive control: Eligible companies that are mapped to un-related GICS sub-industries are removed.
Companies with higher relevance scores and market caps have a higher weighting in the index, with the maximum weighting for any one issuer capped at 5%. The final selected stocks span various sectors.
MSCI Thematic Indexes: Regularly Updated and Rules-Based
Once an index is built, it is reviewed semi-annually and updated based on:
- Changes to the parent index
- Changes at individual companies
- Theme developments based on expert input
Theme keywords are reviewed yearly in May. Overall, MSCI’s thematic index construction process is objective, scalable, and flexible. The process can be customized based on the theme(s) you want to capture.
Learn more about MSCI’s thematic indexes.

-

 Investor Education6 months ago
The 20 Most Common Investing Mistakes, in One Chart
Here are the most common investing mistakes to avoid, from emotionally-driven investing to paying too much in fees.
-

 Stocks10 months ago
Visualizing BlackRock’s Top Equity Holdings
BlackRock is the world’s largest asset manager, with over $9 trillion in holdings. Here are the company’s top equity holdings.
-

 Investor Education11 months ago
10-Year Annualized Forecasts for Major Asset Classes
This infographic visualizes 10-year annualized forecasts for both equities and fixed income using data from Vanguard.
-

 Investor Education1 year ago
Visualizing 90 Years of Stock and Bond Portfolio Performance
How have investment returns for different portfolio allocations of stocks and bonds compared over the last 90 years?
-

 Debt2 years ago
Countries with the Highest Default Risk in 2022
In this infographic, we examine new data that ranks the top 25 countries by their default risk.
-

 Markets2 years ago
The Best Months for Stock Market Gains
This infographic analyzes over 30 years of stock market performance to identify the best and worst months for gains.


-

 Debt1 week ago
How Debt-to-GDP Ratios Have Changed Since 2000
-

 Countries2 weeks ago
Population Projections: The World’s 6 Largest Countries in 2075
-

 Markets2 weeks ago
The Top 10 States by Real GDP Growth in 2023
-

 Demographics2 weeks ago
The Smallest Gender Wage Gaps in OECD Countries
-

 United States2 weeks ago
Where U.S. Inflation Hit the Hardest in March 2024
-

 Green2 weeks ago
Top Countries By Forest Growth Since 2001
-

 United States2 weeks ago
Ranked: The Largest U.S. Corporations by Number of Employees
-

 Maps2 weeks ago
The Largest Earthquakes in the New York Area (1970-2024)