Markets
Taking Advantage of the Infrastructure Boom: The Case for Taxable Municipal Bonds

The Case for Taxable Municipal Bonds for Investors
If you’re a homeowner, there are probably a few things you’ve been neglecting to do. Perhaps the kitchen needs upgrading, or the roof needs replacing. We tend to procrastinate on these improvements due to large renovation costs, until it hits a point where we can’t ignore them anymore. This is the state that U.S. infrastructure has reached—on a national scale.
Today’s infographic from New York Life Investments highlights the level of disrepair in U.S. infrastructure. It also explores why taxable municipal bonds, which will finance the required infrastructure upgrades, provide such an interesting investment opportunity.
Falling Apart at the Seams
The American Society of Civil Engineers (ACSE) regularly assesses the nation’s infrastructure—things like bridges, airports, and drinking water—and scores it in a ‘report card’. After decades of neglect, the U.S. only scored a D+ in 2017.
The ASCE estimates that $4 trillion is needed to bring infrastructure up to a B grade, $1.3 trillion of which will be provided by state and local governments.
The urgent needs for increased investment in America’s infrastructure continue to grow and our nation’s economic vitality and quality of life are at stake.
— Ed Mortimer, U.S. Chamber Vice President of Transportation and Infrastructure
U.S. municipal bonds will be the primary funding source for this massive financing need. These bonds are quite popular with individual U.S. investors, as the interest income from most municipal bonds is not subject to federal income tax.
However, the U.S. tax code limits the volume of non-taxable bonds issued, and the purposes for issuing them. As a result, many local and state governments have been turning to taxable municipal bonds to finance their infrastructure projects.
The Muni Opportunity
Taxable municipal bonds are a potentially attractive investment for many reasons.
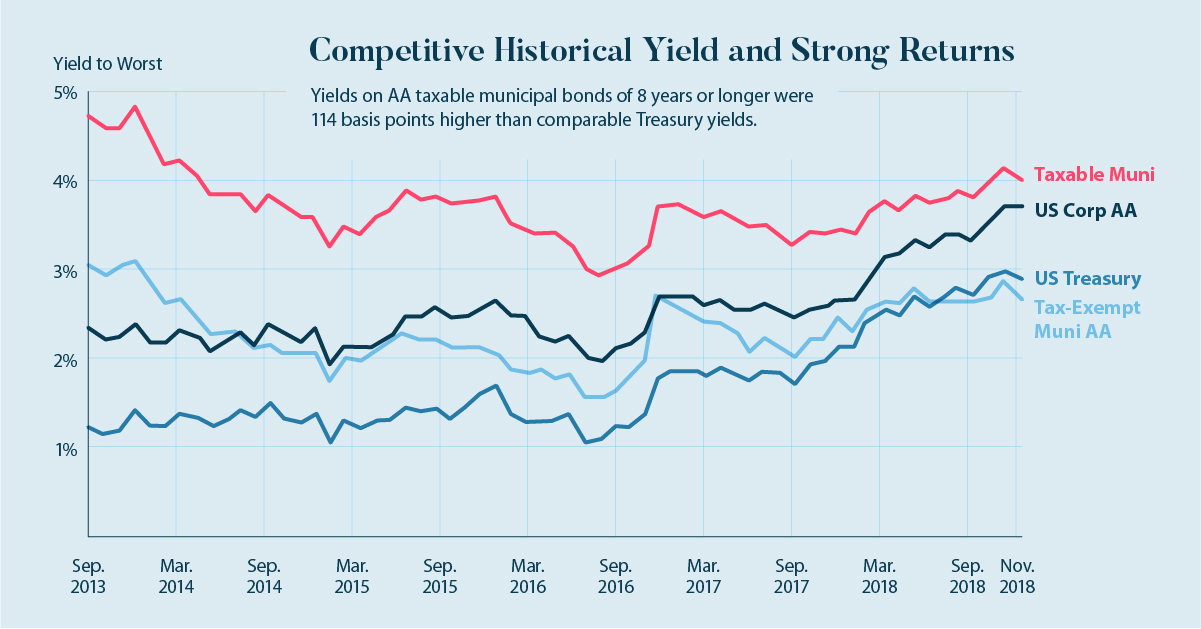
1. Competitive Historical Yield and Strong Returns
In the last decade, a lagging global economy led to historically low interest rates—many sovereign (national) bonds fell into negative territory. Taxable municipal bonds provided an alternative source of yield potential, outpacing the yields of comparable treasury bonds in some cases.
Not only that, but in the post-crisis era, taxable municipal bonds have averaged a return of 6.9% per year, beating the 4.6% performance on U.S. corporate investment-grade bonds, a staple in most institutional portfolios.
2. High-Quality, Stable Credit Ratings
Most municipal bonds are high quality with low default rates, making them attractive to risk-conscious investors.
| U.S. Municipals | Global Corporates | |
|---|---|---|
| Rating Spread | Over 76% rated A+ or better | Only about 10% are AA rated |
| Tiny portion below investment grade | Nearly half are below investment grade | |
| Default Rate | 0.81% for those rated BAA by S&P | 0.84% for those rated AAA by S&P |
Historically, municipal bond ratings have also been far more stable than that of global corporates.
3. Inefficient pricing
The municipal bond market is highly fragmented, and most issues are too small to be included in a market index.
This market fragmentation, combined with limited sell-side research and many buy-and-hold investors, often leads to inefficient pricing. Active investors have the potential to generate higher returns by applying their credit research and trading skills.
4. Low Correlations
Correlation measures the degree to which two securities move in relation to each other. In general, taxable municipal bonds have a low correlation to other fixed-income sectors. This means they help provide portfolio diversification and reduce volatility.
5. Longer durations
Since taxable municipal bonds fund long-term capital projects, they are usually financed with longer maturing bonds. Institutional investors welcome this source of long-duration assets, as they can match them up with their long-dated obligations.
A Compelling Portfolio Addition
Taxable municipal bonds have many positive qualities that make them a strong contender for investment. When added to a diversified fixed-income portfolio, they may also improve the risk/return profile.
As the U.S. begins to revitalize its infrastructure, taxable municipal bonds present a strong—and often overlooked—opportunity for investors.


Markets
The European Stock Market: Attractive Valuations Offer Opportunities
On average, the European stock market has valuations that are nearly 50% lower than U.S. valuations. But how can you access the market?


European Stock Market: Attractive Valuations Offer Opportunities
Europe is known for some established brands, from L’Oréal to Louis Vuitton. However, the European stock market offers additional opportunities that may be lesser known.
The above infographic, sponsored by STOXX, outlines why investors may want to consider European stocks.
Attractive Valuations
Compared to most North American and Asian markets, European stocks offer lower or comparable valuations.
| Index | Price-to-Earnings Ratio | Price-to-Book Ratio |
|---|---|---|
| EURO STOXX 50 | 14.9 | 2.2 |
| STOXX Europe 600 | 14.4 | 2 |
| U.S. | 25.9 | 4.7 |
| Canada | 16.1 | 1.8 |
| Japan | 15.4 | 1.6 |
| Asia Pacific ex. China | 17.1 | 1.8 |
Data as of February 29, 2024. See graphic for full index names. Ratios based on trailing 12 month financials. The price to earnings ratio excludes companies with negative earnings.
On average, European valuations are nearly 50% lower than U.S. valuations, potentially offering an affordable entry point for investors.
Research also shows that lower price ratios have historically led to higher long-term returns.
Market Movements Not Closely Connected
Over the last decade, the European stock market had low-to-moderate correlation with North American and Asian equities.
The below chart shows correlations from February 2014 to February 2024. A value closer to zero indicates low correlation, while a value of one would indicate that two regions are moving in perfect unison.
| EURO STOXX 50 | STOXX EUROPE 600 | U.S. | Canada | Japan | Asia Pacific ex. China |
|
|---|---|---|---|---|---|---|
| EURO STOXX 50 | 1.00 | 0.97 | 0.55 | 0.67 | 0.24 | 0.43 |
| STOXX EUROPE 600 | 1.00 | 0.56 | 0.71 | 0.28 | 0.48 | |
| U.S. | 1.00 | 0.73 | 0.12 | 0.25 | ||
| Canada | 1.00 | 0.22 | 0.40 | |||
| Japan | 1.00 | 0.88 | ||||
| Asia Pacific ex. China | 1.00 |
Data is based on daily USD returns.
European equities had relatively independent market movements from North American and Asian markets. One contributing factor could be the differing sector weights in each market. For instance, technology makes up a quarter of the U.S. market, but health care and industrials dominate the broader European market.
Ultimately, European equities can enhance portfolio diversification and have the potential to mitigate risk for investors.
Tracking the Market
For investors interested in European equities, STOXX offers a variety of flagship indices:
| Index | Description | Market Cap |
|---|---|---|
| STOXX Europe 600 | Pan-regional, broad market | €10.5T |
| STOXX Developed Europe | Pan-regional, broad-market | €9.9T |
| STOXX Europe 600 ESG-X | Pan-regional, broad market, sustainability focus | €9.7T |
| STOXX Europe 50 | Pan-regional, blue-chip | €5.1T |
| EURO STOXX 50 | Eurozone, blue-chip | €3.5T |
Data is as of February 29, 2024. Market cap is free float, which represents the shares that are readily available for public trading on stock exchanges.
The EURO STOXX 50 tracks the Eurozone’s biggest and most traded companies. It also underlies one of the world’s largest ranges of ETFs and mutual funds. As of November 2023, there were €27.3 billion in ETFs and €23.5B in mutual fund assets under management tracking the index.
“For the past 25 years, the EURO STOXX 50 has served as an accurate, reliable and tradable representation of the Eurozone equity market.”
— Axel Lomholt, General Manager at STOXX
Partnering with STOXX to Track the European Stock Market
Are you interested in European equities? STOXX can be a valuable partner:
- Comprehensive, liquid and investable ecosystem
- European heritage, global reach
- Highly sophisticated customization capabilities
- Open architecture approach to using data
- Close partnerships with clients
- Part of ISS STOXX and Deutsche Börse Group
With a full suite of indices, STOXX can help you benchmark against the European stock market.
Learn how STOXX’s European indices offer liquid and effective market access.

-

 Economy4 days ago
Economic Growth Forecasts for G7 and BRICS Countries in 2024
The IMF has released its economic growth forecasts for 2024. How do the G7 and BRICS countries compare?
-

 Markets2 weeks ago
U.S. Debt Interest Payments Reach $1 Trillion
U.S. debt interest payments have surged past the $1 trillion dollar mark, amid high interest rates and an ever-expanding debt burden.
-

 United States2 weeks ago
Ranked: The Largest U.S. Corporations by Number of Employees
We visualized the top U.S. companies by employees, revealing the massive scale of retailers like Walmart, Target, and Home Depot.
-

 Markets2 weeks ago
The Top 10 States by Real GDP Growth in 2023
This graphic shows the states with the highest real GDP growth rate in 2023, largely propelled by the oil and gas boom.
-

 Markets3 weeks ago
Ranked: The World’s Top Flight Routes, by Revenue
In this graphic, we show the highest earning flight routes globally as air travel continued to rebound in 2023.
-

 Markets3 weeks ago
Ranked: The Most Valuable Housing Markets in America
The U.S. residential real estate market is worth a staggering $47.5 trillion. Here are the most valuable housing markets in the country.


-

 Brands6 days ago
How Tech Logos Have Evolved Over Time
-

 Demographics2 weeks ago
The Smallest Gender Wage Gaps in OECD Countries
-

 Economy2 weeks ago
Where U.S. Inflation Hit the Hardest in March 2024
-

 Green2 weeks ago
Top Countries By Forest Growth Since 2001
-
United States2 weeks ago
Ranked: The Largest U.S. Corporations by Number of Employees
-

 Maps2 weeks ago
The Largest Earthquakes in the New York Area (1970-2024)
-

 Green2 weeks ago
Ranked: The Countries With the Most Air Pollution in 2023
-

 Green2 weeks ago
Ranking the Top 15 Countries by Carbon Tax Revenue