Misc
Rebuilding America: The Coming Opportunity in Infrastructure
It’s hard for most stakeholders to get excited about replacing an aging bridge.
Chaotic construction can disrupt the flow of traffic for many years, while annoying many of the local residents. Even worse, such projects usually go over budget, ultimately costing millions or even billions in taxpayer dollars.
At the end of the day, you have a new and improved bridge – but was it really worth all the hassle?
Rebuilding America
It’s not always easy to see short-term ROI in replacing aging infrastructure, especially when there are many other pressing challenges for society to tackle.
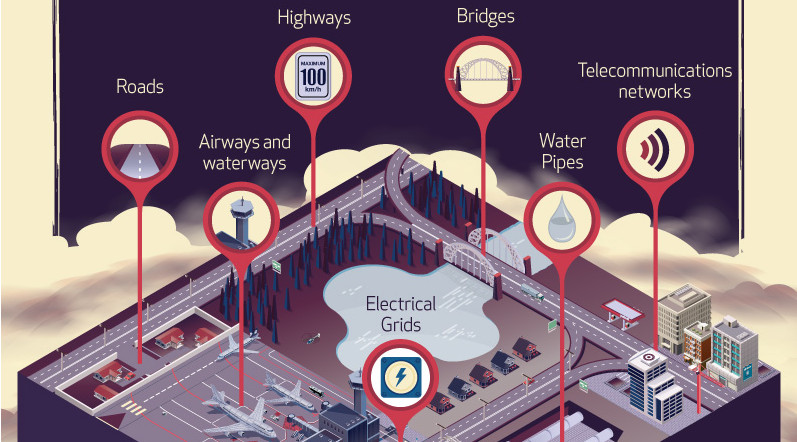
However, perpetually kicking the can down the road eventually leads to a situation that works in nobody’s favor. If streets, highways, rail, subways, airports, and bridges are all crumbling, the economy could eventually follow suit.

According to the latest report card by the American Society of Civil Engineers (ASCE), infrastructure in America barely gets a passing grade with a mark of D+.
Here is how things break down, by specific type of infrastructure:
| Infrastructure Type | Grade | Infrastructure Type | Grade | |
|---|---|---|---|---|
| Rail | B | Wastewater | D+ | |
| Solid waste | C+ | Roads | D | |
| Bridges | C+ | Aviation | D | |
| Ports | C+ | Dams | D | |
| Energy | D+ | Drinking water | D | |
| Hazardous waste | D+ | Inland waterways | D | |
| Schools | D+ | Levees | D | |
| Public Parks | D+ | Transit | D- |
The situation is grim – and the organization says that the country needs to spend an extra $2.1 trillion by 2025 to avoid making the situation worse.
Why Investors Should Care
Infrastructure is decidedly unsexy for investors.
However, it does come with some major benefits – in fact, JP Morgan Asset Management says that infrastructure investments tend to have low correlation with other asset classes, helping portfolio diversification. In addition, infrastructure is often protected from inflation, while providing a high yield and stable cash flows.
Here are some ways that regular investors can get access to the infrastructure sector:
- Materials stocks: Millions of tonnes of cement, concrete, steel, and other materials will be needed
- Construction and engineering stocks: These are the companies that will get the contracts to rebuild America
- Heavy machinery manufacturer stocks: Heavy machinery will be needed to get construction jobs done
- Infrastructure ETFs: Alternatively, there are thematic ETFs that build their funds around infrastructure
How will you try to play the coming infrastructure boom?


VC+
VC+: Get Our Key Takeaways From the IMF’s World Economic Outlook
A sneak preview of the exclusive VC+ Special Dispatch—your shortcut to understanding IMF’s World Economic Outlook report.

Have you read IMF’s latest World Economic Outlook yet? At a daunting 202 pages, we don’t blame you if it’s still on your to-do list.
But don’t worry, you don’t need to read the whole April release, because we’ve already done the hard work for you.
To save you time and effort, the Visual Capitalist team has compiled a visual analysis of everything you need to know from the report—and our upcoming VC+ Special Dispatch will be available exclusively to VC+ members on Thursday, April 25th.
If you’re not already subscribed to VC+, make sure you sign up now to receive the full analysis of the IMF report, and more (we release similar deep dives every week).
For now, here’s what VC+ members can expect to receive.
Your Shortcut to Understanding IMF’s World Economic Outlook
With long and short-term growth prospects declining for many countries around the world, this Special Dispatch offers a visual analysis of the key figures and takeaways from the IMF’s report including:
- The global decline in economic growth forecasts
- Real GDP growth and inflation forecasts for major nations in 2024
- When interest rate cuts will happen and interest rate forecasts
- How debt-to-GDP ratios have changed since 2000
- And much more!

Get the Full Breakdown in the Next VC+ Special Dispatch
VC+ members will receive the full Special Dispatch on Thursday, April 25th.
Make sure you join VC+ now to receive exclusive charts and the full analysis of key takeaways from IMF’s World Economic Outlook.
Don’t miss out. Become a VC+ member today.
What You Get When You Become a VC+ Member
VC+ is Visual Capitalist’s premium subscription. As a member, you’ll get the following:
- Special Dispatches: Deep dive visual briefings on crucial reports and global trends
- Markets This Month: A snappy summary of the state of the markets and what to look out for
- The Trendline: Weekly curation of the best visualizations from across the globe
- Global Forecast Series: Our flagship annual report that covers everything you need to know related to the economy, markets, geopolitics, and the latest tech trends
- VC+ Archive: Hundreds of previously released VC+ briefings and reports that you’ve been missing out on, all in one dedicated hub
You can get all of the above, and more, by joining VC+ today.

-

 Markets1 week ago
Ranked: The Largest U.S. Corporations by Number of Employees
-

 Green3 weeks ago
Ranked: Top Countries by Total Forest Loss Since 2001
-

 Money2 weeks ago
Where Does One U.S. Tax Dollar Go?
-

 Automotive2 weeks ago
Almost Every EV Stock is Down After Q1 2024
-

 AI2 weeks ago
The Stock Performance of U.S. Chipmakers So Far in 2024
-

 Markets2 weeks ago
Charted: Big Four Market Share by S&P 500 Audits
-

 Real Estate2 weeks ago
Ranked: The Most Valuable Housing Markets in America
-

 Money2 weeks ago
Which States Have the Highest Minimum Wage in America?