Money
A History of Revolution in U.S. Taxation
As Benjamin Franklin once said, “Nothing is certain except death and taxes.”
While this quote was penned in 1789, his words still ring true today. U.S. taxation has changed over time, but it has always existed in some shape or form for over 250 years.
U.S. Taxation: 1765 to Today
In today’s infographic from New York Life Investments, we explore the history of U.S. taxation – from its colonial roots to its recent reform.

The modern American tax code has little resemblance to its early iterations.
Over the last few centuries, Americans have battled against British taxation, faced sky-high tax rates to fund war efforts, and enjoyed tax cuts designed to boost economic growth.
A Timeline of U.S. Taxation
Today, total U.S. tax revenue exceeds $3.4 trillion. Below are some notable events that have shaped modern American taxation.
Colonial Roots: 1765 to 1783
1765 – Stamp Act
In its first direct tax on the colonists, Britain places a tax on all paper – including ship’s papers, court documents, advertisements, and even playing cards.
1767 – Townshend Revenue Act
Importation duties are placed on British products such as glass, paint, and tea. The taxes are expected to raise £40,000 annually, (£6,500,000 in 2018 GBP). As hostilities continue to bubble up, colonists argue for “No taxation without representation”. Although taxes are imposed on the colonists, they aren’t able to elect representatives to British parliament.
1770 – The Boston Massacre
British troops occupy Boston to end the boycott on British goods. The March 5th Boston Massacre sees five colonists killed. By April, all Townshend duties are repealed except for the one on tea.
1773 – The Tea Act (May 10)
Britain grants the struggling British East India Company a monopoly on tea in America. While no new taxes are imposed, this angers colonists as it is seen as a thinly veiled plan to gain colonial support for the Townshend tax while threatening local business.
1773 – The Boston Tea Party (December 16)
Three ships arrive in Boston carrying British East India Company tea. Colonists refuse to allow the unloading of the tea, throwing all 342 chests of tea into Boston Harbour.
1775-1783 – The American Revolutionary War
Growing tensions between Britain and the colonists erupt in a full-scale war. After eight long years, Britain officially recognizes the independence of the United States.
A Free Nation: 1787 to 1943
1787 – The U.S. Constitution
Congress gains the “power to lay and collect taxes, duties, imposts, and excises.” The government primarily earns revenue from excise taxes and tariffs, including an “importation tax” on slaves.
1791-1794 – Whiskey Rebellion
Alexander Hamilton, the nation’s first Secretary of Treasury, leads the implementation of a whiskey excise tax. In 1794, whiskey rebels destroy a tax inspector’s home. President Washington sends in troops and quells the rebellion.
1862 – The Nation’s First Income Tax
To help pay for the Civil War, President Lincoln legislates the nation’s first income tax.
| Income level (1862 dollars) | Income level (2019 dollars) | Tax Rate |
|---|---|---|
| $600-$10,000 | $15,000-$250,000 | 3% |
| $10,000+ | $250,000+ | 5% |
1913 – 16th Amendment
As World War I looms the 16th amendment is ratified, allowing for taxation without allocation according to state populations. An income tax is permanently introduced for both individuals and corporations, and the first Form 1040 is created.
| Income Level (1913 dollars) | Income level (2019 dollars) | Tax Rate |
|---|---|---|
| $3,000+ | $77,000+ | 1% |
| $500,000+ | $12,800,000+ | 7% |
1918 – The Revenue Act
Tax rates skyrocket to pay for World War I efforts. The top tax rate is 77%.
1935 – Social Security Act
In light of the Great Depression, the Social Security Act introduces:
- An old-age pension program
- Unemployment insurance
- Funding for health and welfare programs
To fund the programs, a 2% tax is shared equally by an employee and their employer.
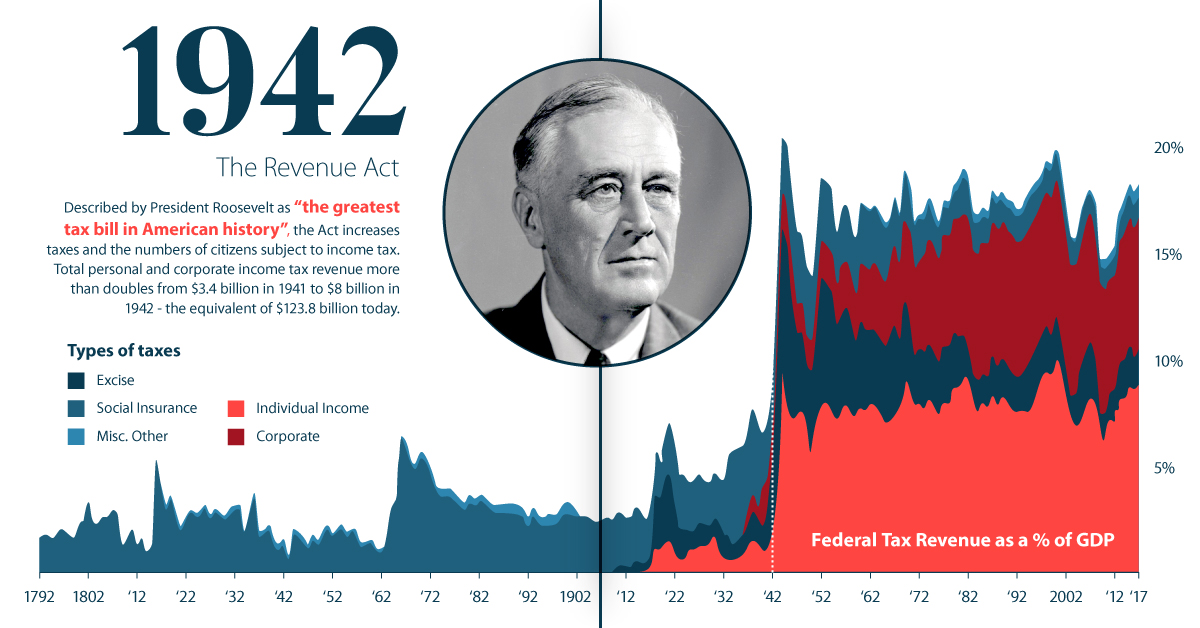
1942 – The Revenue Act
Described by President Roosevelt as “the greatest tax bill in American history”, the Act increases taxes and the numbers of citizens subject to income tax. Total personal and corporate income tax revenue more than doubles:
| Year | Revenue | 2019 dollar equivalent |
|---|---|---|
| 1941 | $3.4 billion | $59.2 billion |
| 1942 | $8.0 billion | $123.8 billion |
1943 – Current Tax Payment Act
It becomes mandatory for employers to withhold taxes from employees’ wages and remit them four times per year.
Modern Times: 1961 to 2018
1961 – Beginning of The Computer Age
The National Computer Center at Martinsburg, West Virginia is formally dedicated to assisting the IRS in its shift to computer data processing.
1986 – Tax Reform Act
The Tax Reform Act:
- Lowers the top individual tax rate from 50% to 28%
- Increases taxes on capital gains from 20% to 28%
- Reduces corporate tax breaks
The revisions are designed to make the tax code simpler and fairer.
1992 – Electronic Filing
Taxpayers who owe money are given the option to file electronically.
2001 – Economic Growth and Tax Relief Reconciliation Act
President George W. Bush implements large tax cuts:
- Creates a new lowest individual tax rate of 10%
- Reduces the top individual tax rate from 39.6% to 35%
- Doubles child tax credit from $500 to $1,000* (*From $700 to $1,400 in 2019 dollars)
2017 – Tax Cuts and Jobs Act
President Trump signs off on reductions in tax rates, while some deductions are made more restrictive.
For example, State and Local Taxes (SALT) deductions are capped at $10,000. Residents in high-tax states such as New York, New Jersey, California and Connecticut could see substantially higher tax bills.
The Future
U.S. taxation policy remains a contentious issue and shifts depending on who is in the White House.
Investors need to stay informed on current legislation, so they can engage in proactive financial planning and minimize their tax obligations.


Money
Charted: Which City Has the Most Billionaires in 2024?
Just two countries account for half of the top 20 cities with the most billionaires. And the majority of the other half are found in Asia.


Charted: Which Country Has the Most Billionaires in 2024?
This was originally posted on our Voronoi app. Download the app for free on iOS or Android and discover incredible data-driven charts from a variety of trusted sources.
Some cities seem to attract the rich. Take New York City for example, which has 340,000 high-net-worth residents with investable assets of more than $1 million.
But there’s a vast difference between being a millionaire and a billionaire. So where do the richest of them all live?
Using data from the Hurun Global Rich List 2024, we rank the top 20 cities with the highest number of billionaires in 2024.
A caveat to these rich lists: sources often vary on figures and exact rankings. For example, in last year’s reports, Forbes had New York as the city with the most billionaires, while the Hurun Global Rich List placed Beijing at the top spot.
Ranked: Top 20 Cities with the Most Billionaires in 2024
The Chinese economy’s doldrums over the course of the past year have affected its ultra-wealthy residents in key cities.
Beijing, the city with the most billionaires in 2023, has not only ceded its spot to New York, but has dropped to #4, overtaken by London and Mumbai.
| Rank | City | Billionaires | Rank Change YoY |
|---|---|---|---|
| 1 | 🇺🇸 New York | 119 | +1 |
| 2 | 🇬🇧 London | 97 | +3 |
| 3 | 🇮🇳 Mumbai | 92 | +4 |
| 4 | 🇨🇳 Beijing | 91 | -3 |
| 5 | 🇨🇳 Shanghai | 87 | -2 |
| 6 | 🇨🇳 Shenzhen | 84 | -2 |
| 7 | 🇭🇰 Hong Kong | 65 | -1 |
| 8 | 🇷🇺 Moscow | 59 | No Change |
| 9 | 🇮🇳 New Delhi | 57 | +6 |
| 10 | 🇺🇸 San Francisco | 52 | No Change |
| 11 | 🇹🇭 Bangkok | 49 | +2 |
| 12 | 🇹🇼 Taipei | 45 | +2 |
| 13 | 🇫🇷 Paris | 44 | -2 |
| 14 | 🇨🇳 Hangzhou | 43 | -5 |
| 15 | 🇸🇬 Singapore | 42 | New to Top 20 |
| 16 | 🇨🇳 Guangzhou | 39 | -4 |
| 17T | 🇮🇩 Jakarta | 37 | +1 |
| 17T | 🇧🇷 Sao Paulo | 37 | No Change |
| 19T | 🇺🇸 Los Angeles | 31 | No Change |
| 19T | 🇰🇷 Seoul | 31 | -3 |
In fact all Chinese cities on the top 20 list have lost billionaires between 2023–24. Consequently, they’ve all lost ranking spots as well, with Hangzhou seeing the biggest slide (-5) in the top 20.
Where China lost, all other Asian cities—except Seoul—in the top 20 have gained ranks. Indian cities lead the way, with New Delhi (+6) and Mumbai (+3) having climbed the most.
At a country level, China and the U.S combine to make up half of the cities in the top 20. They are also home to about half of the world’s 3,200 billionaire population.
In other news of note: Hurun officially counts Taylor Swift as a billionaire, estimating her net worth at $1.2 billion.

-

 Misc1 week ago
How Hard Is It to Get Into an Ivy League School?
-

 Technology2 weeks ago
Ranked: Semiconductor Companies by Industry Revenue Share
-

 Markets2 weeks ago
Ranked: The World’s Top Flight Routes, by Revenue
-

 Demographics2 weeks ago
Population Projections: The World’s 6 Largest Countries in 2075
-

 Markets2 weeks ago
The Top 10 States by Real GDP Growth in 2023
-

 Demographics2 weeks ago
The Smallest Gender Wage Gaps in OECD Countries
-

 United States2 weeks ago
Where U.S. Inflation Hit the Hardest in March 2024
-

 Green2 weeks ago
Top Countries By Forest Growth Since 2001