Agriculture
The Most Valuable Agricultural Commodity in Each State
The Most Valuable Agricultural Commodity in Each State
The United States has an incredible amount of geographic diversity.
From the fertile farmland of the Great Plains to the volcanic islands in the Hawaiian archipelago, each state has been dealt a unique geographical hand.
Each geographical setting can be the source of economic opportunities, such as tourism or the development of natural resources. It also partially dictates what kind of agricultural choices are available for farmers and local economies.
A Higher Level Look
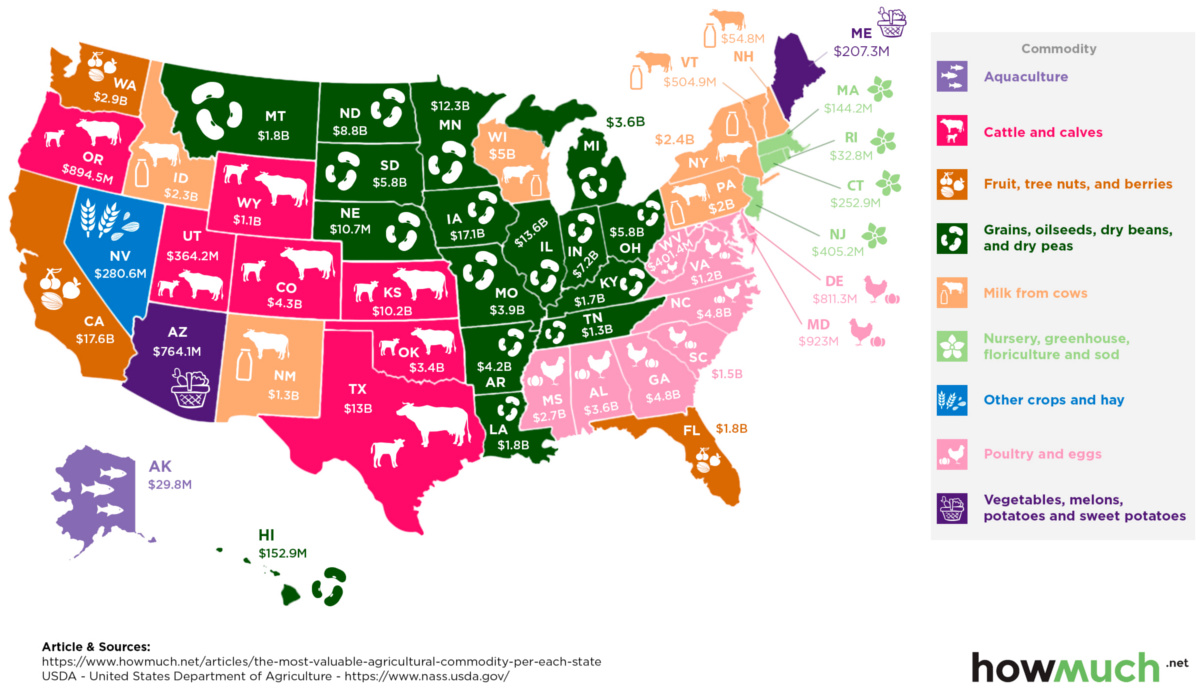
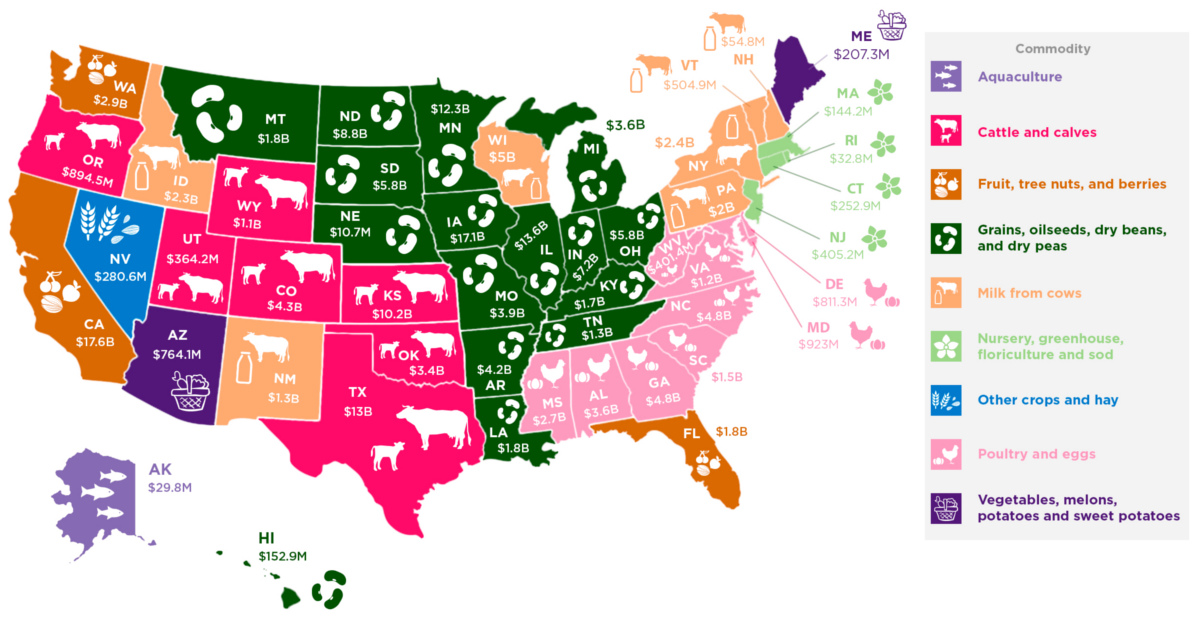
Today’s infographic comes to us from HowMuch.net, and it color codes each state based on the most valuable agricultural commodity it produces, based on data from the U.S. Department of Agriculture.
At a big picture level, how does the country break down?
| Most Valuable Agricultural Commodity | Number of States |
|---|---|
| Grains, oilseeds, dry beans, and dry peas | 16 |
| Poultry and eggs | 9 |
| Cattle and calves | 7 |
| Milk from cows | 7 |
| Nursery, greenhouse, floriculture and sod | 4 |
| Fruit, tree nuts, and berries | 3 |
| Vegetables, melons, potatoes and sweet potatoes | 2 |
| Aquaculture | 1 |
| Other crops and hay | 1 |
Broadly speaking, the category of “Grains, oilseeds, dry beans, and dry peas” is the most valuable agricultural commodity in 16 states, while aquaculture was the most important in only one state, which is Alaska.
It’s interesting that there are niches that end up deriving massive amounts of value in only a few states. For example, the category of “Fruit, tree nuts, and berries” is the biggest in just three states, but California makes $17.6 billion from it every year – more than the size of the entire agricultural sector of some states.
State by State Data
Finally, here’s a look at the data for each state in a sortable table:
| Rank | State | Agricultural Commodity | Value |
|---|---|---|---|
| #1 | California | Fruit, tree nuts, and berries | $17,638,972,000 |
| #2 | Iowa | Grains, oilseeds, dry beans, and dry peas | $17,146,679,000 |
| #3 | Illinois | Grains, oilseeds, dry beans, and dry peas | $13,589,230,000 |
| #4 | Texas | Cattle and calves | $13,013,127,000 |
| #5 | Minnesota | Grains, oilseeds, dry beans, and dry peas | $12,304,415,000 |
| #6 | Nebraska | Grains, oilseeds, dry beans, and dry peas | $10,698,861,000 |
| #7 | Kansas | Cattle and calves | $10,153,087,000 |
| #8 | North Dakota | Grains, oilseeds, dry beans, and dry peas | $8,813,348,000 |
| #9 | Indiana | Grains, oilseeds, dry beans, and dry peas | $7,217,854,000 |
| #10 | Ohio | Grains, oilseeds, dry beans, and dry peas | $5,834,600,000 |
| #11 | South Dakota | Grains, oilseeds, dry beans, and dry peas | $5,809,792,000 |
| #12 | Wisconsin | Milk from cows | $4,952,039,000 |
| #13 | North Carolina | Poultry and eggs | $4,837,026,000 |
| #14 | Georgia | Poultry and eggs | $4,773,837,000 |
| #15 | Colorado | Cattle and calves | $4,321,308,000 |
| #16 | Arkansas | Grains, oilseeds, dry beans, and dry peas | $4,214,355,000 |
| #17 | Missouri | Grains, oilseeds, dry beans, and dry peas | $3,922,873,000 |
| #18 | Alabama | Poultry and eggs | $3,624,852,000 |
| #19 | Michigan | Grains, oilseeds, dry beans, and dry peas | $3,613,250,000 |
| #20 | Oklahoma | Cattle and calves | $3,402,919,000 |
| #21 | Washington | Fruit, tree nuts, and berries | $2,931,370,000 |
| #22 | Mississippi | Poultry and eggs | $2,744,048,000 |
| #23 | New York | Milk from cows | $2,417,398,000 |
| #24 | Idaho | Milk from cows | $2,333,364,000 |
| #25 | Pennsylvania | Milk from cows | $1,966,892,000 |
| #26 | Florida | Fruit, tree nuts, and berries | $1,847,805,000 |
| #27 | Louisiana | Grains, oilseeds, dry beans, and dry peas | $1,832,208,000 |
| #28 | Montana | Grains, oilseeds, dry beans, and dry peas | $1,787,162,000 |
| #29 | Kentucky | Grains, oilseeds, dry beans, and dry peas | $1,656,983,000 |
| #30 | South Carolina | Poultry and eggs | $1,476,817,000 |
| #31 | Tennessee | Grains, oilseeds, dry beans, and dry peas | $1,301,303,000 |
| #32 | New Mexico | Milk from cows | $1,251,065,000 |
| #33 | Virginia | Poultry and eggs | $1,161,564,000 |
| #34 | Wyoming | Cattle and calves | $1,101,195,000 |
| #35 | Maryland | Poultry and eggs | $922,999,000 |
| #36 | Oregon | Cattle and calves | $894,485,000 |
| #37 | Delaware | Poultry and eggs | $811,301,000 |
| #38 | Arizona | Vegetables, melons, potatoes and sweet potatoes | $764,062,000 |
| #39 | Vermont | Milk from cows | $504,884,000 |
| #40 | New Jersey | Nursery, greenhouse, floriculture and sod | $405,247,000 |
| #41 | West Virginia | Poultry and eggs | $401,439,000 |
| #42 | Utah | Cattle and calves | $364,214,000 |
| #43 | Nevada | Other crops and hay | $280,554,000 |
| #44 | Connecticut | Nursery, greenhouse, floriculture and sod | $252,923,000 |
| #45 | Maine | Vegetables, melons, potatoes and sweet potatoes | $207,254,000 |
| #46 | Hawaii | Grains, oilseeds, dry beans, and dry peas | $152,930,000 |
| #47 | Massachusetts | Nursery, greenhouse, floriculture and sod | $144,188,000 |
| #48 | New Hampshire | Milk from cows | $54,798,000 |
| #49 | Rhode Island | Nursery, greenhouse, floriculture and sod | $32,831,000 |
| #50 | Alaska | Aquaculture | $29,774,000 |
As the legal cannabis industry continues to take off, it’ll be interesting to see if the USDA incorporates that crop into its rankings in future years.


Agriculture
The World’s Top Cocoa Producing Countries
Here are the largest cocoa producing countries globally—from Côte d’Ivoire to Brazil—as cocoa prices hit record highs.
The World’s Top Cocoa Producing Countries
This was originally posted on our Voronoi app. Download the app for free on iOS or Android and discover incredible data-driven charts from a variety of trusted sources.
West Africa is home to the largest cocoa producing countries worldwide, with 3.9 million tonnes of production in 2022.
In fact, there are about one million farmers in Côte d’Ivoire supplying cocoa to key customers such as Nestlé, Mars, and Hershey. But the massive influence of this industry has led to significant forest loss to plant cocoa trees.
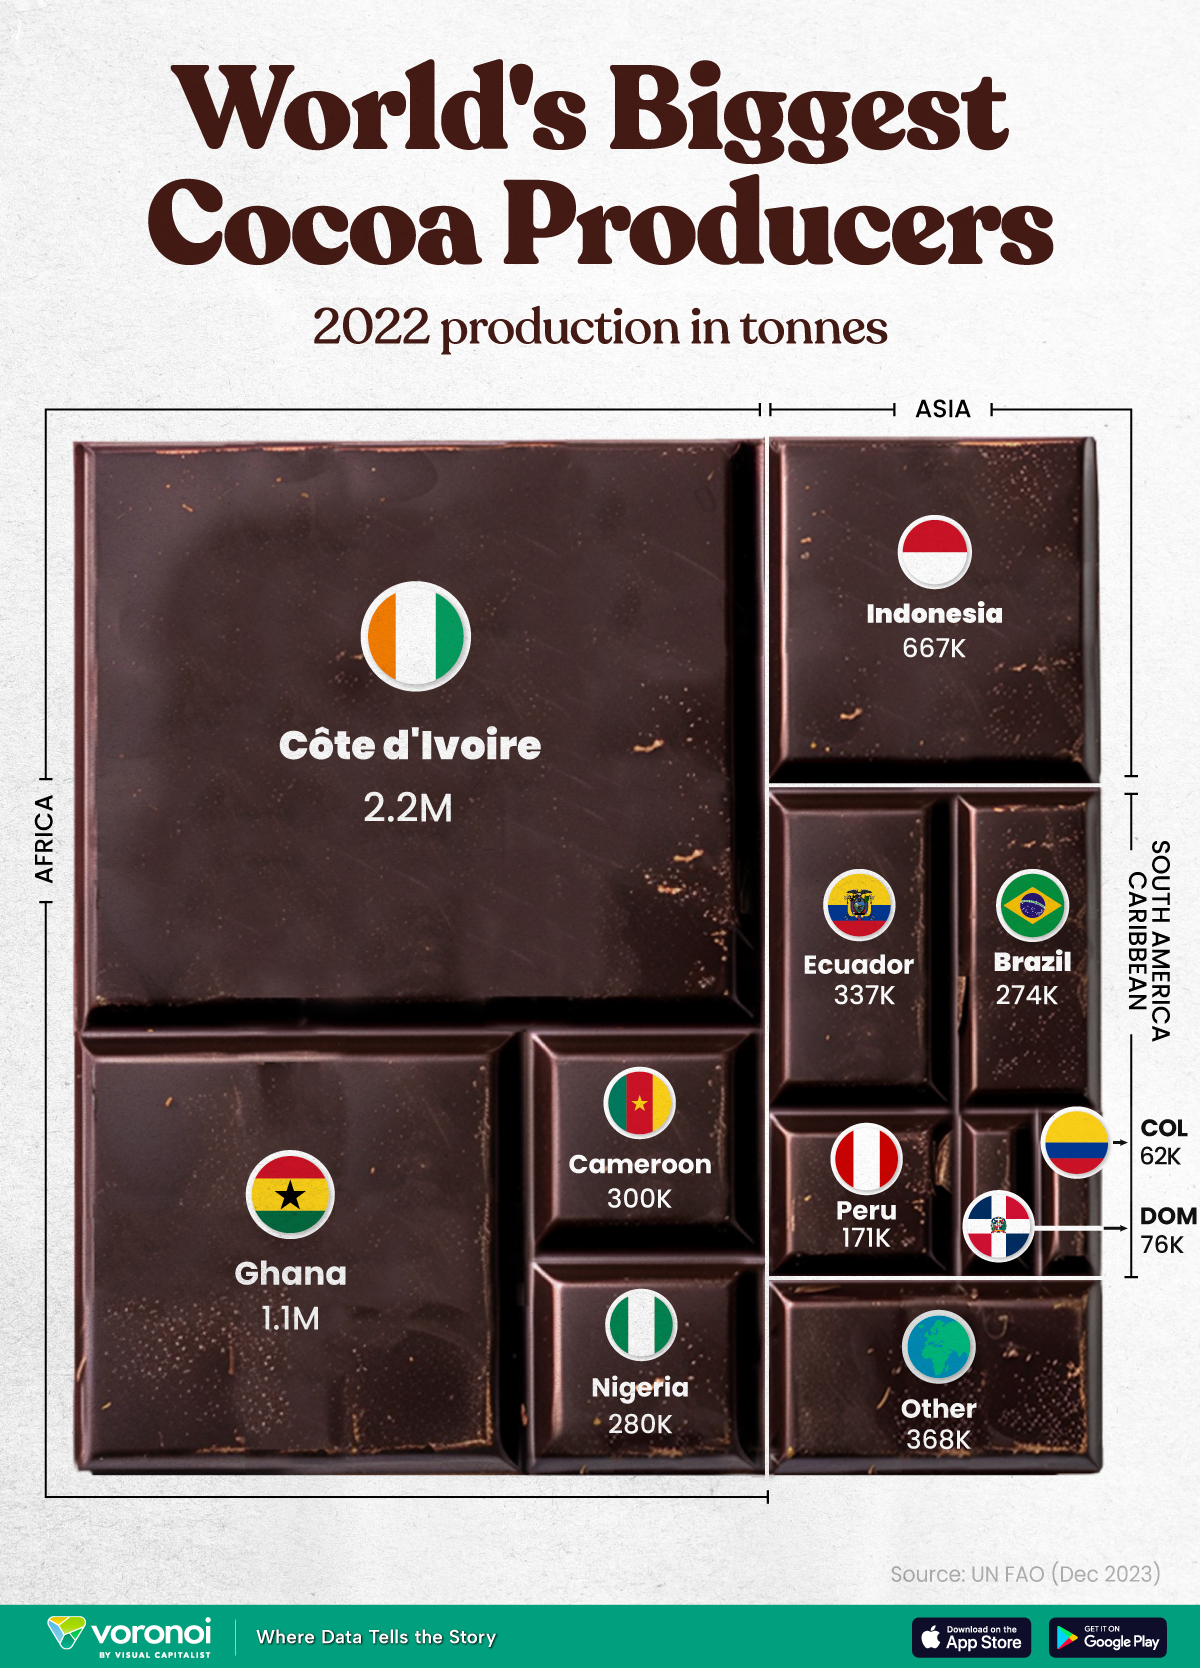
This graphic shows the leading producers of cocoa, based on data from the UN FAO.
Global Hotspots for Cocoa Production
Below, we break down the top cocoa producing countries as of 2022:
| Country | 2022 Production, Tonnes |
|---|---|
| 🇨🇮 Côte d'Ivoire | 2.2M |
| 🇬🇭 Ghana | 1.1M |
| 🇮🇩 Indonesia | 667K |
| 🇪🇨 Ecuador | 337K |
| 🇨🇲 Cameroon | 300K |
| 🇳🇬 Nigeria | 280K |
| 🇧🇷 Brazil | 274K |
| 🇵🇪 Peru | 171K |
| 🇩🇴 Dominican Republic | 76K |
| 🌍 Other | 386K |
With 2.2 million tonnes of cocoa in 2022, Côte d’Ivoire is the world’s largest producer, accounting for a third of the global total.
For many reasons, the cocoa trade in Côte d’Ivoire and Western Africa has been controversial. Often, farmers make about 5% of the retail price of a chocolate bar, and earn $1.20 each day. Adding to this, roughly a third of cocoa farms operate on forests that are meant to be protected.
As the third largest producer, Indonesia produced 667,000 tonnes of cocoa with the U.S., Malaysia, and Singapore as major importers. Overall, small-scale farmers produce 95% of cocoa in the country, but face several challenges such as low pay and unwanted impacts from climate change. Alongside aging trees in the country, these setbacks have led productivity to decline.
In South America, major producers include Ecuador and Brazil. In the early 1900s, Ecuador was the world’s largest cocoa producing country, however shifts in the global marketplace and crop disease led its position to fall. Today, the country is most known for its high-grade single-origin chocolate, with farms seen across the Amazon rainforest.
Altogether, global cocoa production reached 6.5 million tonnes, supported by strong demand. On average, the market has grown 3% annually over the last several decades.

-

 Debt1 week ago
How Debt-to-GDP Ratios Have Changed Since 2000
-

 Demographics2 weeks ago
Population Projections: The World’s 6 Largest Countries in 2075
-

 Markets2 weeks ago
The Top 10 States by Real GDP Growth in 2023
-

 Demographics2 weeks ago
The Smallest Gender Wage Gaps in OECD Countries
-

 Economy2 weeks ago
Where U.S. Inflation Hit the Hardest in March 2024
-

 Green2 weeks ago
Top Countries By Forest Growth Since 2001
-

 United States2 weeks ago
Ranked: The Largest U.S. Corporations by Number of Employees
-

 Maps2 weeks ago
The Largest Earthquakes in the New York Area (1970-2024)