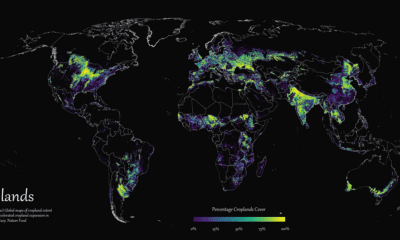

Where are the world's croplands located? This detailed map highlights the world’s cropland cover as of 2019.


Which foods are linked with high CO2 emissions and high water use? We look at the environmental impacts of food production in this chart.
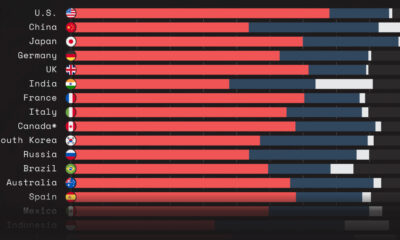

This graphic shows GDP by country, broken down into three main sectors: services, industry, and agriculture.
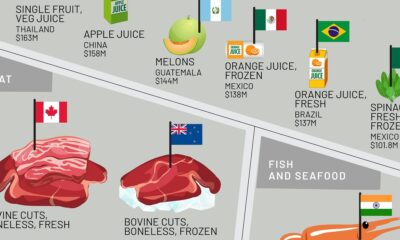

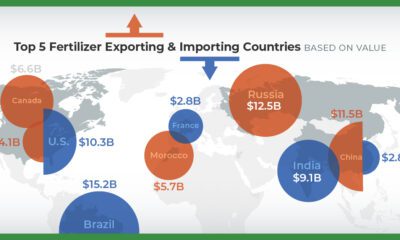
This infographic shows the top exporting countries for U.S. food imports, ranging from exotic fruits to meat, oils, spices, and more.
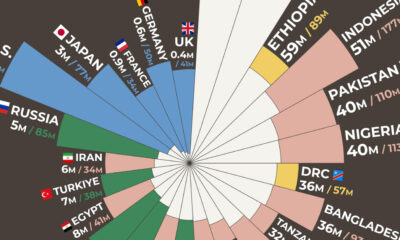

Agricultural workers make up an estimated 27% of the global workforce. How many work in the world's most populated countries?
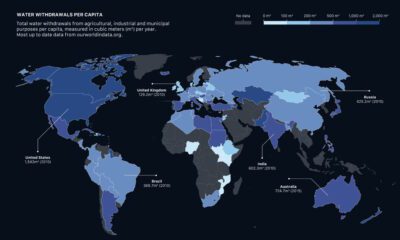

How much water do we have, and which countries use the most? This visual breaks down global water distribution and withdrawals by countries.
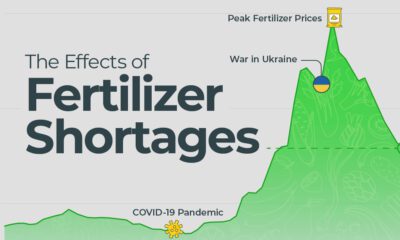

Supply shortages of fertilizer are causing a complex dynamic that could trigger a domino effect of consequences for food security.
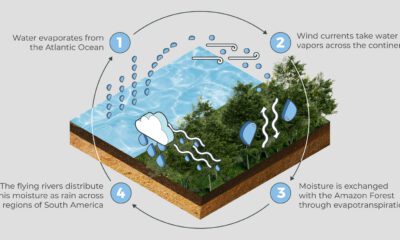

The Amazon rainforest plays a critical role in supporting crop growth by stabilizing the climate and balancing water cycles.

What factors are impacting the fertilizer market in 2023? Here are four trends driving global fertilizer demand.
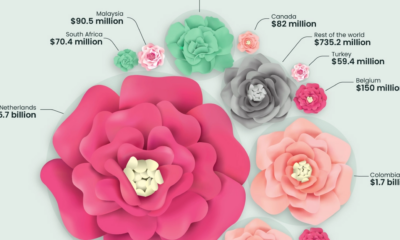

This graphic highlights global flower bouquet sales in 2021 and how a few countries dominate the entire flower export market.


 Creator Program