Environment
Visualizing the Global Population by Water Security Levels


Visualizing the Global Population by Water Security Levels
Most of the world’s population today lives in countries facing critical water security issues.
Dealing with issues such as declining freshwater availability, demand from growing populations, insufficient infrastructure, or flawed water governance can impact how easily a country’s population can access water. A combination of multiple factors quickly makes problems with water security a lived reality.
A recent Global Water Security Report by the United Nations University assessed the water security of different countries across the world.
Methodology
This study assesses water security in countries by examining 10 different underlying components, ranging from water quality and sanitation to availability, resource stability, and climate-related risks.
Each component is given a score out of 10, with a nation’s overall water security score calculated from the sum. Water security levels are assigned based on the overall scores:
- 75 and above is classified as “water secure”
- 65‒74 is classified as “moderately secure”
- 41‒64 indicates a country is “water insecure”
- 40 and below is considered “critically insecure”
Water Security Levels by Country
Water security remains a concern around the world, but is especially dire in regions like the Middle East and Africa, where 13 of the 23 nations in the critically insecure category are located.
In total, 113 countries are considered water insecure, including the world’s two most populated, India and China. An additional 24 countries are considered critically water insecure, with the largest by population including Pakistan and Ethiopia
| Country | Water Security Score | Assessed Level |
|---|---|---|
| 🇦🇫 Afghanistan | 32 | Critical |
| 🇦🇱 Albania | 60 | Insecure |
| 🇩🇿 Algeria | 58 | Insecure |
| 🇦🇴 Angola | 53 | Insecure |
| 🇦🇬 Antigua and Barbuda | 56 | Insecure |
| 🇦🇷 Argentina | 56 | Insecure |
| 🇦🇲 Armenia | 60 | Insecure |
| 🇦🇺 Australia | 78 | Secure |
| 🇦🇹 Austria | 85 | Secure |
| 🇦🇿 Azerbaijan | 60 | Insecure |
| 🇧🇸 Bahamas | 48 | Insecure |
| 🇧🇭 Bahrain | 67 | Moderate |
| 🇧🇩 Bangladesh | 51 | Insecure |
| 🇧🇧 Barbados | 44 | Insecure |
| 🇧🇾 Belarus | 68 | Moderate |
| 🇧🇪 Belgium | 71 | Moderate |
| 🇧🇿 Belize | 54 | Insecure |
| 🇧🇯 Benin | 47 | Insecure |
| 🇧🇹 Bhutan | 56 | Insecure |
| 🇧🇴 Bolivia | 55 | Insecure |
| 🇧🇦 Bosnia and Herzegovina | 62 | Insecure |
| 🇧🇼 Botswana | 55 | Insecure |
| 🇧🇷 Brazil | 69 | Moderate |
| 🇧🇳 Brunei Darussalam | 52 | Insecure |
| 🇧🇬 Bulgaria | 67 | Moderate |
| 🇧🇫 Burkina Faso | 49 | Insecure |
| 🇧🇮 Burundi | 45 | Insecure |
| 🇨🇻 Cabo Verde | 54 | Insecure |
| 🇰🇭 Cambodia | 46 | Insecure |
| 🇨🇲 Cameroon | 47 | Insecure |
| 🇨🇦 Canada | 75 | Secure |
| 🇨🇫 Central African Republic | 43 | Insecure |
| 🇹🇩 Chad | 39 | Critical |
| 🇨🇱 Chile | 67 | Moderate |
| 🇨🇳 China | 64 | Insecure |
| 🇨🇴 Colombia | 62 | Insecure |
| 🇰🇲 Comoros | 40 | Critical |
| 🇨🇬 Congo, Rep. | 58 | Insecure |
| 🇨🇷 Costa Rica | 69 | Moderate |
| 🇨🇮 Côte d'Ivoire | 51 | Insecure |
| 🇭🇷 Croatia | 75 | Secure |
| 🇨🇺 Cuba | 56 | Insecure |
| 🇨🇾 Cyprus | 80 | Secure |
| 🇨🇿 Czech Republic | 75 | Secure |
| 🇰🇵 Democratic Republic of Korea | 59 | Insecure |
| 🇨🇩 Democratic Republic of Congo | 50 | Insecure |
| 🇩🇰 Denmark | 85 | Secure |
| 🇩🇯 Djibouti | 32 | Critical |
| 🇩🇲 Dominica | 41 | Insecure |
| 🇩🇴 Dominican Republic | 46 | Insecure |
| 🇪🇨 Ecuador | 61 | Insecure |
| 🇪🇬 Egypt | 45 | Insecure |
| 🇸🇻 El Salvador | 58 | Insecure |
| 🇬🇶 Equatorial Guinea | 47 | Insecure |
| 🇪🇷 Eritrea | 29 | Critical |
| 🇪🇪 Estonia | 78 | Secure |
| 🇸🇿 Eswatini | 41 | Insecure |
| 🇪🇹 Ethiopia | 31 | Critical |
| 🇫🇯 Fiji | 57 | Insecure |
| 🇫🇮 Finland | 83 | Secure |
| 🇫🇷 France | 81 | Secure |
| 🇬🇦 Gabon | 52 | Insecure |
| 🇬🇲 Gambia | 50 | Insecure |
| 🇬🇪 Georgia | 63 | Insecure |
| 🇩🇪 Germany | 79 | Secure |
| 🇬🇭 Ghana | 52 | Insecure |
| 🇬🇷 Greece | 80 | Secure |
| 🇬🇩 Grenada | 48 | Insecure |
| 🇬🇹 Guatemala | 55 | Insecure |
| 🇬🇳 Guinea | 46 | Insecure |
| 🇬🇼 Guinea-Bissau | 44 | Insecure |
| 🇬🇾 Guyana | 44 | Insecure |
| 🇭🇹 Haiti | 34 | Critical |
| 🇭🇳 Honduras | 52 | Insecure |
| 🇭🇺 Hungary | 75 | Secure |
| 🇮🇸 Iceland | 83 | Secure |
| 🇮🇳 India | 41 | Insecure |
| 🇮🇩 Indonesia | 51 | Insecure |
| 🇮🇷 Iran, Islamic Rep. | 48 | Insecure |
| 🇮🇶 Iraq | 51 | Insecure |
| 🇮🇪 Ireland | 82 | Secure |
| 🇮🇱 Israel | 75 | Secure |
| 🇮🇹 Italy | 78 | Secure |
| 🇯🇲 Jamaica | 59 | Insecure |
| 🇯🇵 Japan | 77 | Secure |
| 🇯🇴 Jordan | 65 | Moderate |
| 🇰🇿 Kazakhstan | 58 | Insecure |
| 🇰🇪 Kenya | 46 | Insecure |
| 🇰🇼 Kuwait | 75 | Secure |
| 🇰🇬 Kyrgyzstan | 54 | Insecure |
| 🇱🇦 Lao PDR | 56 | Insecure |
| 🇱🇻 Latvia | 78 | Secure |
| 🇱🇧 Lebanon | 59 | Insecure |
| 🇱🇸 Lesotho | 54 | Insecure |
| 🇱🇷 Liberia | 36 | Critical |
| 🇱🇾 Libya | 37 | Critical |
| 🇱🇹 Lithuania | 81 | Secure |
| 🇱🇺 Luxembourg | 85 | Secure |
| 🇲🇬 Madagascar | 37 | Critical |
| 🇲🇼 Malawi | 47 | Insecure |
| 🇲🇾 Malaysia | 75 | Secure |
| 🇲🇻 Maldives | 49 | Insecure |
| 🇲🇱 Mali | 43 | Insecure |
| 🇲🇹 Malta | 62 | Insecure |
| 🇲🇷 Mauritania | 41 | Insecure |
| 🇲🇺 Mauritius | 43 | Insecure |
| 🇲🇽 Mexico | 61 | Insecure |
| 🇫🇲 Micronesia | 38 | Critical |
| 🇲🇳 Mongolia | 60 | Insecure |
| 🇲🇪 Montenegro | 51 | Insecure |
| 🇲🇦 Morocco | 57 | Insecure |
| 🇲🇿 Mozambique | 46 | Insecure |
| 🇲🇲 Myanmar | 50 | Insecure |
| 🇳🇦 Namibia | 51 | Insecure |
| 🇳🇵 Nepal | 48 | Insecure |
| 🇳🇱 Netherlands | 72 | Moderate |
| 🇳🇿 New Zealand | 81 | Secure |
| 🇳🇮 Nicaragua | 54 | Insecure |
| 🇳🇪 Niger | 38 | Critical |
| 🇳🇬 Nigeria | 57 | Insecure |
| 🇲🇰 North Macedonia | 51 | Insecure |
| 🇳🇴 Norway | 84 | Secure |
| 🇴🇲 Oman | 55 | Insecure |
| 🇵🇰 Pakistan | 37 | Critical |
| 🇵🇦 Panama | 61 | Insecure |
| 🇵🇬 Papua New Guinea | 34 | Critical |
| 🇵🇾 Paraguay | 63 | Insecure |
| 🇵🇪 Peru | 55 | Insecure |
| 🇵🇭 Philippines | 58 | Insecure |
| 🇵🇱 Poland | 70 | Moderate |
| 🇵🇹 Portugal | 75 | Secure |
| 🇵🇷 Puerto Rico | 51 | Insecure |
| 🇶🇦 Qatar | 73 | Moderate |
| 🇰🇷 Republic of Korea | 70 | Moderate |
| 🇲🇩 Republic of Moldova | 57 | Insecure |
| 🇷🇴 Romania | 70 | Moderate |
| 🇷🇺 Russian Federation | 73 | Moderate |
| 🇷🇼 Rwanda | 46 | Insecure |
| 🇰🇳 Saint Kitts and Nevis | 36 | Critical |
| 🇱🇨 Saint Lucia | 46 | Insecure |
| 🇻🇨 Saint Vincent and the Grenadines | 42 | Insecure |
| 🇼🇸 Samoa | 50 | Insecure |
| 🇸🇹 Sao Tome and Principe | 50 | Insecure |
| 🇸🇦 Saudi Arabia | 56 | Insecure |
| 🇸🇳 Senegal | 49 | Insecure |
| 🇷🇸 Serbia | 57 | Insecure |
| 🇸🇨 Seychelles | 50 | Insecure |
| 🇸🇱 Sierra Leone | 38 | Critical |
| 🇸🇬 Singapore | 61 | Insecure |
| 🇸🇰 Slovakia | 76 | Secure |
| 🇸🇮 Slovenia | 76 | Secure |
| 🇸🇧 Solomon Islands | 23 | Critical |
| 🇸🇴 Somalia | 35 | Critical |
| 🇿🇦 South Africa | 56 | Insecure |
| 🇸🇸 South Sudan | 37 | Critical |
| 🇪🇸 Spain | 77 | Secure |
| 🇱🇰 Sri Lanka | 40 | Critical |
| 🇵🇸 Palestine | 51 | Insecure |
| 🇸🇩 Sudan | 30 | Critical |
| 🇸🇷 Suriname | 57 | Insecure |
| 🇸🇪 Sweden | 90 | Secure |
| 🇨🇭 Switzerland | 84 | Secure |
| 🇸🇾 Syria Arab Republic | 42 | Insecure |
| 🇹🇯 Tajikistan | 44 | Insecure |
| 🇹🇭 Thailand | 53 | Insecure |
| 🇹🇱 Timor-Leste | 42 | Insecure |
| 🇹🇬 Togo | 49 | Insecure |
| 🇹🇴 Tonga | 43 | Insecure |
| 🇹🇹 Trinidad and Tobago | 54 | Insecure |
| 🇹🇳 Tunisia | 58 | Insecure |
| 🇹🇷 Türkiye | 68 | Moderate |
| 🇹🇲 Turkmenistan | 49 | Insecure |
| 🇺🇬 Uganda | 49 | Insecure |
| 🇺🇦 Ukraine | 62 | Insecure |
| 🇦🇪 United Arab Emirates | 66 | Moderate |
| 🇬🇧 United Kingdom | 79 | Secure |
| 🇹🇿 United Republic of Tanzania | 46 | Insecure |
| 🇺🇸 United States of America | 80 | Secure |
| 🇺🇾 Uruguay | 60 | Insecure |
| 🇺🇿 Uzbekistan | 46 | Insecure |
| 🇻🇺 Vanuatu | 31 | Critical |
| 🇻🇪 Venezuela | 56 | Insecure |
| 🇻🇳 Vietnam | 48 | Insecure |
| 🇾🇪 Yemen | 38 | Critical |
| 🇿🇲 Zambia | 56 | Insecure |
| 🇿🇼 Zimbabwe | 49 | Insecure |
Countries facing water security issues account for 72% of the world’s population, with an additional 8% of the global population facing critical water insecurity.
That includes 4.3 billion people in the Asia-Pacific region alone, and an additional 1.3 billion people across Africa. Many of these countries are grappling with issues including fast-growing populations and drought conditions faster than they can develop the necessary infrastructure to deal with them.
Only 12% of the world’s population lives in water-secure countries, including almost all Western countries, with Norway at the very top of the rankings at an overall score of 90. An additional 8% of the world lives in moderately secure countries such as Brazil and Russia.
However, water availability in these more secure countries is not perfect either. For example, U.S. states reliant on the Colorado River for irrigation and drinking water are facing continued drought conditions and limiting consumption, with further crisis on the horizon.
Towards a Water Secure Future
As nations around the world face increasing water-related challenges, governments and international agencies have been collaborating to foster sustainable water management practices. In fact, clean water and sanitation for all is one of the UN’s Sustainable Development Goals (SDGs).
Many regions have already begun to implement these practices. For example, cities in California have begun recycling wastewater and capturing stormwater to deal with water scarcity. Farming-dependent regions are also looking to smart agriculture to reduce the drain on the limited freshwater resources.
Such initiatives to improve water irrigation systems, enhance water infrastructure, and conserve the depleting freshwater reserves may help elevate countries out of water insecurity and help preserve this precious resource for generations to come.


Green
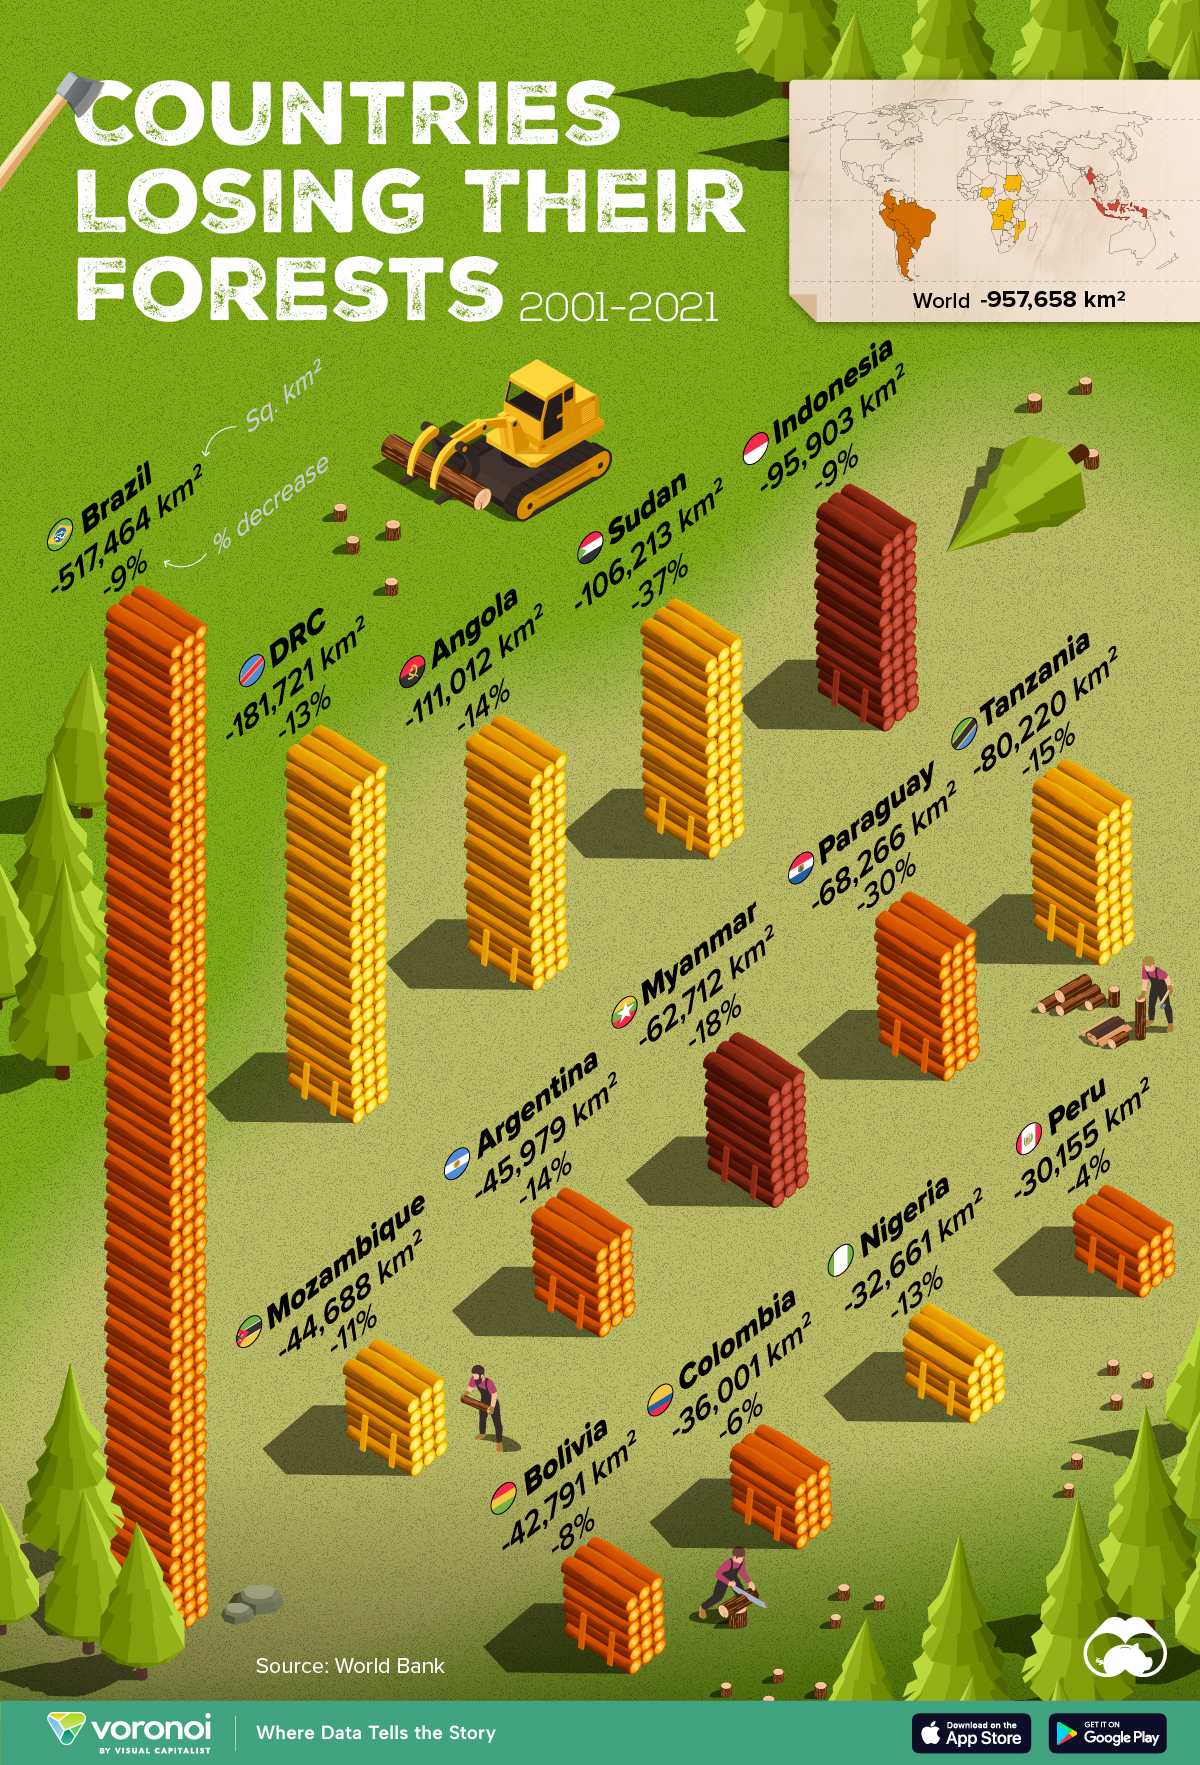
Ranked: Top Countries by Total Forest Loss Since 2001
The country with the most forest loss since 2001 lost as much forest cover as the next four countries combined.
Ranked: Top Countries By Total Forest Loss Since 2001
This was originally posted on our Voronoi app. Download the app for free on iOS or Android and discover incredible data-driven charts from a variety of trusted sources.
Forests are critical natural resources, often caught in the crosshairs of economic development. Thanks to expanding human settlement, agriculture, and industry, the world lost nearly 1 million square kilometers (km²) of forest cover since 2001.
But where has most of this deforestation occurred?
We rank the countries by the total decrease in their forest area between 2001 and 2021, measured in square kilometers along with their percentage decrease for context. All of this data was sourced from the World Bank.
A caveat to this data: countries are ranked by total forest loss, so countries with the largest forests feature predominantly on this list.
Which Country Has Lost the Most Forests (2001-2021)?
Brazil has lost more than half a million square kilometers of forest in the last two decades. Agricultural expansion for beef and soy production alongside mining and infrastructure growth are the primary drivers behind this large scale deforestation.
This has also caused periodic fires in the Amazon rainforest, drawing repeated alarm from around the world. In fact, Brazil has lost as much forest cover as the next four countries combined.
The table below lists the countries included in this graphic, as well as several others further down the ranking.
| Rank | Country | Region | 2001–21 Change (in km2) | % of Forest Loss |
|---|---|---|---|---|
| 1 | 🇧🇷 Brazil | South America | -517,464 | -9% |
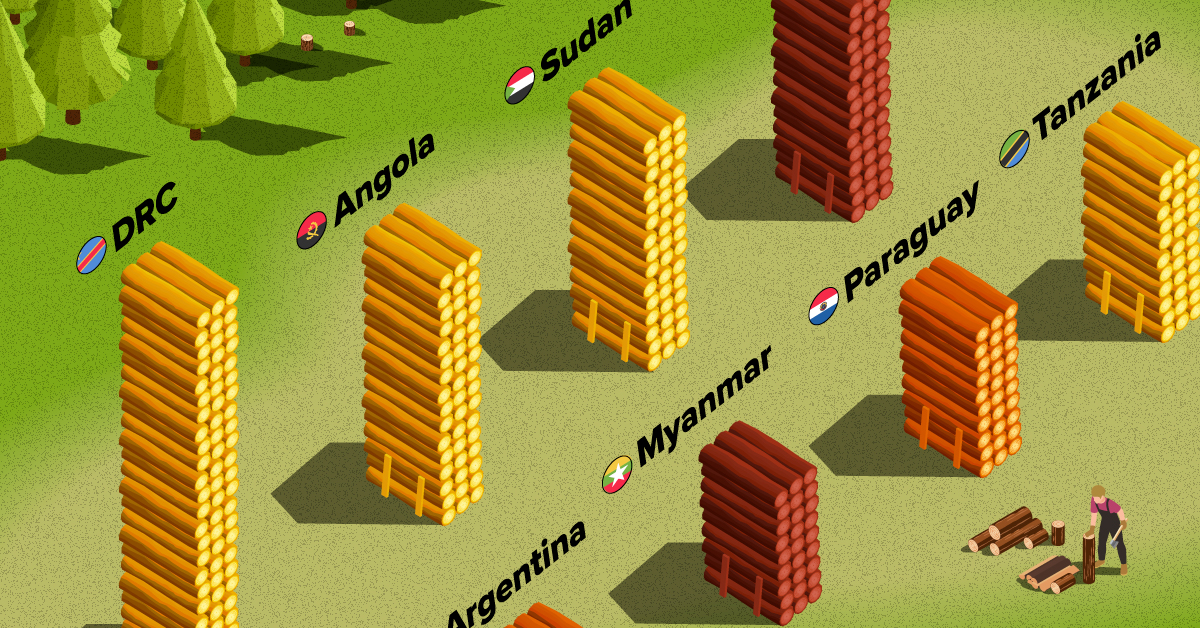
| 2 | 🇨🇩 DRC | Africa | -181,721 | -13% |
| 3 | 🇦🇴 Angola | Africa | -111,012 | -14% |
| 4 | 🇸🇩 Sudan | Africa | -106,213 | -37% |
| 5 | 🇮🇩 Indonesia | Asia | -95,903 | -9% |
| 6 | 🇹🇿 Tanzania | Africa | -80,220 | -15% |
| 7 | 🇵🇾 Paraguay | South America | -68,266 | -30% |
| 8 | 🇲🇲 Myanmar | Asia | -62,712 | -18% |
| 9 | 🇦🇷 Argentina | South America | -45,979 | -14% |
| 10 | 🇲🇿 Mozambique | Africa | -44,688 | -11% |
| 11 | 🇧🇴 Bolivia | South America | -42,791 | -8% |
| 12 | 🇨🇴 Colombia | South America | -36,001 | -6% |
| 13 | 🇳🇬 Nigeria | Africa | -32,661 | -13% |
| 14 | 🇵🇪 Peru | South America | -30,155 | -4% |
| 15 | 🇰🇭 Cambodia | Asia | -28,491 | -26% |
| 16 | 🇻🇪 Venezuela | South America | -28,130 | -6% |
| 17 | 🇲🇽 Mexico | North America | -26,732 | -4% |
| 18 | 🇿🇲 Zambia | Africa | -23,924 | -5% |
| 19 | 🇧🇼 Botswana | Africa | -23,660 | -14% |
| 20 | 🇨🇮 Cote d'Ivoire | Africa | -22,577 | -45% |
What is quickly apparent is how most of the countries on this list are from Africa and South America. A study found a correlation where developing economies tend to have higher deforestation rates than advanced economies. Former colonies have also experienced more forest loss than those that were not colonized.
In Asia, Indonesia’s burgeoning palm oil industry is a key driver to deforestation, though efforts are now being made to reverse its impact. Meanwhile, Cambodia experienced rapid clear-cutting for its growing rubber plantations and timber industry.
Finally, Myanmar has long contended with illegal logging, but the country’s ongoing civil war is styming conversation efforts.

-

 Education1 week ago
How Hard Is It to Get Into an Ivy League School?
-

 Technology2 weeks ago
Ranked: Semiconductor Companies by Industry Revenue Share
-

 Markets2 weeks ago
Ranked: The World’s Top Flight Routes, by Revenue
-

 Demographics2 weeks ago
Population Projections: The World’s 6 Largest Countries in 2075
-

 Markets2 weeks ago
The Top 10 States by Real GDP Growth in 2023
-

 Demographics2 weeks ago
The Smallest Gender Wage Gaps in OECD Countries
-

 Economy2 weeks ago
Where U.S. Inflation Hit the Hardest in March 2024
-

 Green2 weeks ago
Top Countries By Forest Growth Since 2001