Mining
Visualizing the Life Cycle of a Mineral Discovery


Visualizing the Life Cycle of a Mineral Discovery
Mining legend Pierre Lassonde knows a little bit about mineral exploration, discovery, and development. Drawing from decades of his experience, he created the chart above that has become a staple in the mining industry—the Lassonde Curve.
Today’s chart of the Lassonde Curve outlines the life of mining companies from exploration to production, and highlights the work and market value associated with each stage. This helps speculative investors understand the mining process, and time their investments properly.
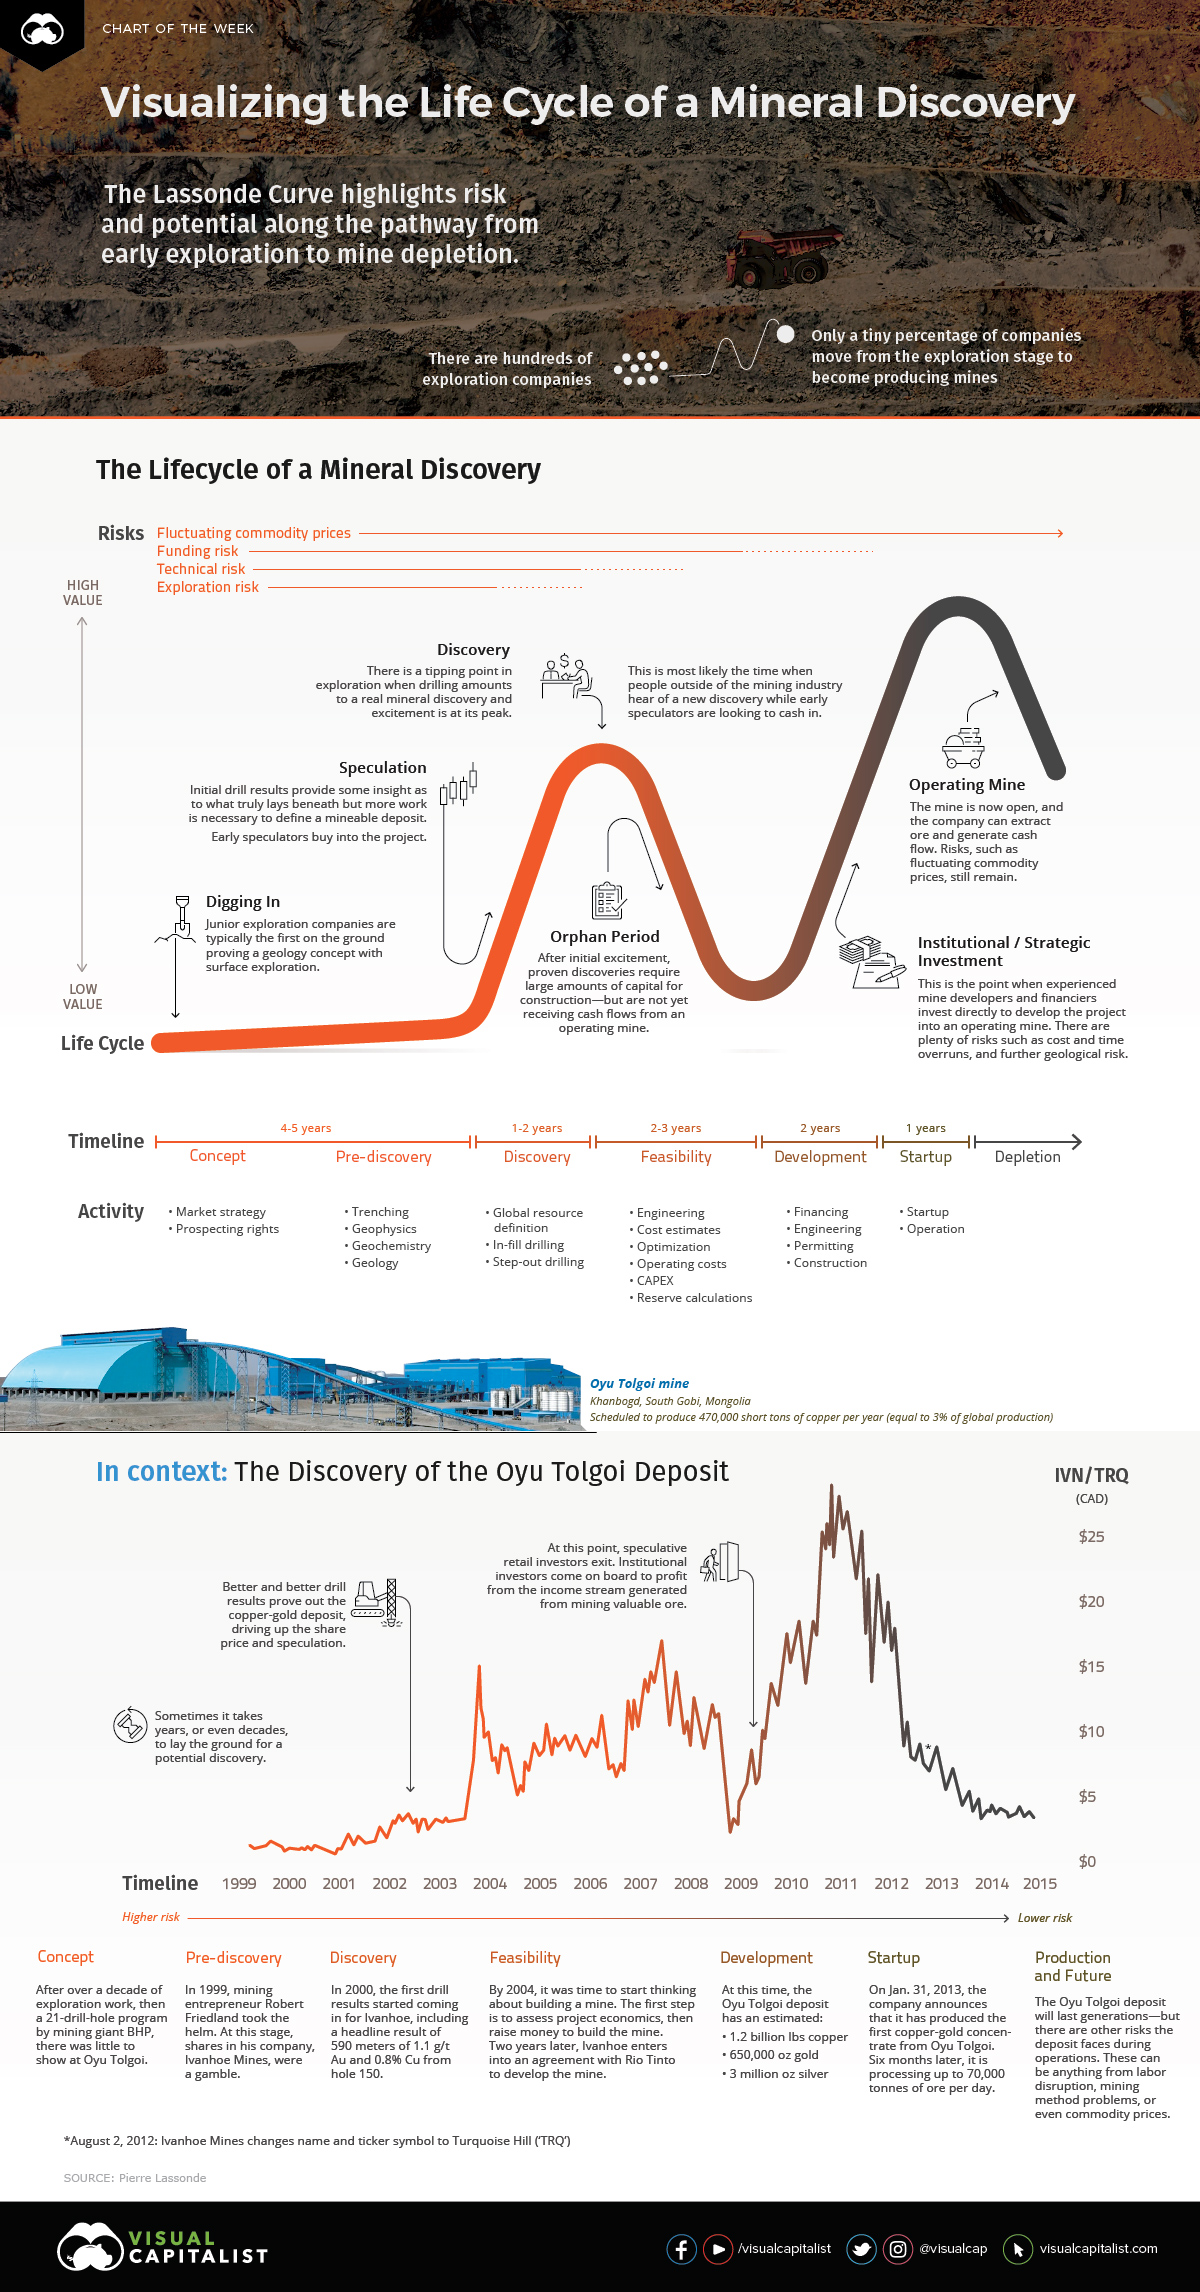
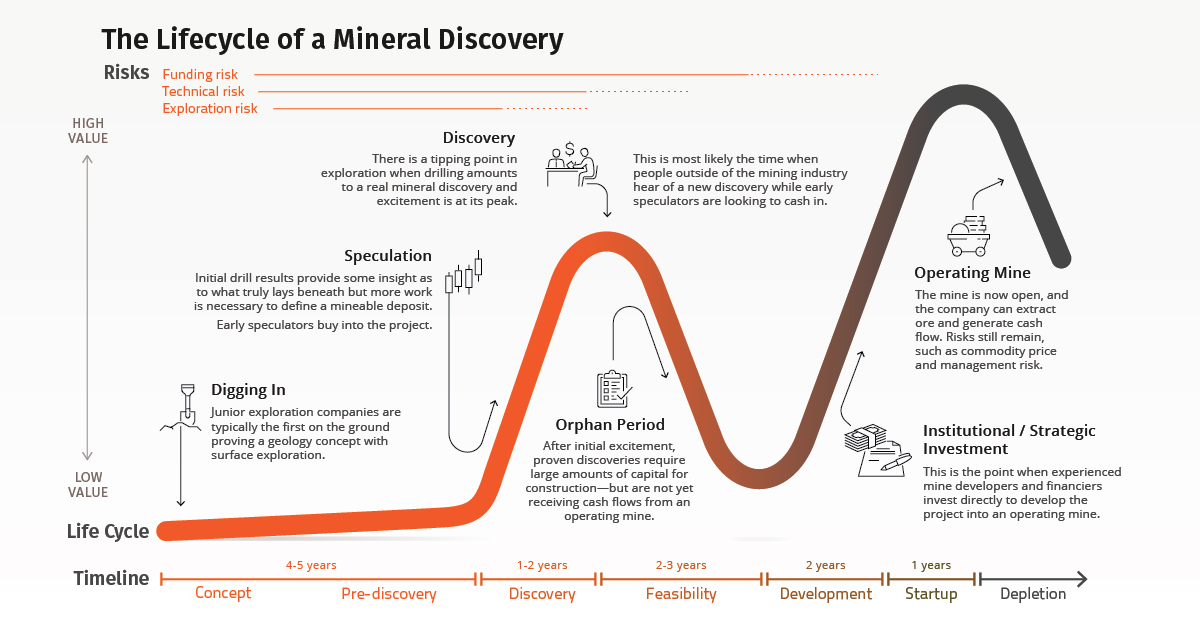
Making Cents of Miners: The Stages of a Mineral Discovery
In the life cycle of a mineral deposit, there are seven stages that each offer specific risks and rewards. As a company proves there is a mineable deposit in the ground, more value is created for shareholders along the way.
- Concept
This stage carries the most risk which accounts for its low value. In the beginning, there is little knowledge of what actually lies beneath the Earth’s surface.
At this stage, geologists are putting to the test a theory about where metal deposits are. They will survey the land using geochemical and sampling techniques to improve the confidence of this theory. Once this is complete, they can move onto more extensive exploration.
- Pre-Discovery
There is still plenty of risk, but this is where speculation hype begins. As the drill bit meets the ground, mineral exploration geologists develop their knowledge of what lies beneath the Earth’s crust to assess mineral potential.
Mineral exploration involves retrieving a cross-section (drill core) of the crust, and then analyzing it for mineral content. A drill core containing sufficient amounts of metals can encourage further exploration, which may lead to the discovery of a mineable deposit.
- Discovery
Discovery is the reward stage for early speculators. Exploration has revealed that there is a significant amount of material to be mined, and it warrants further study to prove that mining would be feasible. Most speculators exit here, as the next stage creates a new set of risks, such as profitability, construction, and financing.
- Feasibility
This is an important milestone for a mineral discovery. Studies conducted during this stage may demonstrate the deposit’s potential to become a profitable mine.
Institutional and strategic investors can then use these studies to evaluate whether they want to advance this project. Speculators often invest during this time, known as the “Orphan Period”, while uncertainty about the project lingers.
- Development
Development is a rare moment, and most mineral deposits never make it to this stage. At this point, the company puts together a production plan for the mine.
First, they must secure funding and build an operational team. If a company can secure funding for development, investors can see the potential of revenue from mining. However, risks still persist in the form of construction, budget, and timelines.
- Startup/Production
Investors who have held their investment until this point can pat themselves on the back—this is a rare moment for a mineral discovery. The company is now processing ore and generating revenue.
Investment analysts will re-rate this deposit, to help it attract more attention from institutional investors and the general public. Meanwhile, existing investors can choose to exit here or wait for potential increases in revenues and dividends.
- Depletion
Nothing lasts forever, especially scarce mineral resources. Unless, there are more deposits nearby, most mines are eventually depleted. With it, so does the value of the company. Investors should be looking for an exit as operations wind down.
Case Study: The Oyu Tolgoi Copper-Gold Discovery, Mongolia
So now that you know the theoretical value cycle of a mineral discovery, how does it pan out in reality? The Oyu Tolgoi copper deposit is one recent discovery that has gone through this value cycle. It exemplifies some of these events and their effects on the share price of a company.
- Concept: 15+ Years
Prospectors conducted early exploration work in the 1980s near where Oyu Tolgoi would be discovered. It was not until 1996 that Australian miner BHP conducted further exploration.
But after 21 drill holes, the company lost interest and optioned the property to mining entrepreneur Robert Friedland and his company Ivanhoe Mines. At this point in 1999, shares in Ivanhoe were a gamble.
- Pre-Discovery/Discovery: ~3 years
Ivanhoe Mines and BHP entered into an earn-in agreement, in which Ivanhoe gained ownership by completing work to explore Oyu Tolgoi. A year later, the first drill results came out of drill hole 150 with a headline result of 508 meters of 1.1 g/t Au and 0.8%. To get a sense of how large this is, imagine the height a 45-story building, of which a third of story is copper. This was just one intersection of an area that could stretch for miles.
Wild speculation began at this stage, as steadily improving drill results proved a massive copper-gold deposit in Mongolia and drove up the share price of Ivanhoe.
- Feasibility/Orphan Period: ~2 years
In 2004, the drilling results contributed to the development of the first scoping study. This study offered a preliminary understanding of the project’s economics.
Using this study, the company needed to secure enough money to build a mine to extract the valuable ore. It was not until two years later, when Ivanhoe Mines entered into an agreement with major mining company Rio Tinto, that a production decision was finalized.
- Development: 7 years
By 2006, the Oyu Tolgoi mineral deposit was in the development phase with the first shaft headframe, hoisting frame, and associated infrastructure completed. It took another two years for the shaft to reach a depth of 1,385 feet.
Further development work delineated a resource of 1.2 billion pounds of copper, 650,000 ounces of gold, and 3 million ounces of silver. This first stage of development for Oyu Tolgoi made Mongolia the world’s fastest growing economy from 2009 to 2011.
- Startup/Production: Ongoing
On January 31, 2013, the company announced it had produced the first copper-gold concentrate from Oyu Tolgoi. Six months later, the company stated that it was processing up to 70,000 tonnes of ore daily.
- Depletion: Into the Future
The Oyu Tolgoi deposit will last generations, so we have yet to see how this will affect the value of the mine from an investment perspective.
It’s also worth noting there are still other risks ahead. These risks can include labor disruptions, mining method problems, or commodity price movement. Investors will have to consider these additional conditions as they pan out.
The More You Know
Mining is one of the riskiest investments with many risks to consider at every stage.
While most mineral discoveries do not match it perfectly, the Lassonde Curve guides an investor through what to expect at each stage, and empowers them to time their investments right.


Lithium
Ranked: The Top 10 EV Battery Manufacturers in 2023
Asia dominates this ranking of the world’s largest EV battery manufacturers in 2023.


The Top 10 EV Battery Manufacturers in 2023
This was originally posted on our Voronoi app. Download the app for free on iOS or Android and discover incredible data-driven charts from a variety of trusted sources.
Despite efforts from the U.S. and EU to secure local domestic supply, all major EV battery manufacturers remain based in Asia.
In this graphic we rank the top 10 EV battery manufacturers by total battery deployment (measured in megawatt-hours) in 2023. The data is from EV Volumes.
Chinese Dominance
Contemporary Amperex Technology Co. Limited (CATL) has swiftly risen in less than a decade to claim the title of the largest global battery group.
The Chinese company now has a 34% share of the market and supplies batteries to a range of made-in-China vehicles, including the Tesla Model Y, SAIC’s MG4/Mulan, and various Li Auto models.
| Company | Country | 2023 Production (megawatt-hour) | Share of Total Production |
|---|---|---|---|
| CATL | 🇨🇳 China | 242,700 | 34% |
| BYD | 🇨🇳 China | 115,917 | 16% |
| LG Energy Solution | 🇰🇷 Korea | 108,487 | 15% |
| Panasonic | 🇯🇵 Japan | 56,560 | 8% |
| SK On | 🇰🇷 Korea | 40,711 | 6% |
| Samsung SDI | 🇰🇷 Korea | 35,703 | 5% |
| CALB | 🇨🇳 China | 23,493 | 3% |
| Farasis Energy | 🇨🇳 China | 16,527 | 2% |
| Envision AESC | 🇨🇳 China | 8,342 | 1% |
| Sunwoda | 🇨🇳 China | 6,979 | 1% |
| Other | - | 56,040 | 8% |
In 2023, BYD surpassed LG Energy Solution to claim second place. This was driven by demand from its own models and growth in third-party deals, including providing batteries for the made-in-Germany Tesla Model Y, Toyota bZ3, Changan UNI-V, Venucia V-Online, as well as several Haval and FAW models.
The top three battery makers (CATL, BYD, LG) collectively account for two-thirds (66%) of total battery deployment.
Once a leader in the EV battery business, Panasonic now holds the fourth position with an 8% market share, down from 9% last year. With its main client, Tesla, now sourcing batteries from multiple suppliers, the Japanese battery maker seems to be losing its competitive edge in the industry.
Overall, the global EV battery market size is projected to grow from $49 billion in 2022 to $98 billion by 2029, according to Fortune Business Insights.

-

 Debt1 week ago
How Debt-to-GDP Ratios Have Changed Since 2000
-

 Markets2 weeks ago
Ranked: The World’s Top Flight Routes, by Revenue
-

 Countries2 weeks ago
Population Projections: The World’s 6 Largest Countries in 2075
-

 Markets2 weeks ago
The Top 10 States by Real GDP Growth in 2023
-

 Demographics2 weeks ago
The Smallest Gender Wage Gaps in OECD Countries
-

 United States2 weeks ago
Where U.S. Inflation Hit the Hardest in March 2024
-

 Green2 weeks ago
Top Countries By Forest Growth Since 2001
-

 United States2 weeks ago
Ranked: The Largest U.S. Corporations by Number of Employees