Mining
The Mineral Exploration Roadmap

Mineral Exploration Roadmap
There is nothing more exciting than making some type of discovery.
Discoveries can come in many forms – they can be physical, scientific, personal, or even philosophical in nature. But while there are different types of discoveries that can be made, perhaps the most tactile kind of discovery is in the field of mineral exploration.
The discovery of a mineral deposit can transform a piece of “moose pasture” into a new economic asset, and it may enable millions or billions of dollars worth of metals and minerals to be used for human purposes.
These minerals get used all around us – they go into our houses, cars, infrastructure, jewelry, electronics, and they can even be used to power the green revolution.
From Prospecting to Production
Making an economic mineral discovery is the goal of many teams around the world, but these efforts can also be extremely difficult, costly, and time-consuming, and most companies engaged in exploration end up walking away empty-handed.
Today’s infographic comes to us from Orix Geoscience and it shows the steps of mineral exploration, and how teams can maximize their odds of success by using data to add value throughout the process.
Steps of the Mineral Exploration Process
1. Exploration Strategy
Where do you choose to explore? There are two basic strategies:
(a) Working from the known
Deposits tend to form in clusters in prolific belts, and exploration occurs outward from known mineralization.
(b) Working from the unknown
If you review all available information, prospective areas with potential for discoveries can be identified.
2. Prospecting
In this stage, boots are now on the ground – and it’s time to explore the backwoods for showings. Prospectors will stake claims, map outcrops and showings, and search for indicator minerals.
The goal of the prospecting stage is to find the earliest piece of the exploration puzzle: the clue that there is something much bigger beneath.
3. Early-Stage Exploration
Congrats, you’ve found something interesting – and now it’s time to ramp up exploration efforts!
This is where the amount of data and sophistication picks up. In this stage, companies are using existing maps and historical data, geophysics, ground truthing, geochemistry, and trenching to try and identify drill targets.
4. The “Truth Machine”
Geologists don’t call the drill a “truth machine” for nothing.
If you’re target hits, you’re in business. If your target misses, it’s time to go back a step and find new ones.
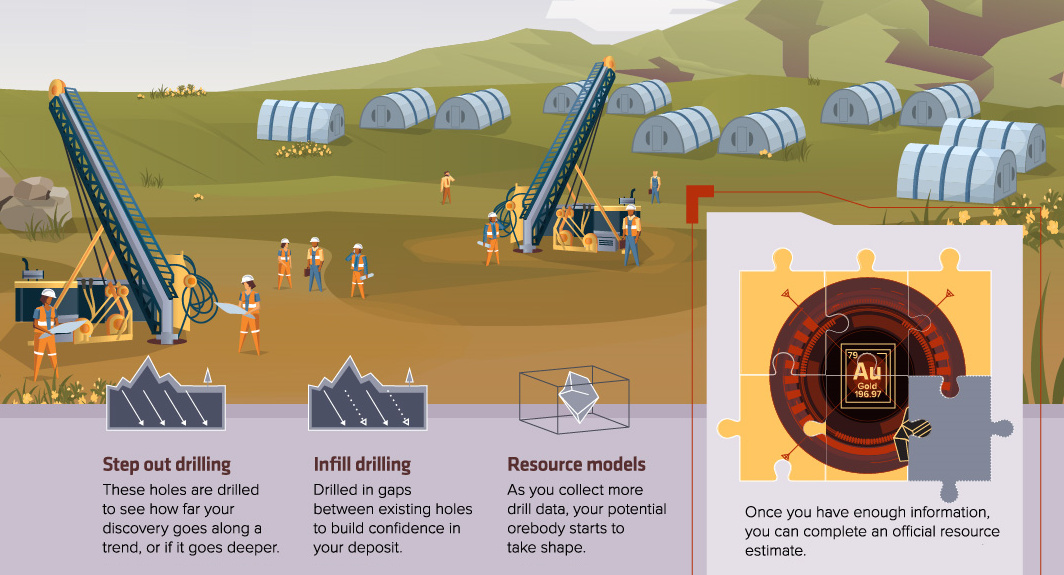
5. Discovery
Eureka! You’ve found something. Now it’s time to see how far the mineralization goes!
Once you have enough information, you can get an official resource estimate. This data is another puzzle piece that will be crucial as you advance your discovery.
6. De-risking
Even at the best of times, mining can be expensive, risky, and tricky.
That’s why your investors and backers will want you to source even more data – it’ll allow you to see a clearer picture of the deposit, and help your team see how it could take shape as a mine.
At this stage, drilling, metallurgical tests, environmental assessments, 3d models, and mine designs are used to increase confidence in the project.
Data starts to get very granular. Your company may do a Preliminary Economic Assessment (PEA) to assess the potential economic outcomes of a mine. Then after, they may conduct an in-depth Feasibility Study to help make a production decision.
Final Steps
By this point, you may have all the puzzle pieces – a clear vision of the deposit and its potential – to make a decision!
If the puzzle looks good, it’s time to make a production decision, construct the mine, and start commercial production. But the data doesn’t stop there – at these later stages, even more data gets created and it can help you make better decisions.


Mining
Charted: The Value Gap Between the Gold Price and Gold Miners
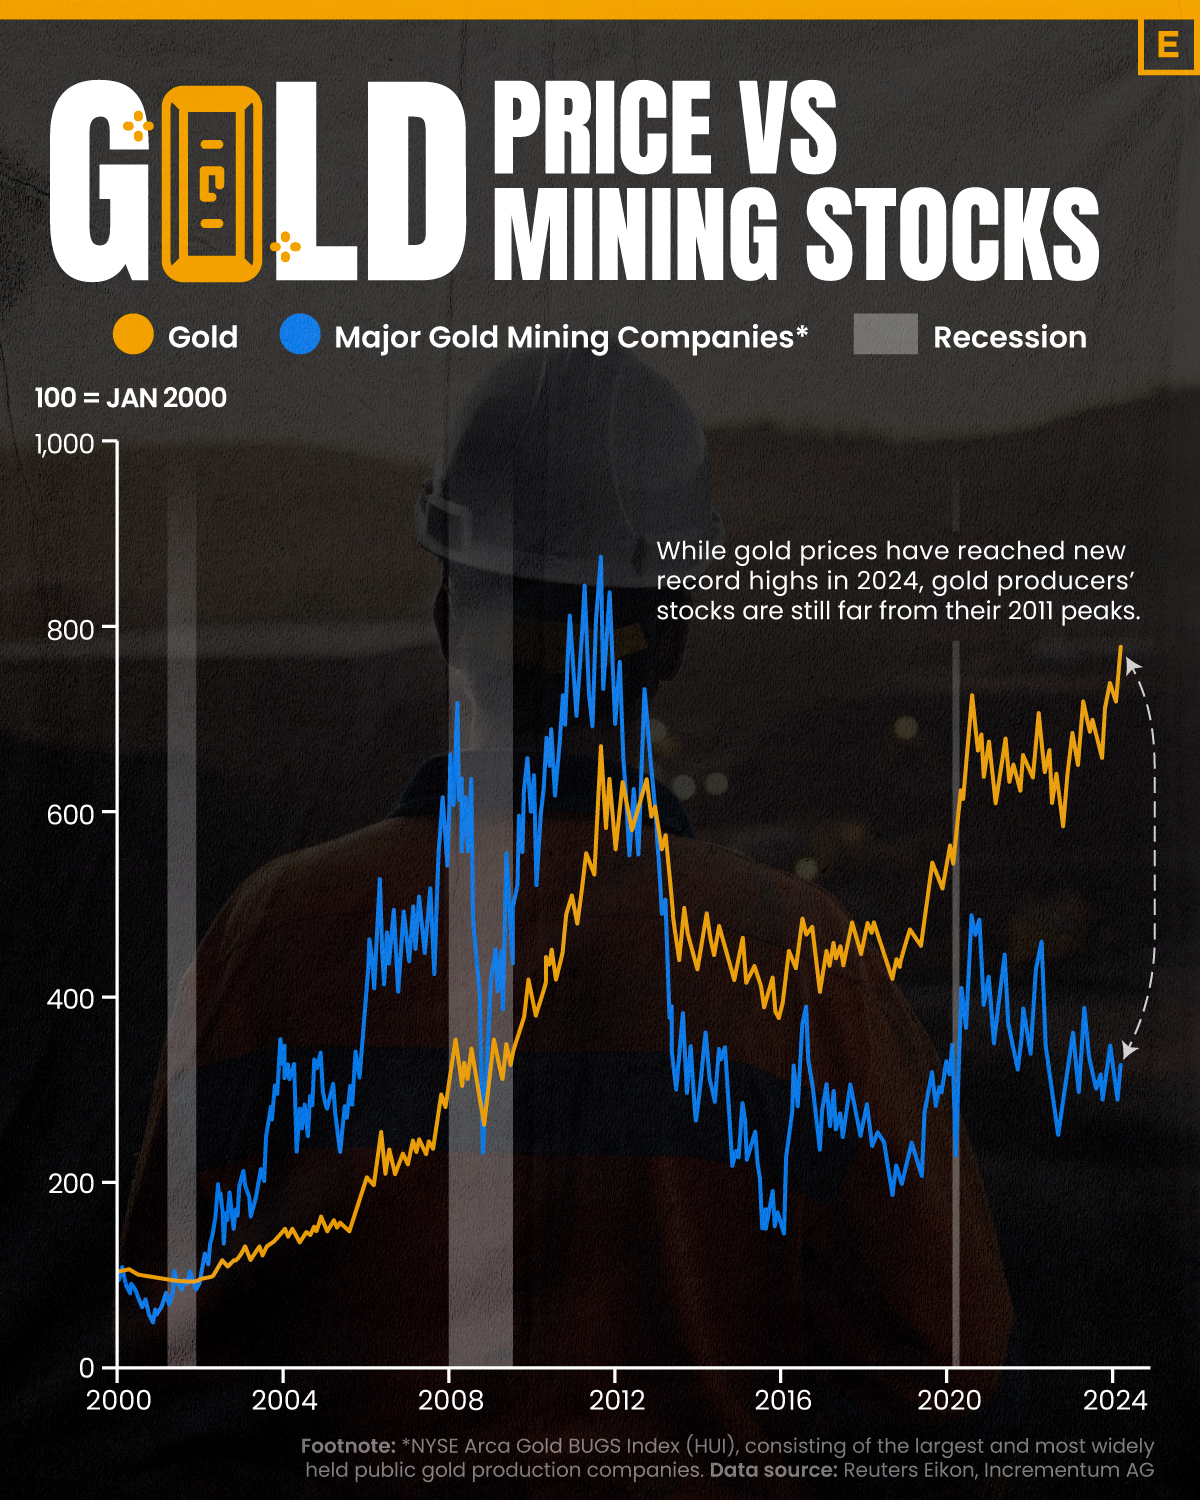
While the price of gold has reached new record highs in 2024, gold mining stocks are still far from their 2011 peaks.
The Value Gap Between the Gold Price and Gold Miners
This was originally posted on our Voronoi app. Download the app for free on Apple or Android and discover incredible data-driven charts from a variety of trusted sources.
Although the price of gold has reached new record highs in 2024, gold miners are still far from their 2011 peaks.
In this graphic, we illustrate the evolution of gold prices since 2000 compared to the NYSE Arca Gold BUGS Index (HUI), which consists of the largest and most widely held public gold production companies. The data was compiled by Incrementum AG.
Mining Stocks Lag Far Behind
In April 2024, gold reached a new record high as Federal Reserve Chair Jerome Powell signaled policymakers may delay interest rate cuts until clearer signs of declining inflation materialize.
Additionally, with elections occurring in more than 60 countries in 2024 and ongoing conflicts in Ukraine and Gaza, central banks are continuing to buy gold to strengthen their reserves, creating momentum for the metal.
Traditionally known as a hedge against inflation and a safe haven during times of political and economic uncertainty, gold has climbed over 11% so far this year.
According to Business Insider, gold miners experienced their best performance in a year in March 2024. During that month, the gold mining sector outperformed all other U.S. industries, surpassing even the performance of semiconductor stocks.
Still, physical gold has outperformed shares of gold-mining companies over the past three years by one of the largest margins in decades.
| Year | Gold Price | NYSE Arca Gold BUGS Index (HUI) |
|---|---|---|
| 2023 | $2,062.92 | $243.31 |
| 2022 | $1,824.32 | $229.75 |
| 2021 | $1,828.60 | $258.87 |
| 2020 | $1,895.10 | $299.64 |
| 2019 | $1,523.00 | $241.94 |
| 2018 | $1,281.65 | $160.58 |
| 2017 | $1,296.50 | $192.31 |
| 2016 | $1,151.70 | $182.31 |
| 2015 | $1,060.20 | $111.18 |
| 2014 | $1,199.25 | $164.03 |
| 2013 | $1,201.50 | $197.70 |
| 2012 | $1,664.00 | $444.22 |
| 2011 | $1,574.50 | $498.73 |
| 2010 | $1,410.25 | $573.32 |
| 2009 | $1,104.00 | $429.91 |
| 2008 | $865.00 | $302.41 |
| 2007 | $836.50 | $409.37 |
| 2006 | $635.70 | $338.24 |
| 2005 | $513.00 | $276.90 |
| 2004 | $438.00 | $215.33 |
| 2003 | $417.25 | $242.93 |
| 2002 | $342.75 | $145.12 |
| 2001 | $276.50 | $65.20 |
| 2000 | $272.65 | $40.97 |
Among the largest companies on the NYSE Arca Gold BUGS Index, Colorado-based Newmont has experienced a 24% drop in its share price over the past year. Similarly, Canadian Barrick Gold also saw a decline of 6.5% over the past 12 months.

-
 Money2 weeks ago
Visualizing the Growth of $100, by Asset Class (1970-2023)
-

 Money1 week ago
Where Does One U.S. Tax Dollar Go?
-

 Green2 weeks ago
Ranked: Top Countries by Total Forest Loss Since 2001
-

 Real Estate2 weeks ago
Visualizing America’s Shortage of Affordable Homes
-

 Maps2 weeks ago
Mapped: Average Wages Across Europe
-

 Mining2 weeks ago
Charted: The Value Gap Between the Gold Price and Gold Miners
-

 Demographics2 weeks ago
Visualizing the Size of the Global Senior Population
-

 Automotive2 weeks ago
Tesla Is Once Again the World’s Best-Selling EV Company