Money
Visualizing the Top Investments Used by Financial Advisors
Subscribe to the Advisor Channel free mailing list for more like this
The Top Investments Used by Financial Advisors
This was originally posted on Advisor Channel. Sign up to the free mailing list to get beautiful visualizations on financial markets that help advisors and their clients.
Today, financial advisors are re-evaluating how they build client portfolios as the economic environment evolves.
Following a decade of historically low interest rates, the U.S. economy is now characterized by higher interest rates, driven by inflationary pressures. This has been met with stronger bond returns and a more cautious view on stocks as companies face steeper borrowing costs.
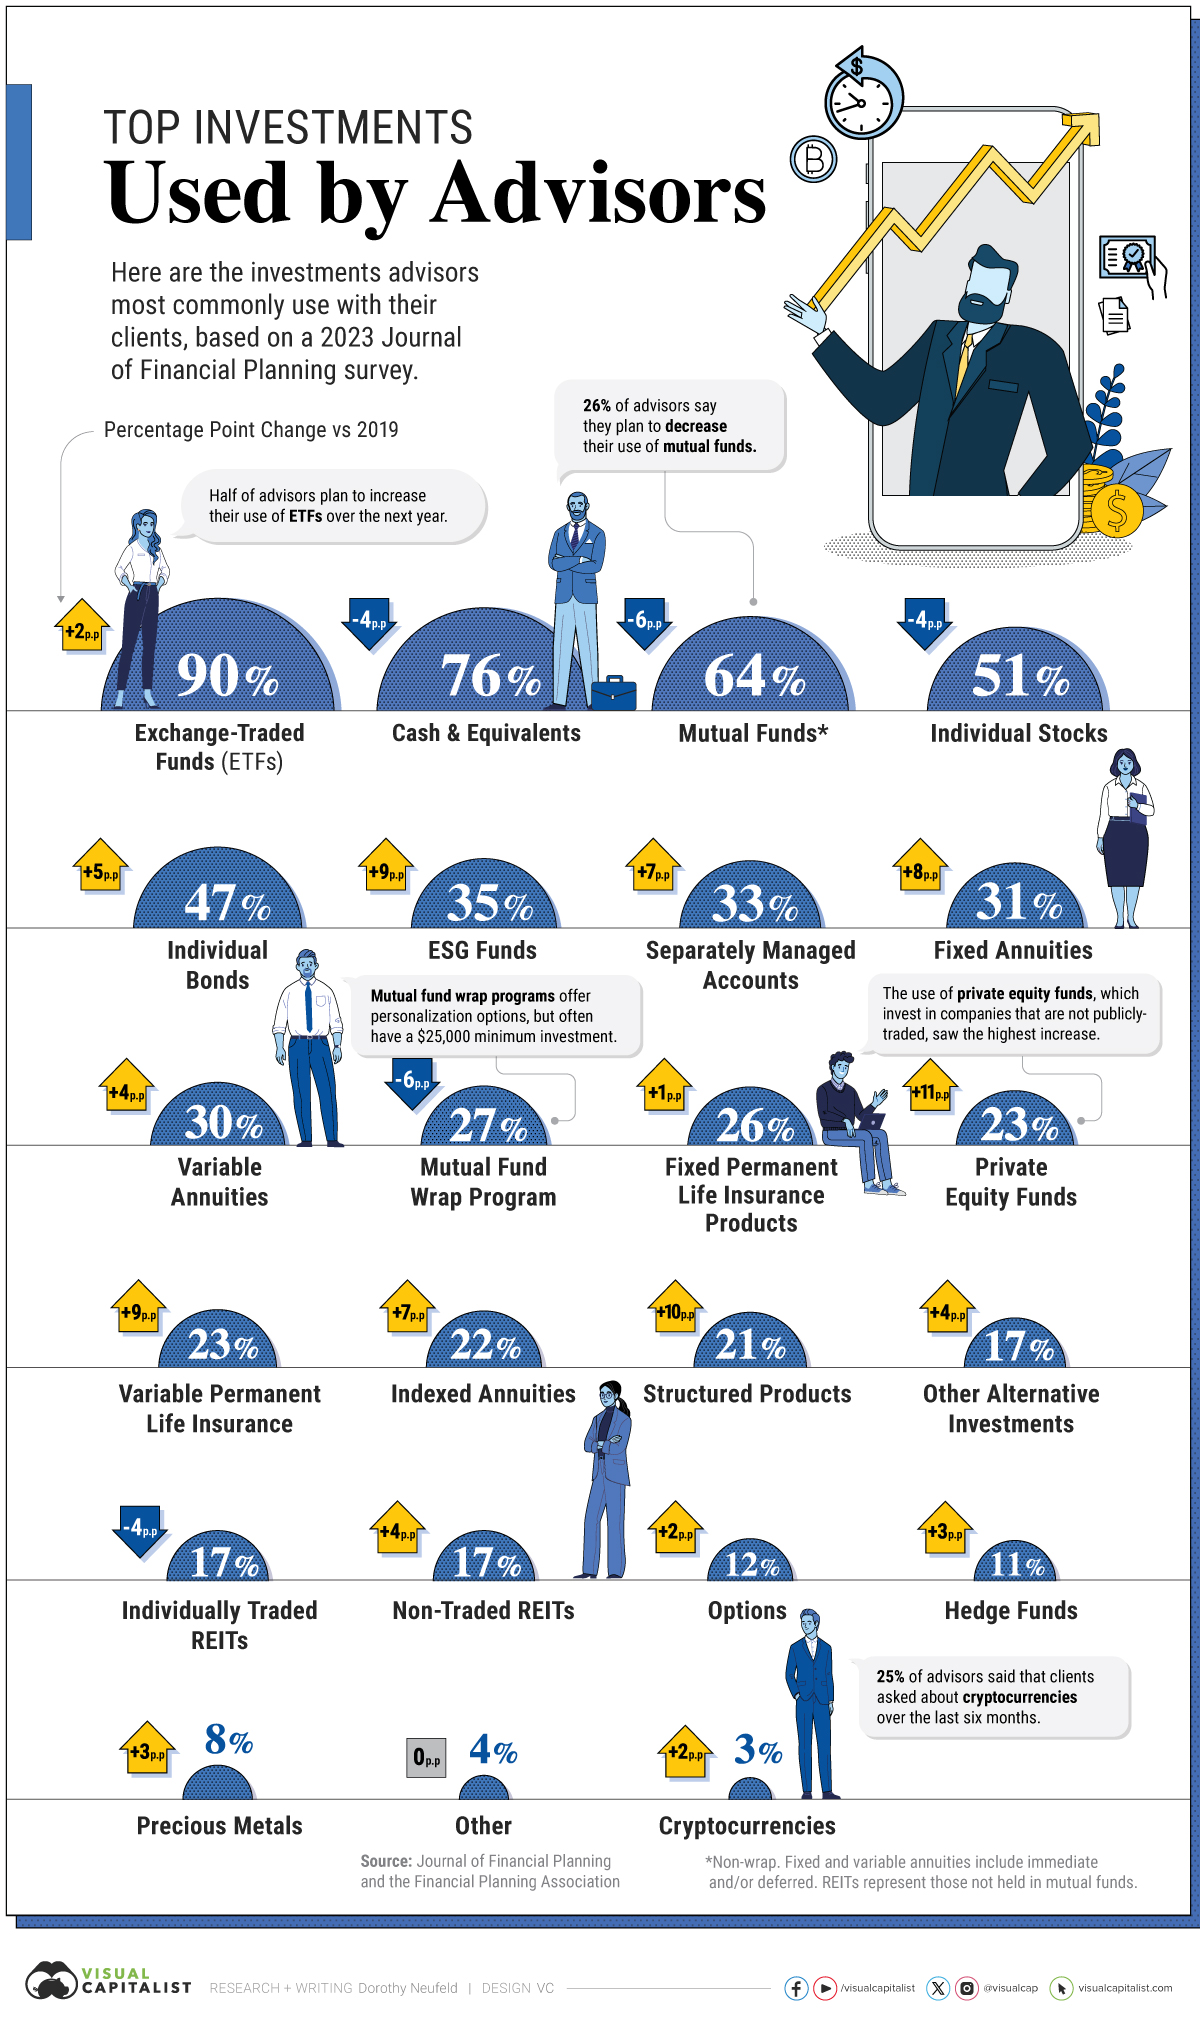
This graphic shows the top investments used by advisors, based on a 2023 Journal of Financial Planning survey.
Top Investments in 2023
Below, we show the most common types of investments advisors used or recommended to their clients this year:
| Investment Type | 2023 | 2019 |
|---|---|---|
| Exchange-Traded Funds (ETFs) | 90% | 88% |
| Cash and Equivalents | 76% | 80% |
| Mutual Funds* | 64% | 70% |
| Individual Stocks | 51% | 54% |
| Individual Bonds | 47% | 42% |
| ESG Funds | 35% | 26% |
| Separately Managed Accounts | 33% | 26% |
| Fixed Annuities | 31% | 23% |
| Variable Annuities | 30% | 26% |
| Mutual Fund Wrap Programs | 27% | 32% |
| Fixed Permanent Life Insurance Products | 26% | 24% |
| Private Equity Funds | 23% | 12% |
| Variable Permanent Life Insurance | 23% | 14% |
| Indexed Annuities | 22% | 15% |
| Structured Products | 21% | 11% |
| Other Alternative Investments | 17% | 13% |
| Individually Traded REITs | 17% | 20% |
| Non-Traded REITs | 17% | 13% |
| Options | 12% | 9% |
| Hedge Funds | 11% | 8% |
| Precious Metals | 8% | 5% |
| Other | 4% | 4% |
| Cryptocurrencies | 3% | 0% |
*Non-wrap. Numbers have been rounded.
As the above table shows, 90% of advisors use ETFs, and almost half reported they plan to increase their usage in the 12 months ahead.
Cash and equivalents, such as money market funds, were also widely used. Yet since 2019, use by advisors declined by four percentage points.
Money market funds saw a record $5.9 trillion in assets under management as of December, averaging returns of about 4.5%. Meanwhile, the S&P 500 has returned roughly 24% year-to-date and investment bonds have returned over 5%.
The use of private equity funds, which invest in privately-held companies, saw the highest increase across investment types, rising 11 percentage points as some advisors looked to alternative investments.
On the other hand, the sharpest decline was across mutual funds, falling six percentage points. Over a quarter of respondents say that they plan to decrease utilizing them in the next year.
Interestingly, 3% of advisors use cryptocurrencies with their clients. To date, Bitcoin has returned over 164%.
Advisor Views on the 60/40 Portfolio
Is the 60/40 portfolio dead?
After a rocky year in 2022, the time-honored 60% stock and 40% bond portfolio has returned 13% to date as of December. When surveyed, more advisors were confident than doubtful that it could offer similar returns compared to history.
| Confidence That a 60/40 Portfolio Can Provide Similar Returns as it Has Historically | Percent of Respondents |
|---|---|
| Very Confident | 16% |
| Confident | 28% |
| Somewhat Confident | 27% |
| Neutral | 7% |
| Somewhat Doubtful | 14% |
| Doubtful | 4% |
| Very Doubtful | 3% |
Percentages may not equal 100 due to rounding.
In fact, JP Morgan projects that a 60/40 portfolio will outperform cash by 4.1 percentage points on an annualized basis, and outpace inflation by 4.5 percentage points over the next decade.
According to their estimates, $100 in cash is forecast to grow to $133 over 10 years, while a 60/40 portfolio is projected to be worth $197.
Although the high interest rate climate has increased returns on cash, it misses out on the value of compounding offered by other types of investments over a longer horizon.


Money
Charted: Which City Has the Most Billionaires in 2024?
Just two countries account for half of the top 20 cities with the most billionaires. And the majority of the other half are found in Asia.


Charted: Which Country Has the Most Billionaires in 2024?
This was originally posted on our Voronoi app. Download the app for free on iOS or Android and discover incredible data-driven charts from a variety of trusted sources.
Some cities seem to attract the rich. Take New York City for example, which has 340,000 high-net-worth residents with investable assets of more than $1 million.
But there’s a vast difference between being a millionaire and a billionaire. So where do the richest of them all live?
Using data from the Hurun Global Rich List 2024, we rank the top 20 cities with the highest number of billionaires in 2024.
A caveat to these rich lists: sources often vary on figures and exact rankings. For example, in last year’s reports, Forbes had New York as the city with the most billionaires, while the Hurun Global Rich List placed Beijing at the top spot.
Ranked: Top 20 Cities with the Most Billionaires in 2024
The Chinese economy’s doldrums over the course of the past year have affected its ultra-wealthy residents in key cities.
Beijing, the city with the most billionaires in 2023, has not only ceded its spot to New York, but has dropped to #4, overtaken by London and Mumbai.
| Rank | City | Billionaires | Rank Change YoY |
|---|---|---|---|
| 1 | 🇺🇸 New York | 119 | +1 |
| 2 | 🇬🇧 London | 97 | +3 |
| 3 | 🇮🇳 Mumbai | 92 | +4 |
| 4 | 🇨🇳 Beijing | 91 | -3 |
| 5 | 🇨🇳 Shanghai | 87 | -2 |
| 6 | 🇨🇳 Shenzhen | 84 | -2 |
| 7 | 🇭🇰 Hong Kong | 65 | -1 |
| 8 | 🇷🇺 Moscow | 59 | No Change |
| 9 | 🇮🇳 New Delhi | 57 | +6 |
| 10 | 🇺🇸 San Francisco | 52 | No Change |
| 11 | 🇹🇭 Bangkok | 49 | +2 |
| 12 | 🇹🇼 Taipei | 45 | +2 |
| 13 | 🇫🇷 Paris | 44 | -2 |
| 14 | 🇨🇳 Hangzhou | 43 | -5 |
| 15 | 🇸🇬 Singapore | 42 | New to Top 20 |
| 16 | 🇨🇳 Guangzhou | 39 | -4 |
| 17T | 🇮🇩 Jakarta | 37 | +1 |
| 17T | 🇧🇷 Sao Paulo | 37 | No Change |
| 19T | 🇺🇸 Los Angeles | 31 | No Change |
| 19T | 🇰🇷 Seoul | 31 | -3 |
In fact all Chinese cities on the top 20 list have lost billionaires between 2023–24. Consequently, they’ve all lost ranking spots as well, with Hangzhou seeing the biggest slide (-5) in the top 20.
Where China lost, all other Asian cities—except Seoul—in the top 20 have gained ranks. Indian cities lead the way, with New Delhi (+6) and Mumbai (+3) having climbed the most.
At a country level, China and the U.S combine to make up half of the cities in the top 20. They are also home to about half of the world’s 3,200 billionaire population.
In other news of note: Hurun officially counts Taylor Swift as a billionaire, estimating her net worth at $1.2 billion.

-

 Science1 week ago
Visualizing the Average Lifespans of Mammals
-

 Markets2 weeks ago
The Top 10 States by Real GDP Growth in 2023
-

 Demographics2 weeks ago
The Smallest Gender Wage Gaps in OECD Countries
-

 Economy2 weeks ago
Where U.S. Inflation Hit the Hardest in March 2024
-

 Green2 weeks ago
Top Countries By Forest Growth Since 2001
-

 United States2 weeks ago
Ranked: The Largest U.S. Corporations by Number of Employees
-

 Maps2 weeks ago
The Largest Earthquakes in the New York Area (1970-2024)
-

 Green2 weeks ago
Ranked: The Countries With the Most Air Pollution in 2023