Markets
Ranked: The Megaregions Driving the Global Economy
View the full-resolution version of this infographic
Ranked: The Megaregions Driving the Global Economy
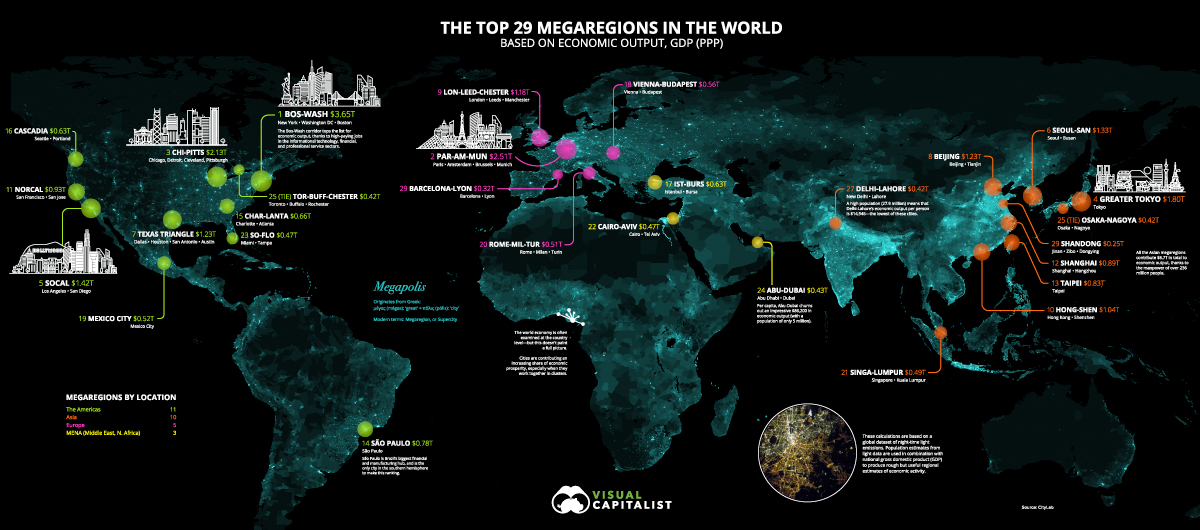
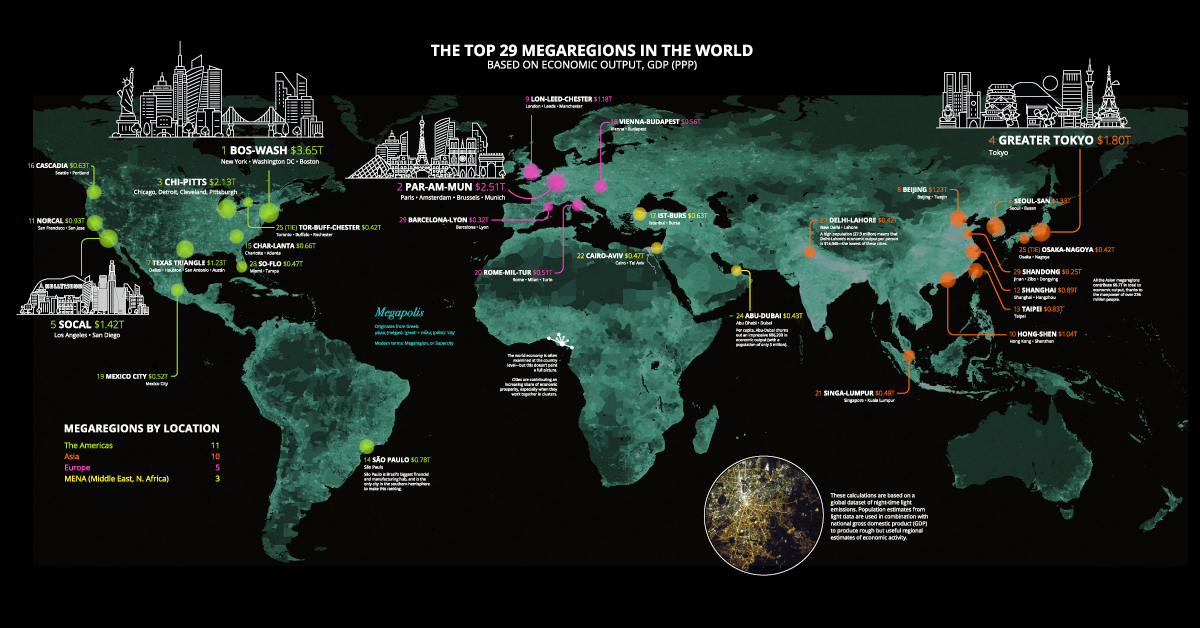
If you’ve ever flown cross-country in a window seat, chances are, the bright lights at night have caught your eye. From above, the world tells its own story—as concentrated pockets of bright light keep the world’s economy thriving.
Today’s visualization relies on data compiled by CityLab researchers to identify the world’s largest megaregions. The team defines megaregions as:
- Areas of continuous light, based on the latest night satellite imagery
- Capturing metro areas or networks of metro areas, with a combined population of 5 million or higher
- Generating economic output (GDP) of over $300 billion, on a PPP basis
The satellite imagery comes from the NOAA, while the base data for economic output is calculated from Oxford Economics via Brookings’ Global Metro Monitor 2018.
It’s worth pointing out that each megaregion may not be connected by specific trade relationships. Rather, satellite data highlights the proximity between these rough but useful regional estimates contributing to the global economy—and supercities are at the heart of it.
From Megalopolis to Megaregion
Throughout history, academics have described vast, interlinked urban regions as a ‘megalopolis’, or ‘megapolis’. Economic geographer Jean Gottman popularized the Greek term, referring to the booming and unprecedented urbanization in Bos-Wash—the northeast stretch from Boston and New York down to Washington, D.C.:
This region has indeed a “personality” of its own […] Every city in this region spreads out far and wide around its original nucleus.
By looking at adjacent metropolitan areas rather than country-level data, it can help provide an entirely new perspective on the global distribution of economic activity.
Where in the world are the most powerful urban economic clusters today?
The Largest Megaregions Today
The world’s economy is a sum of its parts. Each megaregion contributes significantly to the global growth engine, but arguably, certain areas pull more weight than others.
| Megaregion | Cities | Region | Population | Economic Output (EO) | EO per Capita |
|---|---|---|---|---|---|
| 1. Bos-Wash | New York, Washington, D.C., Boston | North America | 47.6M | $3,650B | $76,681 |
| 2. Par-Am-Mun | Paris, Amsterdam, Brussels, Munich | Europe | 43.5M | $2,505B | $57,586 |
| 3. Chi-Pitts | Chicago, Detroit, Cleveland, Pittsburgh | North America | 32.9M | $2,130B | $64,742 |
| 4. Greater Tokyo | Tokyo | Asia | 39.1M | $1,800B | $46,036 |
| 5. SoCal | Los Angeles, San Diego | North America | 22M | $1,424B | $64,727 |
| 6. Seoul-San | Seoul, Busan | Asia | 35.5M | $1,325B | $37,324 |
| 7. Texas Triangle | Dallas, Houston, San Antonio, Austin | North America | 18.4M | $1,227B | $66,685 |
| 8. Beijing | Beijing, Tianjin | Asia | 37.4M | $1,226B | $32,781 |
| 9. Lon-Leed-Chester | London, Leeds, Manchester | Europe | 22.6M | $1,177B | $52,080 |
| 10. Hong-Shen | Hong Kong, Shenzhen | Asia | 19.5M | $1,043B | $53,487 |
| 11. NorCal | San Francisco, San Jose | North America | 10.8M | $925B | $85,648 |
| 12. Shanghai | Shanghai, Hangzhou | Asia | 24.2M | $892B | $36,860 |
| 13. Taipei | Taipei | Asia | 16.7M | $827B | $49,521 |
| 14. São Paolo | São Paolo | South America | 33.5M | $780B | $23,284 |
| 15. Char-Lanta | Charlotte, Atlanta | North America | 10.5M | $656B | $62,476 |
| 16. Cascadia | Seattle, Portland | North America | 8.8M | $627B | $71,250 |
| 17. Ista-Burs | Istanbul, Bursa | MENA | 14.8M | $626B | $42,297 |
| 18. Vienna-Budapest | Vienna, Budapest | Europe | 12.8M | $555B | $43,359 |
| 19. Mexico City | Mexico City | North America | 24.5M | $524B | $21,388 |
| 20. Rome-Mil-Tur | Rome, Milan, Turin | Europe | 13.8M | $513B | $37,174 |
| 21. Singa-Lumpur | Singapore, Kuala Lumpur | Asia | 12.7M | $493B | $38,819 |
| 22. Cairo-Aviv | Cairo, Tel Aviv | MENA | 19.8M | $472B | $23,838 |
| 23. So-Flo | Miami, Tampa | North America | 9.1M | $470B | $51,648 |
| 24. Abu-Dubai | Abu Dhabi, Dubai | MENA | 5M | $431B | $86,200 |
| 25. Osaka-Nagoya (tied) | Osaka, Nagoya | Asia | 9.1M | $424B | $46,593 |
| 25. Tor-Buff-Chester (tied) | Toronto, Buffalo, Rochester | North America | 8.5M | $424B | $49,882 |
| 27. Delhi-Lahore | New Delhi, Lahore | Asia | 27.9M | $417B | $14,946 |
| 28. Barcelona-Lyon | Barcelona, Lyon | Europe | 7M | $323B | $46,143 |
| 29. Shandong | Jinan, Zibo, Dongying | Asia | 14.2M | $249B | $17,535 |
| Total | 602.2M | $28,135B | $46,720 |
Altogether, these powerhouses bring in over $28 trillion in economic output.
Unsurprisingly, Bos-Wash reigns supreme even today, with $3.6 trillion in economic output, over 13% of the total. The corridor hosts some of the highest-paying sectors: information technology, finance, and professional services.
The largest city in Brazil, São Paulo, is the only city in the Southern Hemisphere to make the list. The city was once heavily reliant on manufacturing and trade, but the $780 billion city economy is now embracing its role as a nascent financial hub.
On the other side of the world, the cluster of Asian megaregions combines for $8.7 trillion in total economic output. Of these, Greater Tokyo in Japan is the largest, while Shandong might be a name that fewer people are familiar with. Sandwiched between Beijing and Shanghai, the coastal province houses multiple high-tech industrial and export processing zones.
The data is even more interesting when broken down into economic output per capita—Abu-Dubai churns out an impressive $86,200 per person. Meanwhile, Delhi-Lahore is lowest on the per-capita list, at $14,946 per person across nearly 28 million people.
Where To Next?
This trend shows no sign of slowing down, as megacities are on the rise in the coming decade. Eventually, more Indian and African megaregions will make its way onto this list, led by cities like Lagos and Chennai.
Stay tuned to Visual Capitalist for a North America-specific outlook coming soon, and a deep dive into the biggest factors contributing to the growth of these megaregions.


Markets
The European Stock Market: Attractive Valuations Offer Opportunities
On average, the European stock market has valuations that are nearly 50% lower than U.S. valuations. But how can you access the market?


European Stock Market: Attractive Valuations Offer Opportunities
Europe is known for some established brands, from L’Oréal to Louis Vuitton. However, the European stock market offers additional opportunities that may be lesser known.
The above infographic, sponsored by STOXX, outlines why investors may want to consider European stocks.
Attractive Valuations
Compared to most North American and Asian markets, European stocks offer lower or comparable valuations.
| Index | Price-to-Earnings Ratio | Price-to-Book Ratio |
|---|---|---|
| EURO STOXX 50 | 14.9 | 2.2 |
| STOXX Europe 600 | 14.4 | 2 |
| U.S. | 25.9 | 4.7 |
| Canada | 16.1 | 1.8 |
| Japan | 15.4 | 1.6 |
| Asia Pacific ex. China | 17.1 | 1.8 |
Data as of February 29, 2024. See graphic for full index names. Ratios based on trailing 12 month financials. The price to earnings ratio excludes companies with negative earnings.
On average, European valuations are nearly 50% lower than U.S. valuations, potentially offering an affordable entry point for investors.
Research also shows that lower price ratios have historically led to higher long-term returns.
Market Movements Not Closely Connected
Over the last decade, the European stock market had low-to-moderate correlation with North American and Asian equities.
The below chart shows correlations from February 2014 to February 2024. A value closer to zero indicates low correlation, while a value of one would indicate that two regions are moving in perfect unison.
| EURO STOXX 50 | STOXX EUROPE 600 | U.S. | Canada | Japan | Asia Pacific ex. China |
|
|---|---|---|---|---|---|---|
| EURO STOXX 50 | 1.00 | 0.97 | 0.55 | 0.67 | 0.24 | 0.43 |
| STOXX EUROPE 600 | 1.00 | 0.56 | 0.71 | 0.28 | 0.48 | |
| U.S. | 1.00 | 0.73 | 0.12 | 0.25 | ||
| Canada | 1.00 | 0.22 | 0.40 | |||
| Japan | 1.00 | 0.88 | ||||
| Asia Pacific ex. China | 1.00 |
Data is based on daily USD returns.
European equities had relatively independent market movements from North American and Asian markets. One contributing factor could be the differing sector weights in each market. For instance, technology makes up a quarter of the U.S. market, but health care and industrials dominate the broader European market.
Ultimately, European equities can enhance portfolio diversification and have the potential to mitigate risk for investors.
Tracking the Market
For investors interested in European equities, STOXX offers a variety of flagship indices:
| Index | Description | Market Cap |
|---|---|---|
| STOXX Europe 600 | Pan-regional, broad market | €10.5T |
| STOXX Developed Europe | Pan-regional, broad-market | €9.9T |
| STOXX Europe 600 ESG-X | Pan-regional, broad market, sustainability focus | €9.7T |
| STOXX Europe 50 | Pan-regional, blue-chip | €5.1T |
| EURO STOXX 50 | Eurozone, blue-chip | €3.5T |
Data is as of February 29, 2024. Market cap is free float, which represents the shares that are readily available for public trading on stock exchanges.
The EURO STOXX 50 tracks the Eurozone’s biggest and most traded companies. It also underlies one of the world’s largest ranges of ETFs and mutual funds. As of November 2023, there were €27.3 billion in ETFs and €23.5B in mutual fund assets under management tracking the index.
“For the past 25 years, the EURO STOXX 50 has served as an accurate, reliable and tradable representation of the Eurozone equity market.”
— Axel Lomholt, General Manager at STOXX
Partnering with STOXX to Track the European Stock Market
Are you interested in European equities? STOXX can be a valuable partner:
- Comprehensive, liquid and investable ecosystem
- European heritage, global reach
- Highly sophisticated customization capabilities
- Open architecture approach to using data
- Close partnerships with clients
- Part of ISS STOXX and Deutsche Börse Group
With a full suite of indices, STOXX can help you benchmark against the European stock market.
Learn how STOXX’s European indices offer liquid and effective market access.

-

 Economy2 days ago
Economic Growth Forecasts for G7 and BRICS Countries in 2024
The IMF has released its economic growth forecasts for 2024. How do the G7 and BRICS countries compare?
-

 Markets2 weeks ago
U.S. Debt Interest Payments Reach $1 Trillion
U.S. debt interest payments have surged past the $1 trillion dollar mark, amid high interest rates and an ever-expanding debt burden.
-

 United States2 weeks ago
Ranked: The Largest U.S. Corporations by Number of Employees
We visualized the top U.S. companies by employees, revealing the massive scale of retailers like Walmart, Target, and Home Depot.
-

 Markets2 weeks ago
The Top 10 States by Real GDP Growth in 2023
This graphic shows the states with the highest real GDP growth rate in 2023, largely propelled by the oil and gas boom.
-

 Markets2 weeks ago
Ranked: The World’s Top Flight Routes, by Revenue
In this graphic, we show the highest earning flight routes globally as air travel continued to rebound in 2023.
-

 Markets3 weeks ago
Ranked: The Most Valuable Housing Markets in America
The U.S. residential real estate market is worth a staggering $47.5 trillion. Here are the most valuable housing markets in the country.


-

 Debt1 week ago
How Debt-to-GDP Ratios Have Changed Since 2000
-
Markets2 weeks ago
Ranked: The World’s Top Flight Routes, by Revenue
-

 Countries2 weeks ago
Population Projections: The World’s 6 Largest Countries in 2075
-
Markets2 weeks ago
The Top 10 States by Real GDP Growth in 2023
-

 Demographics2 weeks ago
The Smallest Gender Wage Gaps in OECD Countries
-

 United States2 weeks ago
Where U.S. Inflation Hit the Hardest in March 2024
-

 Green2 weeks ago
Top Countries By Forest Growth Since 2001
-
United States2 weeks ago
Ranked: The Largest U.S. Corporations by Number of Employees