Chart of the Week
Which Countries Are the Biggest Boost or Drag on the EU Budget?
Which Countries Are the Biggest Boost or Drag on the EU Budget?
With 28 countries and over €15.8 trillion in 2018 GDP (PPP) to its name, there’s no doubt the European Union (EU) is highly influential in economics and politics. The “superpower” tackles a wide range of issues from climate change and health to external relations, justice, and migration.
Of course, the money required to address these concerns must come from somewhere—and that’s where the EU’s budget comes in. Each member state contributes revenue, but it’s been argued that not everyone is pulling their weight.
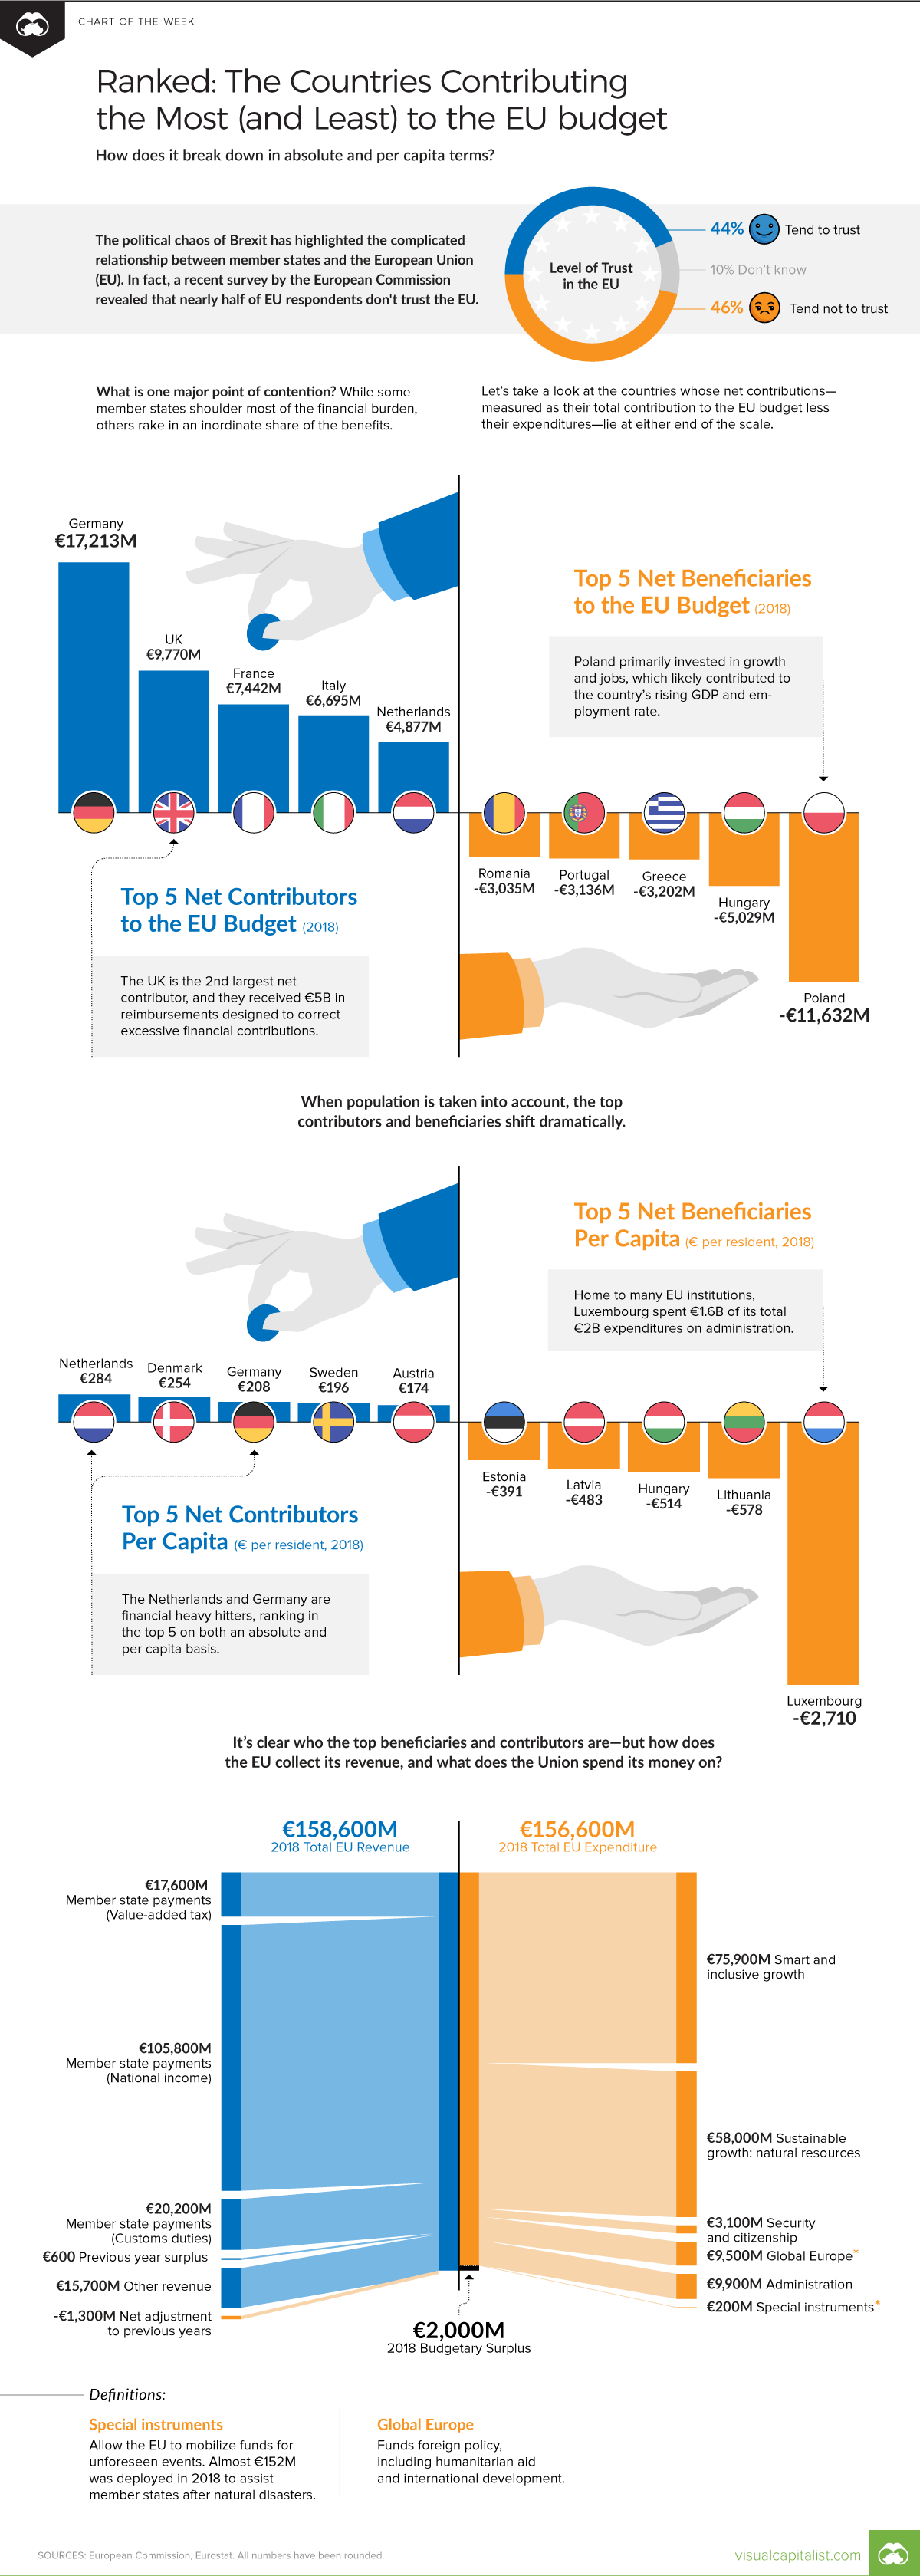
Today’s chart is based on budget data from the European Commission, and ranks the member states who contributed the most, and least, to the 2018 EU budget. Specifically, we’ve charted the net contributions—measured as the country’s total contribution less expenditures—on an absolute and per capita basis. We also break down the EU’s main revenue sources and areas of expenditure for the year.
An Unequal Share
Perhaps not surprisingly, Germany and the UK are the top two net contributors in absolute terms. Combined, these two powerhouses had a GDP (PPP) of over €5 trillion in 2018.
At the other end of the scale, Poland tops the list of net beneficiaries with a deficit of -€11,632 million—more than double that of second-place Hungary. In the wake of the European sovereign debt crisis, Greece and Portugal slide into fourth and fifth place respectively.
When population is taken into account, these rankings shift dramatically. Per capita, the Netherlands tops the list with €284 contributed per resident, whereas Luxembourg lands in last place with a deficit of -€2,710. The small country is home to many EU institutions, resulting in high administrative spending: in 2018, administration amounted to 80% of total expenditures.
Here’s a full ranking of the 28 member states, in both absolute (€M) and per capita (€ per resident) terms:
| Rank | Member State | Absolute net contribution (€M) | Member State | Per capita net contribution (€ per resident) |
|---|---|---|---|---|
| #1 | 🇩🇪 Germany | €17,213M | 🇳🇱 Netherlands | €284 |
| #2 | 🇬🇧 United Kingdom | €9,770M | 🇩🇰 Denmark | €254 |
| #3 | 🇫🇷 France | €7,442M | 🇩🇪 Germany | €208 |
| #4 | 🇮🇹 Italy | €6,695M | 🇸🇪 Sweden | €196 |
| #5 | 🇳🇱 Netherlands | €4,877M | 🇦🇹 Austria | €174 |
| #6 | 🇸🇪 Sweden | €1,983M | 🇬🇧 United Kingdom | €147 |
| #7 | 🇦🇹 Austria | €1,534M | 🇫🇮 Finland | €123 |
| #8 | 🇩🇰 Denmark | €1,468M | 🇮🇪 Ireland | €112 |
| #9 | 🇫🇮 Finland | €679M | 🇫🇷 France | €111 |
| #10 | 🇮🇪 Ireland | €542M | 🇮🇹 Italy | €111 |
| #11 | 🇲🇹 Malta | -€41M | 🇪🇸 Spain | -€9 |
| #12 | 🇨🇾 Cyprus | -€61M | 🇨🇾 Cyprus | -€70 |
| #13 | 🇪🇸 Spain | -€42M8 | 🇲🇹 Malta | -€85 |
| #14 | 🇸🇮 Slovenia | -€471M | 🇭🇷 Croatia | -€154 |
| #15 | 🇪🇪 Estonia | -€516M | 🇷🇴 Romania | -€155 |
| #16 | 🇭🇷 Croatia | -€633M | 🇨🇿 Czech Republic | -€201 |
| #17 | 🇱🇻 Latvia | -€93M5 | 🇧🇬 Bulgaria | -€225 |
| #18 | 🇧🇬 Bulgaria | -€1,585M | 🇧🇪 Belgium | -€227 |
| #19 | 🇸🇰 Slovakia | -€1,600M | 🇸🇮 Slovenia | -€228 |
| #20 | 🇱🇹 Lithuania | -€1,624M | 🇸🇰 Slovakia | -€294 |
| #21 | 🇱🇺 Luxembourg | -€1,631M | 🇬🇷 Greece | -€298 |
| #22 | 🇨🇿 Czech Republic | -€2,136M | 🇵🇹 Portugal | -€305 |
| #23 | 🇧🇪 Belgium | -€2,590M | 🇵🇱 Poland | -€306 |
| #24 | 🇷🇴 Romania | -€3,035M | 🇪🇪 Estonia | -€391 |
| #25 | 🇵🇹 Portugal | -€3,136M | 🇱🇻 Latvia | -€483 |
| #26 | 🇬🇷 Greece | -€3,202M | 🇭🇺 Hungary | -€514 |
| #27 | 🇭🇺 Hungary | -€5,029M | 🇱🇹 Lithuania | -€578 |
| #28 | 🇵🇱 Poland | -€11,632M | 🇱🇺 Luxembourg | -€2,710 |
It’s easy to see what the net beneficiaries might gain from the EU—but what about the top net contributors? Beyond straight budgetary allocations, member states have access to a single open market, and benefit from the political clout of 28 united countries, among other perks.
Following the Money
So, how does the EU collect its revenue, and what does it spend its money on? Revenue is broken down into four main categories:
- Value Added Tax (VAT)-Based Own Resource (2018 total: €17,600M)
Member states pay based on how much they receive in VAT. The VAT “base” is capped at 50% of a country’s Gross National Income (GNI), and a standard levy of 0.3% applies. Germany, the Netherlands and Sweden benefit from a reduced rate of 0.15% in an effort to re-balance their excessive contributions.
- Gross National Income (GNI)-Based Own Resource (2018 total: €105,800M)
Calculated as the difference between total expenditure and the sum of all other revenue, this revenue stream is the amount needed to balance the EU budget. The EU applies a standard percentage across member states, with Denmark, the Netherlands, and Sweden receiving a lump sum reduction in 2018.
- Traditional Own Resources (2018 total: €20,200M)
Member states collect customs duties and sugar levies, which goes directly towards the EU budget after the country deducts a 20% collection cost.
- Other Revenue (2018 total: €15,700M)
This consists of various items including taxes on EU workers’ salaries, interest on late payments and fines, and contributions from non-EU countries to research programs.
Revenue might also include a budget surplus from the previous year, or net adjustments made to previous years’ financials. On the other side of the budget, the EU has a wide variety of expenditures, broken down into six main categories:
- Smart and Inclusive Growth (2018 total: €75,900M)
This category focuses on boosting growth, creating jobs, and fostering economic and social cohesion through training, education, research, and social policy.
- Sustainable Growth: Natural Resources (2018 total: €58,000M)
The EU allocates funding for the sustainable growth of agriculture, rural development, and fisheries. It also finances programs dedicated to climate action.
- Security and Citizenship (2018 total: €3,100M)
Focused on the safety and rights of its citizens, this budget line item encompasses everything from migration and border protection to food safety and consumer protection.
- Global Europe (2018 total: €9,500M)
This covers all foreign policy, including international development and humanitarian aid.
- Administration (2018 total: €9,900M)
The expenditures of all EU institutions are captured under this heading, including staff salaries, building rent, information technology and training.
- Special Instruments (2018 total: €200M)
This area enables the EU to mobilize funds for unforeseen events, such as natural disasters and major world trade patterns that displace workers.
The 2018 budget resulted in a surplus of two billion Euros, but will it be balanced in future years?
The 2020 Budget and Beyond
The EU’s current budgetary framework ends in 2020. A proposal for the 2021–2027 budget has already been set forth, and council meetings are ongoing.
With Brexit’s twice-postponed deadline looming, the UK’s departure will leave a “sizable gap” in the EU budget. This could leave member states scrambling to find additional revenue sources and ways to reduce expenditures.
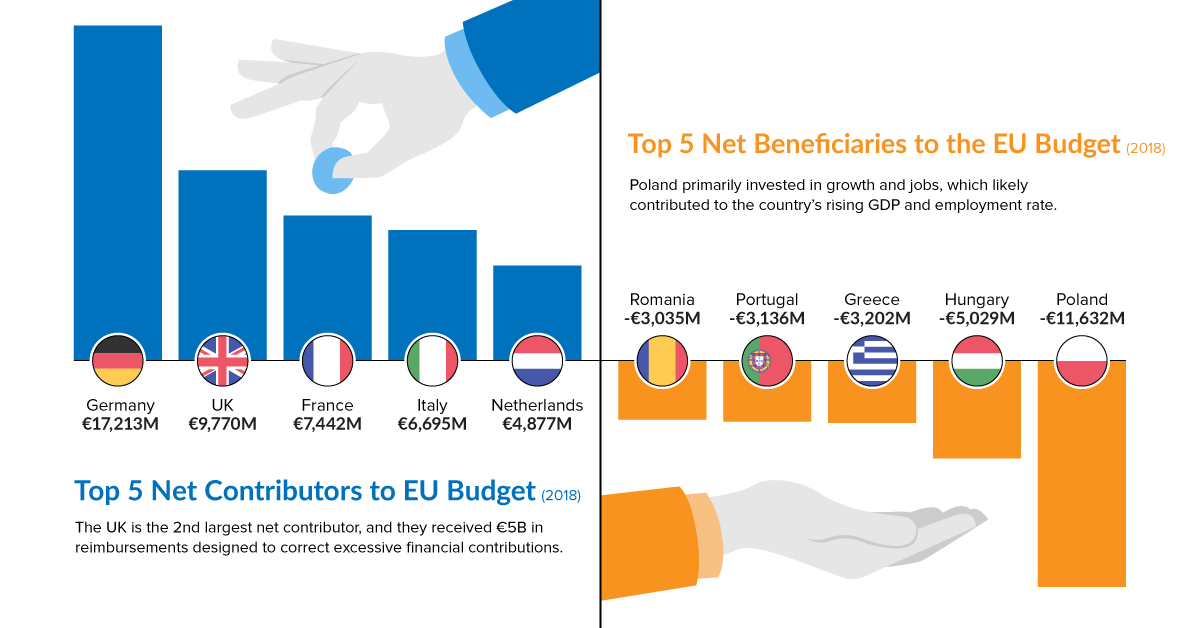


Chart of the Week
The Road to Recovery: Which Economies are Reopening?
We look at mobility rates as well as COVID-19 recovery rates for 41 economies, to see which countries are reopening for business.

The Road to Recovery: Which Economies are Reopening?
COVID-19 has brought the world to a halt—but after months of uncertainty, it seems that the situation is slowly taking a turn for the better.
Today’s chart measures the extent to which 41 major economies are reopening, by plotting two metrics for each country: the mobility rate and the COVID-19 recovery rate:
- Mobility Index
This refers to the change in activity around workplaces, subtracting activity around residences, measured as a percentage deviation from the baseline. - COVID-19 Recovery Rate
The number of recovered cases in a country is measured as the percentage of total cases.
Data for the first measure comes from Google’s COVID-19 Community Mobility Reports, which relies on aggregated, anonymous location history data from individuals. Note that China does not show up in the graphic as the government bans Google services.
COVID-19 recovery rates rely on values from CoronaTracker, using aggregated information from multiple global and governmental databases such as WHO and CDC.
Reopening Economies, One Step at a Time
In general, the higher the mobility rate, the more economic activity this signifies. In most cases, mobility rate also correlates with a higher rate of recovered people in the population.
Here’s how these countries fare based on the above metrics.
| Country | Mobility Rate | Recovery Rate | Total Cases | Total Recovered |
|---|---|---|---|---|
| Argentina | -56% | 31.40% | 14,702 | 4,617 |
| Australia | -41% | 92.03% | 7,150 | 6,580 |
| Austria | -100% | 91.93% | 16,628 | 15,286 |
| Belgium | -105% | 26.92% | 57,849 | 15,572 |
| Brazil | -48% | 44.02% | 438,812 | 193,181 |
| Canada | -67% | 52.91% | 88,512 | 46,831 |
| Chile | -110% | 41.58% | 86,943 | 36,150 |
| Colombia | -73% | 26.28% | 25,366 | 6,665 |
| Czechia | -29% | 70.68% | 9,140 | 6,460 |
| Denmark | -93% | 88.43% | 11,512 | 10,180 |
| Finland | -93% | 81.57% | 6,743 | 5,500 |
| France | -100% | 36.08% | 186,238 | 67,191 |
| Germany | -99% | 89.45% | 182,452 | 163,200 |
| Greece | -32% | 47.28% | 2,906 | 1,374 |
| Hong Kong | -10% | 97.00% | 1,067 | 1,035 |
| Hungary | -49% | 52.31% | 3,816 | 1,996 |
| India | -65% | 42.88% | 165,386 | 70,920 |
| Indonesia | -77% | 25.43% | 24,538 | 6,240 |
| Ireland | -79% | 88.92% | 24,841 | 22,089 |
| Israel | -31% | 87.00% | 16,872 | 14,679 |
| Italy | -52% | 64.99% | 231,732 | 150,604 |
| Japan | -33% | 84.80% | 16,683 | 14,147 |
| Malaysia | -53% | 80.86% | 7,629 | 6,169 |
| Mexico | -69% | 69.70% | 78,023 | 54,383 |
| Netherlands | -97% | 0.01% | 45,950 | 3 |
| New Zealand | -21% | 98.01% | 1,504 | 1,474 |
| Norway | -100% | 91.87% | 8,411 | 7,727 |
| Philippines | -87% | 23.08% | 15,588 | 3,598 |
| Poland | -36% | 46.27% | 22,825 | 10,560 |
| Portugal | -65% | 58.99% | 31,596 | 18,637 |
| Singapore | -105% | 55.02% | 33,249 | 18,294 |
| South Africa | -74% | 52.44% | 27,403 | 14,370 |
| South Korea | -4% | 91.15% | 11,344 | 10,340 |
| Spain | -67% | 69.11% | 284,986 | 196,958 |
| Sweden | -93% | 13.91% | 35,727 | 4,971 |
| Switzerland | -101% | 91.90% | 30,796 | 28,300 |
| Taiwan | 4% | 95.24% | 441 | 420 |
| Thailand | -36% | 96.08% | 3,065 | 2,945 |
| U.S. | -56% | 28.20% | 1,768,346 | 498,720 |
| United Kingdom | -82% | 0.05% | 269,127 | 135 |
| Vietnam | 15% | 85.02% | 327 | 278 |
Mobility data as of May 21, 2020 (Latest available). COVID-19 case data as of May 29, 2020.
In the main scatterplot visualization, we’ve taken things a step further, assigning these countries into four distinct quadrants:
1. High Mobility, High Recovery
High recovery rates are resulting in lifted restrictions for countries in this quadrant, and people are steadily returning to work.
New Zealand has earned praise for its early and effective pandemic response, allowing it to curtail the total number of cases. This has resulted in a 98% recovery rate, the highest of all countries. After almost 50 days of lockdown, the government is recommending a flexible four-day work week to boost the economy back up.
2. High Mobility, Low Recovery
Despite low COVID-19 related recoveries, mobility rates of countries in this quadrant remain higher than average. Some countries have loosened lockdown measures, while others did not have strict measures in place to begin with.
Brazil is an interesting case study to consider here. After deferring lockdown decisions to state and local levels, the country is now averaging the highest number of daily cases out of any country. On May 28th, for example, the country had 24,151 new cases and 1,067 new deaths.
3. Low Mobility, High Recovery
Countries in this quadrant are playing it safe, and holding off on reopening their economies until the population has fully recovered.
Italy, the once-epicenter for the crisis in Europe is understandably wary of cases rising back up to critical levels. As a result, it has opted to keep its activity to a minimum to try and boost the 65% recovery rate, even as it slowly emerges from over 10 weeks of lockdown.
4. Low Mobility, Low Recovery
Last but not least, people in these countries are cautiously remaining indoors as their governments continue to work on crisis response.
With a low 0.05% recovery rate, the United Kingdom has no immediate plans to reopen. A two-week lag time in reporting discharged patients from NHS services may also be contributing to this low number. Although new cases are leveling off, the country has the highest coronavirus-caused death toll across Europe.
The U.S. also sits in this quadrant with over 1.7 million cases and counting. Recently, some states have opted to ease restrictions on social and business activity, which could potentially result in case numbers climbing back up.
Over in Sweden, a controversial herd immunity strategy meant that the country continued business as usual amid the rest of Europe’s heightened regulations. Sweden’s COVID-19 recovery rate sits at only 13.9%, and the country’s -93% mobility rate implies that people have been taking their own precautions.
COVID-19’s Impact on the Future
It’s important to note that a “second wave” of new cases could upend plans to reopen economies. As countries reckon with these competing risks of health and economic activity, there is no clear answer around the right path to take.
COVID-19 is a catalyst for an entirely different future, but interestingly, it’s one that has been in the works for a while.
Without being melodramatic, COVID-19 is like the last nail in the coffin of globalization…The 2008-2009 crisis gave globalization a big hit, as did Brexit, as did the U.S.-China trade war, but COVID is taking it to a new level.
—Carmen Reinhart, incoming Chief Economist for the World Bank
Will there be any chance of returning to “normal” as we know it?

-

 Real Estate2 weeks ago
Visualizing America’s Shortage of Affordable Homes
-

 Technology1 week ago
Ranked: Semiconductor Companies by Industry Revenue Share
-

 Money1 week ago
Which States Have the Highest Minimum Wage in America?
-

 Real Estate1 week ago
Ranked: The Most Valuable Housing Markets in America
-

 Business2 weeks ago
Charted: Big Four Market Share by S&P 500 Audits
-

 AI2 weeks ago
The Stock Performance of U.S. Chipmakers So Far in 2024
-

 Misc2 weeks ago
Almost Every EV Stock is Down After Q1 2024
-

 Money2 weeks ago
Where Does One U.S. Tax Dollar Go?