COVID-19
Charted: The Gen Z Unemployment Rate, Compared to Older Generations
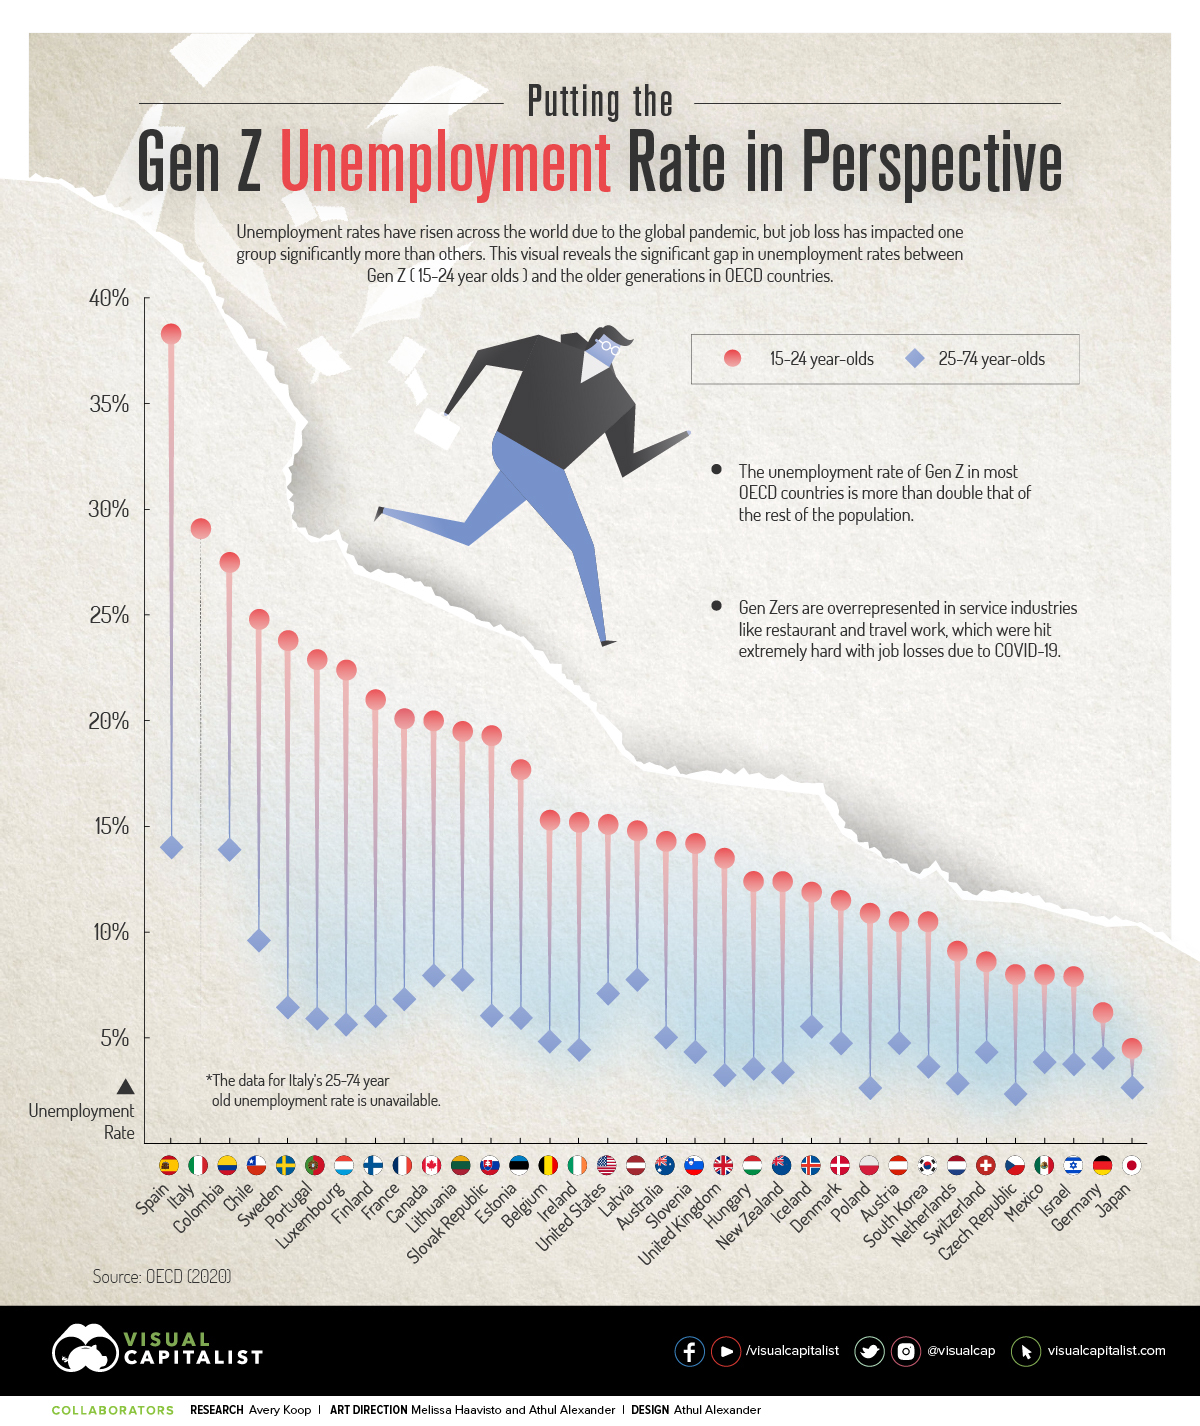


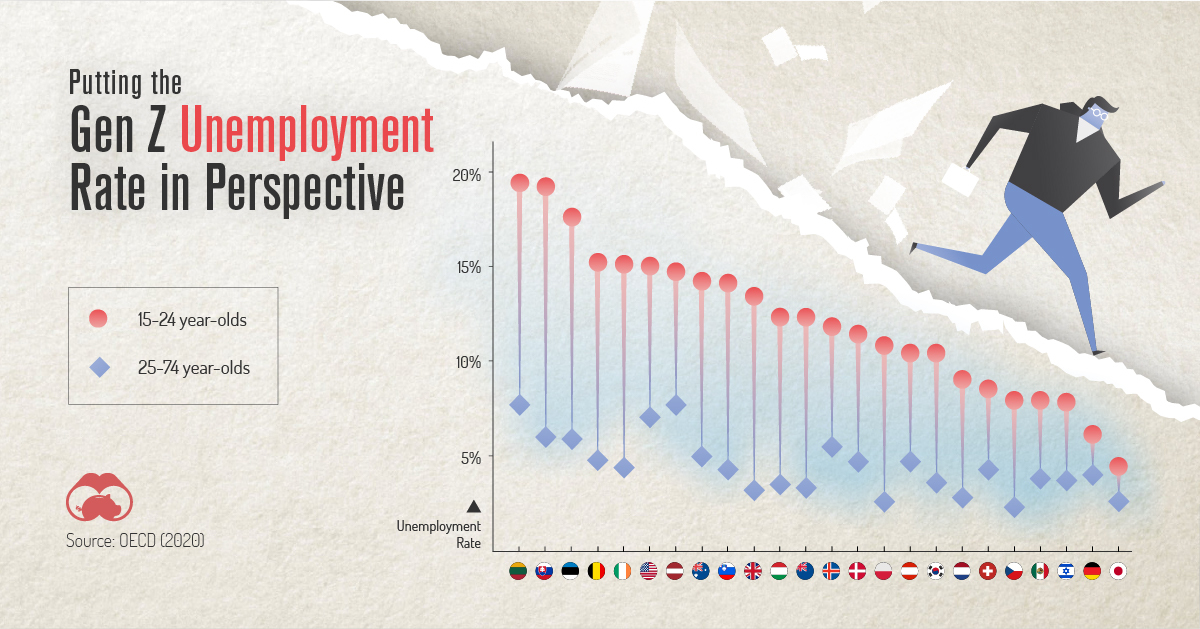
Putting the Gen Z Unemployment Rate in Perspective
There are more than 2 billion people in the Generation Z age range globally. These individuals, born between 1997 and 2009, represent about 30% of the total global population—and it’s predicted that by 2025, Gen Z will make up about 27% of the workforce.
Due to the global pandemic, unemployment has been on the rise across the board—but Gen Z has been hit the hardest. This chart, using data from the OECD, displays the difference between the unemployment rate for Gen Zers and the rate for older generations.
Note: The OECD defines the ‘unemployed’ as people of legal working age who don’t have work, are available to work, and have taken steps to find a job. The final figure is the number of unemployed people as a share of the total labor force.
The Generation Gap: Gen Z Unemployment
Compared to their older working-age counterparts, Baby Boomers, Gen X, and Millennials (Gen Y)—the most recent 2020 data shows that Gen Z has an unemployment rate of nearly 2x more in almost every OECD country.
| Country | Unemployment Rate (Gen Z) | Unemployment Rate (Millennial, Gen X, Boomer) |
|---|---|---|
| 🇦🇺 Australia | 14.3% | 5.0% |
| 🇦🇹 Austria | 10.5% | 4.7% |
| 🇧🇪 Belgium | 15.3% | 4.8% |
| 🇨🇦 Canada | 20.0% | 7.9% |
| 🇨🇱 Chile | 24.8% | 9.6% |
| 🇨🇴 Colombia | 27.5% | 13.9% |
| 🇨🇿 Czech Republic | 8.0% | 2.3% |
| 🇩🇰 Denmark | 11.5% | 4.7% |
| 🇪🇪 Estonia | 17.7% | 5.9% |
| 🇫🇮 Finland | 21.0% | 6.0% |
| 🇫🇷 France | 20.1% | 6.8% |
| 🇩🇪 Germany | 6.2% | 4.0% |
| 🇭🇺 Hungary | 12.4% | 3.5% |
| 🇮🇸 Iceland | 11.9% | 5.5% |
| 🇮🇪 Ireland | 15.2% | 4.4% |
| 🇮🇱 Israel | 7.9% | 3.7% |
| 🇮🇹 Italy | 29.1% | - |
| 🇯🇵 Japan | 4.5% | 2.6% |
| 🇰🇷 South Korea | 10.5% | 3.6% |
| 🇱🇻 Latvia | 14.8% | 7.7% |
| 🇱🇹 Lithuania | 19.5% | 7.7% |
| 🇱🇺 Luxembourg | 22.4% | 5.6% |
| 🇲🇽 Mexico | 8.0% | 3.8% |
| 🇳🇱 Netherlands | 9.1% | 2.8% |
| 🇳🇿 New Zealand | 12.4% | 3.3% |
| 🇵🇱 Poland | 10.9% | 2.6% |
| 🇵🇹 Portugal | 22.9% | 5.9% |
| 🇸🇰 Slovakia | 19.3% | 6.0% |
| 🇸🇮 Slovenia | 14.2% | 4.3% |
| 🇪🇸 Spain | 38.3% | 14.0% |
| 🇸🇪 Sweden | 23.8% | 6.4% |
| 🇨🇭 Switzerland | 8.6% | 4.3% |
| 🇬🇧 United Kingdom | 13.5% | 3.2% |
| 🇺🇸 United States | 15.1% | 7.1% |
Note: For the purposes of this article, we are only considering the Gen Zers of legal working age—those born 1997-2006. The rest—Baby Boomers, Gen X, and Millennials—are those born between 1946–1996.
The timing for the youngest working generation could not be worse. Gen Z is just beginning to graduate college and high school, and are beginning to search for work and careers.
Gen Z is also an age group that is overrepresented in service industries like restaurants and travel–industries that were equally hard hit by the pandemic. In the U.S., for example, around 25% of young people work in the hospitality and leisure sectors. Between February and May 2020 alone, employment in these sectors decreased by 41%.
Countries like Spain are facing some of the biggest headwinds among OECD countries. The country already has a high unemployment rate for those aged 25-74, at 14%. But the unemployment rate for Gen Z is more than double that, at over 38%.
Implications For the Future
While it may be true throughout history that this age group is often less employed than older cohorts, the share of labor held by those aged 15-24 dropped significantly in 2020.
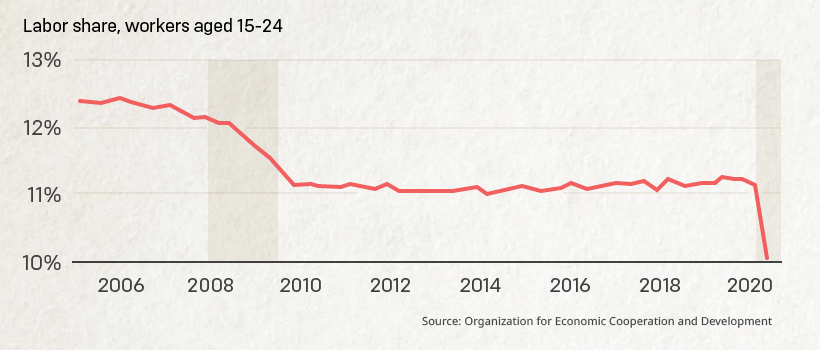
Note: This chart represents the data from G7 countries.
In terms of their future employment prospects, some economists are anticipating what they call ‘scarring’. Due to longer periods of unemployment, Gen Z will miss out on formative years gaining experience and training. This may impact them later in life, as their ability to climb the career ladder will be affected.
Starting out slower can also hit earnings. One study found that long periods of youth unemployment can reduce lifetime income by 2%. Finally, it is also postulated that with the current economic situation, Gen Zers may accept lower paying jobs setting them on a track of comparatively lower earnings over their lifetime.
Overall, there are many future implications associated with the current unemployment rate for Gen Zers. Often getting your foot in the door after college or high school is one of the hardest steps in starting a career. Once you’re in, you gain knowledge, skills, and the oh-so-coveted experience needed to get ahead.
The Kids are Alright?
One positive for Gen Z is that they have been found to be more risk averse and financially conscious than other generations, and were so even prior to COVID-19. Many of them were children during the 2008 Recession and became very cautious as a result.
They are also the first digital generation— the first to grow up without any memory of a time before the internet. Additionally, they have been called the first global generation. This could mean that they pioneer location-independent careers, create innovative revenue streams, and find new ways to define work.


Healthcare
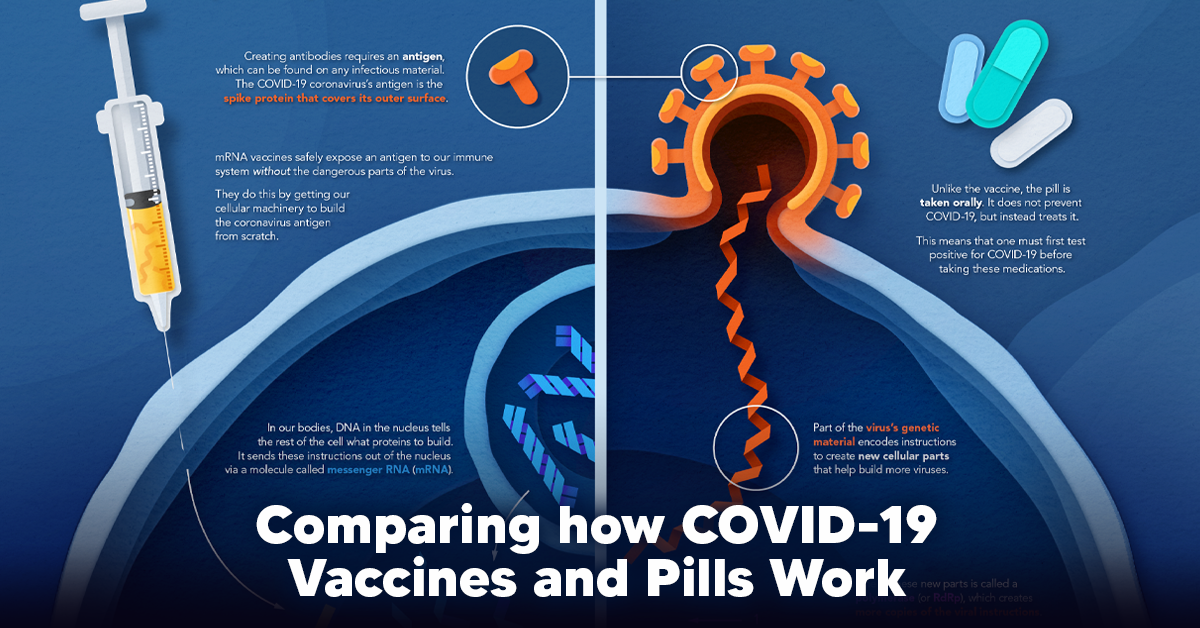
Visualizing How COVID-19 Antiviral Pills and Vaccines Work at the Cellular Level
Despite tackling the same disease, vaccines and antiviral pills work differently to combat COVID-19. We visualize how they work in the body.
Current Strategies to Tackle COVID-19
Since the pandemic started in 2020, a number of therapies have been developed to combat COVID-19.
The leading options for preventing infection include social distancing, mask-wearing, and vaccination. They are still recommended during the upsurge of the coronavirus’s latest mutation, the Omicron variant.
But in December 2021, The United States Food and Drug Administration (USDA) granted Emergency Use Authorization to two experimental pills for the treatment of new COVID-19 cases.
These medications, one made by Pfizer and the other by Merck & Co., hope to contribute to the fight against the coronavirus and its variants. Alongside vaccinations, they may help to curb extreme cases of COVID-19 by reducing the need for hospitalization.
Despite tackling the same disease, vaccines and pills work differently:
| Vaccines | Pills |
|---|---|
| Taken by injection | Taken by mouth |
| Used for prevention | Used for treatment only |
| Create an enhanced immune system by stimulating antibody production | Disrupt the assembly of new viral particles |
How a Vaccine Helps Prevent COVID-19
The main purpose of a vaccine is to prewarn the body of a potential COVID-19 infection by creating antibodies that target and destroy the coronavirus.
In order to do this, the immune system needs an antigen.
It’s difficult to do this risk-free since all antigens exist directly on a virus. Luckily, vaccines safely expose antigens to our immune systems without the dangerous parts of the virus.
In the case of COVID-19, the coronavirus’s antigen is the spike protein that covers its outer surface. Vaccines inject antigen-building instructions* and use our own cellular machinery to build the coronavirus antigen from scratch.
When exposed to the spike protein, the immune system begins to assemble antigen-specific antibodies. These antibodies wait for the opportunity to attack the real spike protein when a coronavirus enters the body. Since antibodies decrease over time, booster immunizations help to maintain a strong line of defense.
*While different vaccine technologies exist, they all do a similar thing: introduce an antigen and build a stronger immune system.
How COVID Antiviral Pills Work
Antiviral pills, unlike vaccines, are not a preventative strategy. Instead, they treat an infected individual experiencing symptoms from the virus.
Two drugs are now entering the market. Merck & Co.’s Lagevrio®, composed of one molecule, and Pfizer’s Paxlovid®, composed of two.
These medications disrupt specific processes in the viral assembly line to choke the virus’s ability to replicate.
The Mechanism of Molnupiravir
RNA-dependent RNA Polymerase (RdRp) is a cellular component that works similar to a photocopying machine for the virus’s genetic instructions. An infected host cell is forced to produce RdRp, which starts generating more copies of the virus’s RNA.
Molnupiravir, developed by Merck & Co., is a polymerase inhibitor. It inserts itself into the viral instructions that RdRp is copying, jumbling the contents. The RdRp then produces junk.
The Mechanism of Nirmatrelvir + Ritonavir
A replicating virus makes proteins necessary for its survival in a large, clumped mass called a polyprotein. A cellular component called a protease cuts a virus’s polyprotein into smaller, workable pieces.
Pfizer’s antiviral medication is a protease inhibitor made of two pills:
- The first pill, nirmatrelvir, stops protease from cutting viral products into smaller pieces.
- The second pill, ritonavir, protects nirmatrelvir from destruction by the body and allows it to keep working.
With a faulty polymerase or a large, unusable polyprotein, antiviral medications make it difficult for the coronavirus to replicate. If treated early enough, they can lessen the virus’s impact on the body.
The Future of COVID Antiviral Pills and Medications
Antiviral medications seem to have a bright future ahead of them.
COVID-19 antivirals are based on early research done on coronaviruses from the 2002-04 SARS-CoV and the 2012 MERS-CoV outbreaks. Current breakthroughs in this technology may pave the way for better pharmaceuticals in the future.
One half of Pfizer’s medication, ritonavir, currently treats many other viruses including HIV/AIDS.
Gilead Science is currently developing oral derivatives of remdesivir, another polymerase inhibitor currently only offered to inpatients in the United States.
More coronavirus antivirals are currently in the pipeline, offering a glimpse of control on the looming presence of COVID-19.
Author’s Note: The medical information in this article is an information resource only, and is not to be used or relied on for any diagnostic or treatment purposes. Please talk to your doctor before undergoing any treatment for COVID-19. If you become sick and believe you may have symptoms of COVID-19, please follow the CDC guidelines.

-

 Debt1 week ago
How Debt-to-GDP Ratios Have Changed Since 2000
-

 Markets2 weeks ago
Ranked: The World’s Top Flight Routes, by Revenue
-

 Countries2 weeks ago
Population Projections: The World’s 6 Largest Countries in 2075
-

 Markets2 weeks ago
The Top 10 States by Real GDP Growth in 2023
-

 Demographics2 weeks ago
The Smallest Gender Wage Gaps in OECD Countries
-

 United States2 weeks ago
Where U.S. Inflation Hit the Hardest in March 2024
-

 Green2 weeks ago
Top Countries By Forest Growth Since 2001
-

 United States2 weeks ago
Ranked: The Largest U.S. Corporations by Number of Employees