AI Week Wrap Report: See All the Visuals in One Place
Visualizing U.S. vs. Chinese AI Model Performance
Visualizing AI vs. Human Performance in Technical Tasks
The Ultimate Visual Breakdown of the AI Index Report 2025 (VC+)
Charted: The Surging Cost of Training AI Models
Ranked: Top Countries by Stock Market Ownership
Ranked: Top Countries by Stock Market Returns Since 2015
Ranked: America’s Smartest CEOs According to Linguistic Analysis
Timeline: Visualizing America’s Oldest Companies
Charted: The S&P 500’s Trump-Driven Tariff Turbulence
Mapped: Every U.S. State’s Top Import in 2024
Visualizing Government Debt-to-GDP Around the World
Visualized: Population vs. GDP by Global Region
Charted: Where the U.S. Imports Its Art From
Ranked: The Top 10 Most Wanted Skills for AI Jobs
Mapped: Financial Literacy Levels in All 50 U.S. States
Charted: How Much Income Tax Americans Pay by Wealth Bracket
Ranked: States Where Americans Have the Most Cash in the Bank
Ranked: Favorite Car Brands of the Ultra-Rich
Mapped: Countries Where People Don’t Exercise Enough
How U.S. Medicare Prices Compare to Other Rich Nations
Charted: How American Life Expectancy Compares to Its Peers
Mapped: Europe’s Tobacco Use By Country
Charted: Cigarette Smoking’s Decline in U.S. Young Adults
Charted: How Top Economies Generated Electricity in 2024
How the Largest Importers of Russian Fossil Fuels Have Changed (2022 vs. 2025)
Top 20 Countries by Battery Storage Capacity
Charted: Renewable Energy Capacity in the U.S. (2014-2024)
Visualizing Chinese EV Market Share Overseas
Mapped: The Most Popular Book Genre in Each U.S. State
Mapped: Daycare Costs by State
Mapped: Most Air-Polluted Cities in the World
Charted: The End-of-Life Recycling Rates of Select Metals
Mapped: Ukraine’s Mineral Resources
How Rich is Canada in Natural Resources?
Charted: Top Suppliers of Aluminum and Steel to the U.S.
How Much Gold Exists for Every Person on Earth?
Infographic: How Long Does Plastic Take to Decompose?
A Visual Breakdown of Global Waste by Type
Ranked: Companies with the Most Fossil Fuel and Cement CO2 Emissions
Charted: Share of Freshwater Resources by Country
Proper indoor air quality prevents airborne viruses like COVID-19 from spreading, and require technical solutions so businesses run smoothly.
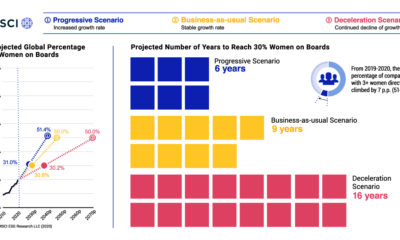
The representation of women on boards of directors a mixed bag. This graphic looks at the 10-year trend of women on corporate boards.
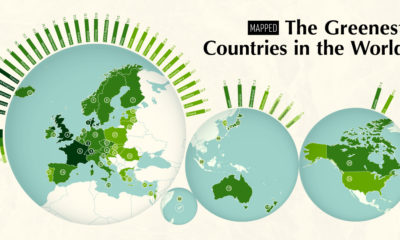
The world's growing focus on sustainability is a clear sign of the times. This map ranks the 40 greenest countries in the world.
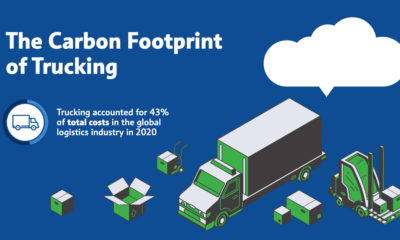
The impact of booming ecommerce and international trade on trucking's carbon footprint and GHG emissions is heavy—but there are solutions.
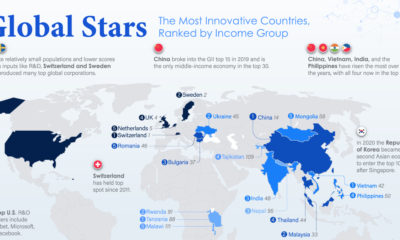
From Switzerland and China to Vietnam and Tanzania — here are the world's most innovative countries, taking income per capita into account.
By embracing uncertainty and making timely pivots, we visualize the bizarre origin stories of the most successful tech companies today.
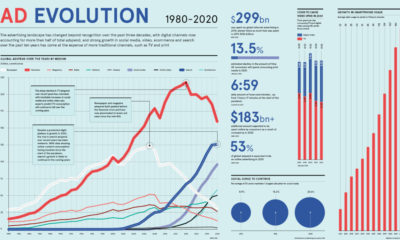
How has global advertising spending shifted over recent decades? We look at the data to see how both the industry and media have evolved.
Nearly 6,000 satellites circle our tiny planet. About 60% are space junk, 40% are operational—and hundreds more are launched every year.
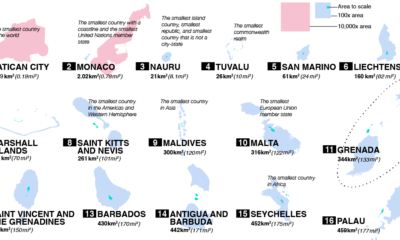
From Vatican City to Fiji, take a closer look at the world’s 100 smallest countries and their spheres of influence.
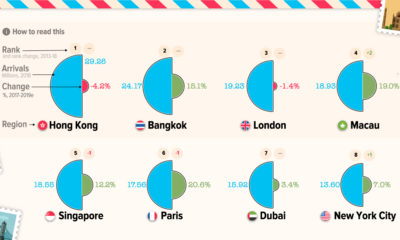
Even a pandemic can't curb wanderlust—when tourism comes back, here are the most popular city destinations that will be seeing visitors.
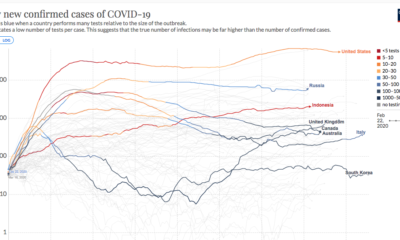
This continuously updated chart provides a more complete look at the efficacy of COVID-19 containment strategies.
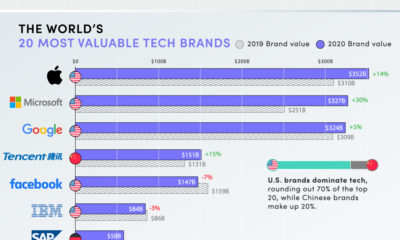
Tech giants and e-commerce brands are thriving—and running circles around less pandemic-proof brands.
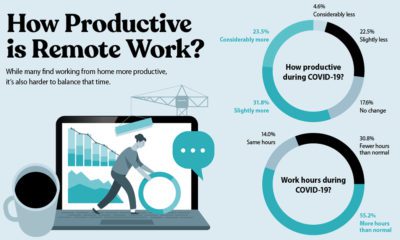
In an in-depth survey, startup founders and their teams revealed work-from-home experiences and their plans for a post-pandemic future.