Investor Education
Emerging Markets: A Growing Set of Opportunities

Emerging Markets: A Growing Set of Opportunities
With growth portfolios becoming increasingly focused on China, investors may develop a tendency to overlook the broader emerging markets universe.
To shed a light on some lesser-known opportunities, this infographic from BlackRock explores the evolving landscapes of Southeast Asia, Brazil, and India.
Putting Opportunity Into Perspective
Emerging markets often exhibit lower price/earnings ratios (P/E) when compared to developed markets. While this may suggest that the region is attractively priced, investors can also view emerging markets from a relative size perspective.
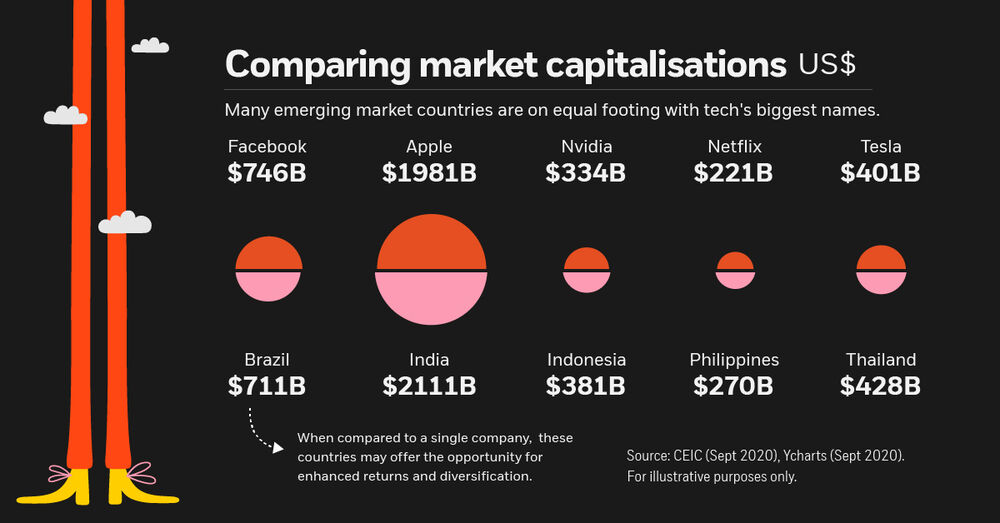
Here’s how the market capitalisations of several emerging markets compare to some of the biggest names in tech.
| Country | Total Country Market Cap (USD) | Comparable to | Company Market Cap (USD) |
|---|---|---|---|
| India | $2,111B | Apple | $1,981B |
| Brazil | $711B | $746B | |
| Thailand | $428B | Tesla | $401B |
| Indonesia | $381B | Nvidia | $334B |
| Philippines | $270B | Netflix | $221B |
As of September 2020. Source: CEIC, Ycharts
Investors often focus on tech companies when seeking long-term growth, but with valuations at their highest levels since the dot-com bubble, uncertainty could begin to rise.
That’s where emerging markets can come into play. A country such as Brazil, which contains over 400 listed companies, may offer enhanced returns and diversification when compared to a single company. To learn more, here’s a closer look at three emerging markets opportunities that might be flying under your radar.
1. Southeast Asia: A Rising Digital Economy
Southeast Asia (SEA), which includes Indonesia, Malaysia, Philippines, Singapore, Thailand and Vietnam, is quickly emerging as the next digital giant. The region is currently home to an online population of 400 million people, a 53% increase from 2015.
With so many people going online, companies such as Grab, a local ride-share provider, have accumulated millions of new users. This spells good news for investors, with SEA’s internet economy expected to reach a gross merchandise value (GMV) of $309B by 2025.
| Year | SEA Internet Economy GMV* (USD) |
|---|---|
| 2015 | $32B |
| 2019 | $100B |
| 2020 projected | $105B |
| 2025 projected | $309B |
*GMV is the total value of merchandise sold through a customer-to-customer exchange site.
Source: Google, Temasek, Bain & Company
Favourable demographics are also contributing to this growth. The region is expecting 50 million entrants to its middle class by 2022 and has an average age of just 30.2 years. That’s roughly 10 years younger than the UK, and 18 years younger than Japan.
Furthermore, this growing cohort of wealthier consumers is already embracing technology. Ecommerce, a subsector of SEA’s internet economy, has added 100 million new users over the past 5 years, with GMV increasing from $5 billion in 2015 to $62 billion in 2020.
2. Brazil: Improvements in Gender Diversity
Gender diversity has been a historical weak point for Brazilian companies, but female representation in the country has been improving. Here’s how the percentage of women on corporate boards differs between Brazil, emerging markets, and developed markets.
| Year | Brazil (n=53) | MSCI Emerging Markets Index (n=1,323) | MSCI World Index (n=1,584) |
|---|---|---|---|
| 2016 | 5.8% | 9.0% | 20.3% |
| 2017 | 8.4% | 10.2% | 20.4% |
| 2018 | 8.0% | 11.2% | 21.6% |
| 2019 | 11.9% | 12.1% | 25.0% |
| 2020 | 13.7% | 13.0% | 26.2% |
Source: MSCI
Brazil surpassed the emerging markets average in 2020 thanks to increased awareness and initiatives by its financial sector. Brazil’s B3 exchange, for example, was the first stock exchange in the Americas to sign the Women’s Empowerment Principles, an initiative by UN Women.
Greater female representation is welcome news for both investors and society alike. Research from the Boston Consulting Group found that companies with above-average diversity tended to be more innovative, generating a greater share of revenue from recently launched products.
3. India: Promising Opportunities in Healthcare and Real Estate
As part of its National Health Protection Scheme, India’s government is looking to provide 500 million people with government-sponsored health insurance. If progress is kept on track, health sector revenues could increase at a compound annual growth rate (CAGR) of 18%, making it one of the world’s fastest growing markets in the world.
| Year | Revenue from India's Healthcare Sector (USD) |
|---|---|
| 2016 | $140B |
| 2017 | $160B |
| 2020 Projected | $280B |
| 2022 Projected | $372B |
Source: IBEF
Achieving this goal will require participation from both the public and private sectors. For example, India’s government has pledged to increase public health spending from 1.1% of GDP in 2018, to 2.5% by 2025. Additionally, it allows 100% foreign direct investment (FDI) in projects such as hospitals.
India is adopting a similar strategy for real estate, which has struggled to keep up with growing demand. In India’s top eight cities, the housing deficit amounts to over 3 million units.
| Income Group | Demand | Supply | Deficit |
| Lower income | 1,982,000 | 25,000 | 1,957,000 |
| Middle income | 1,457,000 | 647,000 | 810,000 |
| High income | 717,000 | 351,000 | 366,000 |
| Total | 4,156,000 | 1,023,000 | 3,133,000 |
Source: IBEF
To accelerate development, India’s government has allowed 100% FDI in residential and retail developments since 2018. Analysts believe that the country’s real estate market could become the third largest in the world by 2030.
There’s More Than Meets The Eye
Over the span of a few years, China has grown to comprise nearly 40% of the MSCI Emerging Markets Index—but this doesn’t mean that China should receive all of the attention from investors.
With almost 30 countries to explore, China and the opportunities discussed above are just a subset of what emerging markets have to offer. For growth-minded investors, giving this diverse region a closer look could be rewarding.
Investor Education
How MSCI Builds Thematic Indexes: A Step-by-Step Guide
From developing an index objective to choosing relevant stocks, this graphic breaks down how MSCI builds thematic indexes using examples.
How MSCI Builds Thematic Indexes: A Step-by-Step Guide
Have you ever wondered how MSCI builds its thematic indexes?
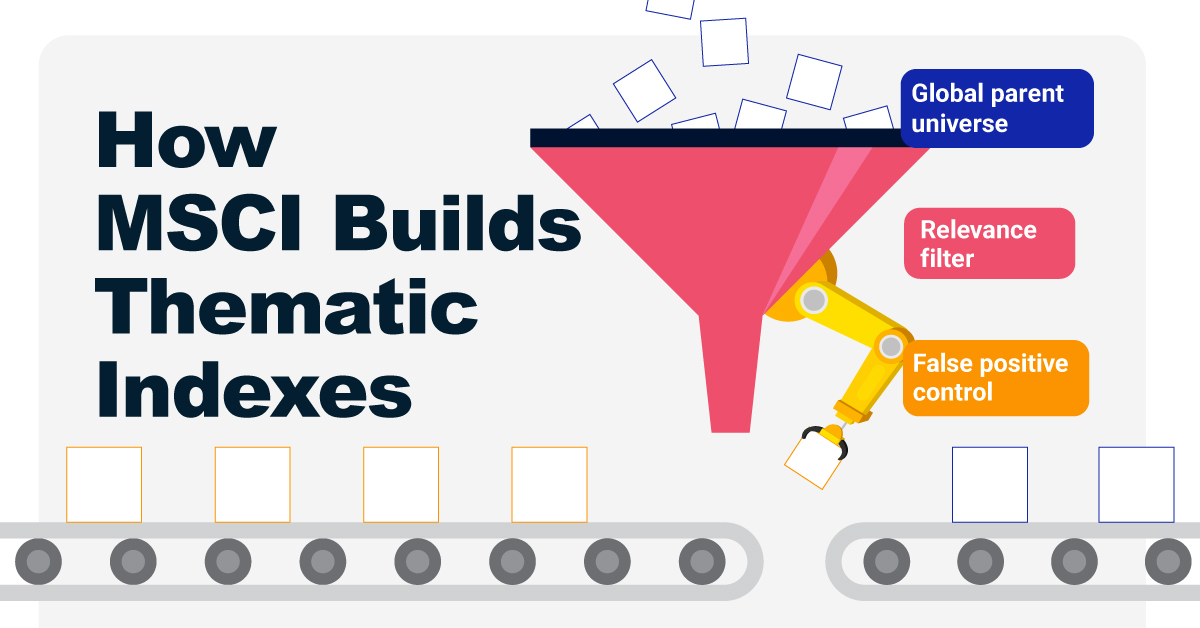
To capture long-term, structural trends that could drive business performance in the future, the company follows a systematic approach. This graphic from MSCI breaks down each step in the process used to create its thematic indexes.
Step 1: Develop an Index Objective
MSCI first builds a broad statement of what the theme aims to capture based on extensive research and insights from industry experts.
Steps 2 and 3: List Sub-Themes, Generate Keyword List
Together with experts, MSCI creates a list of sub-themes or “seedwords” to identify aligned business activities.
The team then assembles a collection of suitable documents describing the theme. Natural language processing efficiently analyzes word frequency and relevance to generate a more detailed set of keywords contextually similar to the seedwords.
Step 4: Find Relevant Companies
By analyzing financial reports, MSCI picks companies relevant to the theme using two methods:
- Direct approach: Revenue from a company’s business segment is considered 100% relevant if the segment name matches a theme keyword. Standard Industrial Classification (SIC) codes from these directly-matched segments make up the eligible SIC code list used in the indirect approach.
- Indirect approach: If a segment name doesn’t match theme keywords, MSCI will:
- Analyze the density of theme keywords mentioned in the company’s description. A minimum of two unique keywords is required.
- The keyword density determines a “discount factor” to reflect lower certainty in theme alignment.
- Revenue from business segments with an eligible SIC code, regardless of how they are named, is scaled down by the discount factor.
The total percentage of revenue applicable to the theme from both approaches determines a company’s relevance score.
Step 5: Select the Stocks
Finally, MSCI narrows down the stocks that will be included:
- Global parent universe: The ACWI Investable Market Index (IMI) is the starting point for standard thematic indexes.
- Relevance filter: The universe is filtered for companies with a relevance score of at least 25%.
- False positive control: Eligible companies that are mapped to un-related GICS sub-industries are removed.
Companies with higher relevance scores and market caps have a higher weighting in the index, with the maximum weighting for any one issuer capped at 5%. The final selected stocks span various sectors.
MSCI Thematic Indexes: Regularly Updated and Rules-Based
Once an index is built, it is reviewed semi-annually and updated based on:
- Changes to the parent index
- Changes at individual companies
- Theme developments based on expert input
Theme keywords are reviewed yearly in May. Overall, MSCI’s thematic index construction process is objective, scalable, and flexible. The process can be customized based on the theme(s) you want to capture.

Learn more about MSCI’s thematic indexes.

-

 Investor Education6 months ago
The 20 Most Common Investing Mistakes, in One Chart
Here are the most common investing mistakes to avoid, from emotionally-driven investing to paying too much in fees.
-
 Stocks10 months ago
Visualizing BlackRock’s Top Equity Holdings
BlackRock is the world’s largest asset manager, with over $9 trillion in holdings. Here are the company’s top equity holdings.
-
 Investor Education11 months ago
10-Year Annualized Forecasts for Major Asset Classes
This infographic visualizes 10-year annualized forecasts for both equities and fixed income using data from Vanguard.
-

 Investor Education1 year ago
Visualizing 90 Years of Stock and Bond Portfolio Performance
How have investment returns for different portfolio allocations of stocks and bonds compared over the last 90 years?
-
 Debt2 years ago
Countries with the Highest Default Risk in 2022
In this infographic, we examine new data that ranks the top 25 countries by their default risk.
-
 Markets2 years ago
The Best Months for Stock Market Gains
This infographic analyzes over 30 years of stock market performance to identify the best and worst months for gains.
-

 Debt1 week ago
How Debt-to-GDP Ratios Have Changed Since 2000
-

 Markets2 weeks ago
Ranked: The World’s Top Flight Routes, by Revenue
-

 Countries2 weeks ago
Population Projections: The World’s 6 Largest Countries in 2075
-

 Markets2 weeks ago
The Top 10 States by Real GDP Growth in 2023
-

 Demographics2 weeks ago
The Smallest Gender Wage Gaps in OECD Countries
-

 Economy2 weeks ago
Where U.S. Inflation Hit the Hardest in March 2024
-

 Green2 weeks ago
Top Countries By Forest Growth Since 2001
-

 United States2 weeks ago
Ranked: The Largest U.S. Corporations by Number of Employees

