Markets
Visualizing How COVID-19 Has Impacted Global Wages
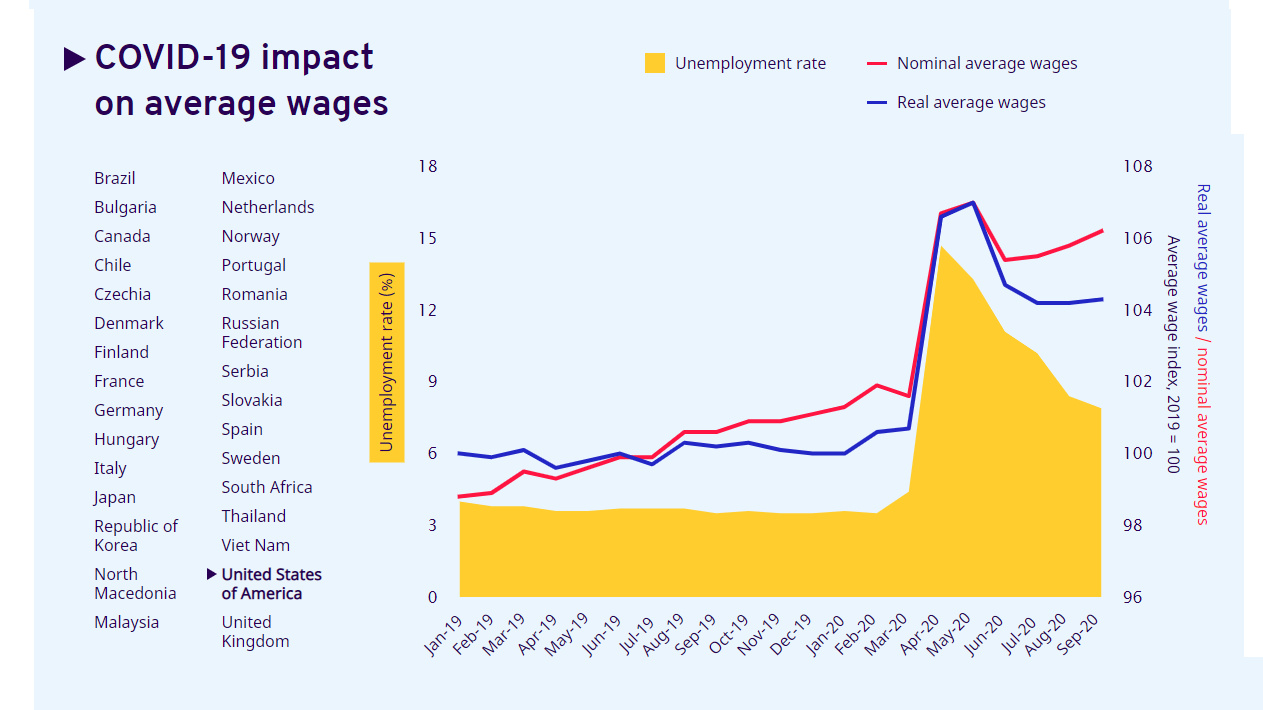
Visualizing How COVID-19 Impacted Global Wages
In the years leading up to the pandemic, annual global wage growth was fluctuating stably between 1.6%–2.2%. Now, income, working hours, and employment have all been impacted by COVID-19—but for those who have held onto their jobs, how have wages been affected?
This interactive chart from the International Labour Organization (ILO) reveals how the global pandemic has affected both nominal and real wages, as well as unemployment rates.
The date of data collection varies on a country-by-country basis, using the most recent available data. The most recent measurement of wage indices is from September 2020 in some countries and the least recent available data comes from Q2’2020. In select countries the date of unemployment rates and wage indices are different. As a point of reference, the average wage index in 2019 was 100.
Note: the ILO uses national statistics databases and only the select countries had enough recent, available data for all three elements: nominal wages, real wages, and unemployment.
Where Average Wages are Falling
Average wages in many countries either plateaued or decreased significantly during the global pandemic. Sharp declines happened across a number of European countries, as well as in South Africa and Japan, for example.
| Country | Unemployment Rate | Real Wage Index | Nominal Wage Index |
|---|---|---|---|
| 🇻🇳 Vietnam (as of Q2'2020) | 2.7% | 92.4 | 94.4 |
| 🇪🇸 Spain (as of Q2'2020) | 15.3% | 92.5 | 92.3 |
| 🇲🇽 Mexico (as of August 2020) | 5% | 94.4 | 98 |
| 🇿🇦 South Africa (as of Q2'2020) | 23.3% | 95.2 | 97.4 |
| 🇰🇷 South Korea (as of August 2020) | 3.1% | 96.2 | 96.8 |
| 🇷🇺 Russia (as of August 2020) | 6.4% | 96.9 | 100.5 |
| 🇨🇿 Czech Republic (as of Q2'2020) | 6.6% | 97.8 | 99.6 |
| 🇸🇰 Slovakia (as of Q2'2020) | 6.6% | 97.8 | 99.6 |
| 🇯🇵 Japan (as of August 2020) | 3% | 98.6 | 98.7 |
| 🇫🇮 Finland (as of August 2020) | 7.9% | 99.6 | 100.1 |
| 🇩🇪 Germany (as of Q2'2020) | 4.4% | 99.6 | 100.5 |
Falling wages, however, do not necessarily mean that people are receiving less money, as many subsidies have been put in place to help cushion income or job loss.
In many cases where wage indices declined, employment did not. This is because different job retention schemes were put in place, wherein workers were furloughed, but were given a portion of their wages from the national government. This allowed unemployment rates to remain steady while wages tapered off.
In Europe, where wages have dropped considerably in many countries, wage subsidies have compensated for nearly 40% of wage bill loss in select countries. But while high income countries can afford to inject stimulus into their economies, most lower income countries cannot. This has come to be described as the fiscal stimulus gap.
Where Average Wages are Rising
While perhaps counterintuitive, rising average wages are in no way an inherent sign of a recovering economy or labor market. Regardless, when compared to 2019, wages have actually increased in the majority of countries, such as Brazil, Canada, United States, Italy, and the UK.
| Country | Unemployment Rate | Real Wage Index | Nominal Wage Index |
|---|---|---|---|
| 🇨🇦 Canada (as of August 2020) | 10.6% | 107.6 | 108.4 |
| 🇲🇰 North Macedonia (Unemployment: Jun '20; wage data: Aug '20) | 16.7% | 107.6 | 109.7 |
| 🇧🇷 Brazil (as of Q2'2020) | 13.3% | 107.3 | 109.6 |
| 🇧🇬 Bulgaria (as of June 2020) | 5.9% | 106.9 | 107.8 |
| 🇭🇺 Hungary (as of August 2020) | 4.4% | 106.3 | 106.5 |
| 🇮🇹 Italy (as of Q2'2020) | 8.3% | 106.2 | 106.2 |
| 🇫🇷 France (as of Q2'2020) | 7.1% | 105.4 | 105.9 |
| 🇷🇸 Serbia (Unemployment: Jun '20; wage data: Aug '20) | 7.7% | 104.7 | 106.7 |
| 🇳🇴 Norway (as of Q2'2020) | 4.6% | 104.5 | 105.6 |
| 🇺🇸 U.S. (as of September 2020) | 7.9% | 104.3 | 106.2 |
| 🇵🇹 Portugal (as of June 2020) | 7.3% | 103.2 | 104.2 |
| 🇹🇭 Thailand (as of Q2'2020) | 2% | 103 | 100.6 |
| 🇷🇴 Romania (as of August 2020) | 5.3% | 102.5 | 105.2 |
| 🇳🇱 Netherlands (as of September 2020) | 4.4% | 102 | 103.6 |
| 🇬🇧 UK (as of September 2020) | 4.8% | 101.5 | 102.4 |
| 🇩🇰 Denmark (as of Q2'2020) | 5.3% | 101.4 | 101.5 |
| 🇸🇪 Sweden (as of August 2020) | 8.8% | 100.8 | 101.6 |
| 🇨🇱 Chile (as of August 2020) | 12.3% | 100.6 | 103.4 |
| 🇲🇾 Malaysia (as of June 2020) | 4.7% | 100.2 | 99 |
One reason for higher average wages is something called the compositional effect. The compositional effect is what occurs when wages are not actually increasing, but the makeup of employment changes. For example, the loss and subsequent absence of many lower paying jobs from the labor market due to COVID-19 can skew the average wage upwards.
Brazil is a prime example of the compositional effect. As both nominal and real wages increase, so does unemployment. Brazil’s current unemployment rate is 13.3%, while wages have skyrocketed to a real wage index of 107.3 during the first half of 2020.
The loss of these lower paying jobs has been extremely widespread, most negatively impacting informal workers, self-employed vendors, and migrant workers. Some policymakers have seen this as an opportunity to call for universal basic income. Even with job retention schemes to keep unemployment steady, many people are earning far less income and may never return to normal working hours in their current positions.


Markets
The European Stock Market: Attractive Valuations Offer Opportunities
On average, the European stock market has valuations that are nearly 50% lower than U.S. valuations. But how can you access the market?


European Stock Market: Attractive Valuations Offer Opportunities
Europe is known for some established brands, from L’Oréal to Louis Vuitton. However, the European stock market offers additional opportunities that may be lesser known.
The above infographic, sponsored by STOXX, outlines why investors may want to consider European stocks.
Attractive Valuations
Compared to most North American and Asian markets, European stocks offer lower or comparable valuations.
| Index | Price-to-Earnings Ratio | Price-to-Book Ratio |
|---|---|---|
| EURO STOXX 50 | 14.9 | 2.2 |
| STOXX Europe 600 | 14.4 | 2 |
| U.S. | 25.9 | 4.7 |
| Canada | 16.1 | 1.8 |
| Japan | 15.4 | 1.6 |
| Asia Pacific ex. China | 17.1 | 1.8 |
Data as of February 29, 2024. See graphic for full index names. Ratios based on trailing 12 month financials. The price to earnings ratio excludes companies with negative earnings.
On average, European valuations are nearly 50% lower than U.S. valuations, potentially offering an affordable entry point for investors.
Research also shows that lower price ratios have historically led to higher long-term returns.
Market Movements Not Closely Connected
Over the last decade, the European stock market had low-to-moderate correlation with North American and Asian equities.
The below chart shows correlations from February 2014 to February 2024. A value closer to zero indicates low correlation, while a value of one would indicate that two regions are moving in perfect unison.
| EURO STOXX 50 | STOXX EUROPE 600 | U.S. | Canada | Japan | Asia Pacific ex. China |
|
|---|---|---|---|---|---|---|
| EURO STOXX 50 | 1.00 | 0.97 | 0.55 | 0.67 | 0.24 | 0.43 |
| STOXX EUROPE 600 | 1.00 | 0.56 | 0.71 | 0.28 | 0.48 | |
| U.S. | 1.00 | 0.73 | 0.12 | 0.25 | ||
| Canada | 1.00 | 0.22 | 0.40 | |||
| Japan | 1.00 | 0.88 | ||||
| Asia Pacific ex. China | 1.00 |
Data is based on daily USD returns.
European equities had relatively independent market movements from North American and Asian markets. One contributing factor could be the differing sector weights in each market. For instance, technology makes up a quarter of the U.S. market, but health care and industrials dominate the broader European market.
Ultimately, European equities can enhance portfolio diversification and have the potential to mitigate risk for investors.
Tracking the Market
For investors interested in European equities, STOXX offers a variety of flagship indices:
| Index | Description | Market Cap |
|---|---|---|
| STOXX Europe 600 | Pan-regional, broad market | €10.5T |
| STOXX Developed Europe | Pan-regional, broad-market | €9.9T |
| STOXX Europe 600 ESG-X | Pan-regional, broad market, sustainability focus | €9.7T |
| STOXX Europe 50 | Pan-regional, blue-chip | €5.1T |
| EURO STOXX 50 | Eurozone, blue-chip | €3.5T |
Data is as of February 29, 2024. Market cap is free float, which represents the shares that are readily available for public trading on stock exchanges.
The EURO STOXX 50 tracks the Eurozone’s biggest and most traded companies. It also underlies one of the world’s largest ranges of ETFs and mutual funds. As of November 2023, there were €27.3 billion in ETFs and €23.5B in mutual fund assets under management tracking the index.
“For the past 25 years, the EURO STOXX 50 has served as an accurate, reliable and tradable representation of the Eurozone equity market.”
— Axel Lomholt, General Manager at STOXX
Partnering with STOXX to Track the European Stock Market
Are you interested in European equities? STOXX can be a valuable partner:
- Comprehensive, liquid and investable ecosystem
- European heritage, global reach
- Highly sophisticated customization capabilities
- Open architecture approach to using data
- Close partnerships with clients
- Part of ISS STOXX and Deutsche Börse Group
With a full suite of indices, STOXX can help you benchmark against the European stock market.
Learn how STOXX’s European indices offer liquid and effective market access.

-

 Economy2 days ago
Economic Growth Forecasts for G7 and BRICS Countries in 2024
The IMF has released its economic growth forecasts for 2024. How do the G7 and BRICS countries compare?
-

 Markets2 weeks ago
U.S. Debt Interest Payments Reach $1 Trillion
U.S. debt interest payments have surged past the $1 trillion dollar mark, amid high interest rates and an ever-expanding debt burden.
-

 United States2 weeks ago
Ranked: The Largest U.S. Corporations by Number of Employees
We visualized the top U.S. companies by employees, revealing the massive scale of retailers like Walmart, Target, and Home Depot.
-

 Markets2 weeks ago
The Top 10 States by Real GDP Growth in 2023
This graphic shows the states with the highest real GDP growth rate in 2023, largely propelled by the oil and gas boom.
-

 Markets2 weeks ago
Ranked: The World’s Top Flight Routes, by Revenue
In this graphic, we show the highest earning flight routes globally as air travel continued to rebound in 2023.
-

 Markets3 weeks ago
Ranked: The Most Valuable Housing Markets in America
The U.S. residential real estate market is worth a staggering $47.5 trillion. Here are the most valuable housing markets in the country.

-

 Debt1 week ago
How Debt-to-GDP Ratios Have Changed Since 2000
-
Markets2 weeks ago
Ranked: The World’s Top Flight Routes, by Revenue
-

 Countries2 weeks ago
Population Projections: The World’s 6 Largest Countries in 2075
-
Markets2 weeks ago
The Top 10 States by Real GDP Growth in 2023
-

 Demographics2 weeks ago
The Smallest Gender Wage Gaps in OECD Countries
-

 United States2 weeks ago
Where U.S. Inflation Hit the Hardest in March 2024
-

 Green2 weeks ago
Top Countries By Forest Growth Since 2001
-
United States2 weeks ago
Ranked: The Largest U.S. Corporations by Number of Employees